 Open Access Article
Tuning the dielectric response in a nanocomposite material through nanoparticle morphology†
Archita N. S. Adluri ,
Brett Henderson and
Irina Paci
 *
*
Department of Chemistry, Centre for Advanced Materials and Related Technologies, University of Victoria, PO Box 1700, 3800 Finnerty Road, Victoria, BC V8W 2Y2, Canada. E-mail: ipaci@uvic.ca
First published on 6th April 2022
Abstract
Ceramic materials such as metal oxides, mixed metal oxides and silicates, constitute a broadly-used, high-performance technology for electronic insulators. The introduction of metal cluster dopants and molecular-scale inclusions in a dielectric matrix provides an opportunity for manufacturing new high-κ solid-state dielectrics with tunable field–response properties. The quantum properties of these metallic nanoparticles depend strongly on their size and shape, a characteristic that can be exploited in changing the response properties of a material, whereas the small nanoparticle size can help limit the issues of conduction and current leakage. Here, we model the polarization of molecular-scale silver inclusions in a magnesium oxide matrix, using the Modern Theory of Polarization and Car–Parrinello Molecular Dynamics (CPMD). Details of the implementation are laid out, including handling of current jumps due to the distortion of the matrix during the simulation. Several trends in the dielectric response are considered in this work, including the effects of nanoparticle size, shape and orientation relative to the applied field. Dielectric permittivity enhancements of 30–100% are observed with inclusion sizes varying from 8 to 32 atoms, considering both rod-like and disk-like inclusions, with alignment either parallel or perpendicular to the external field.
1 Introduction
Advancements in semiconductor manufacturing have lead to increased miniaturization and densification of electrical circuits, allowing for increasing computing power or more efficient charge storage. At the current stage, miniaturization no longer answers the need for advancing device performance, and the focus has shifted on the development and integration of new materials, with improved properties and connectivity.1–3 One area in high need of development is that of materials with tunable dielectric constant (κ) for electrical and computational devices that rely on metal-oxide semiconducting materials: transistors, high-density charge storage super-capacitors, and emerging technologies in quantum computing.4–8Traditional Si/SiO2 has given way to more complex, higher-permittivity materials such as silicon–germanium and hafnium oxides,9 nitrogen-doping,10 polymer enriched metal-oxides11 and other multi-phase materials in order to address these issues. Nanocomposite (NC) materials that combine a standard dielectric matrix with inclusions of very-high-κ, even conducting materials, can be manufactured to specified dielectric and mechanical properties.12,13 These composites have thus been proposed as candidates for expanding the range of materials available for device engineering.
Molecular metallic nanoparticles of various sizes and shapes, 2D sheet-type dopants such as graphene sheets, metal and halogen doping and mixed-metal oxides have all been considered experimentally as inclusions.14,15 The aim is to selectively modify the permittivity (dielectric constant κ), and therefore the charge capacity of the resulting material. The research so far has shown that at the atomic scale, even a point defect or a single atom defect lead to noticeable changes in the polarization potential of a material.16,17
Metallic nanoparticles in the molecular regime (nanoclusters with up to 100 or so atoms) bridge the gap between single-atom dopants in classical semiconductors and traditional nanoparticles with “metallic properties”, while providing a range of unique features.18,19 Molecular nanoparticles (mNPs) are insulating, do not present a band structure and the high-electron density of traditional nanoparticles, which often leads to low percolation thresholds and tunnelling. mNPs are essentially a source of highly polarizable electron density, their quantum behaviour requiring quantum mechanical treatments to model their contribution to local polarization effects. In recent years, methods for synthesis of noble metal mNPs (Ag, Au, Pt) with atomic precision have been developed, and their distinctive properties have been capitalized in applications such as heterogeneous catalysis,20–23 photocatalysis,24 chemical and medical sensing,25–28 and in composite materials with intriguing functionalities.29–31 As methods for their synthesis have been developed, Ag nanoclusters have become a popular choice for materials' synthesis, due to their enhanced optoelectronic properties, low cost and reduced toxicity.32,33 From a computational standpoint, Ag is a well understood metal with a lower electron count than Au and Pt, and does not require consideration of relativistic effects in calculations.
MgO is a naturally abundant, common ceramic dielectric, with a high permittivity for a single-metal oxide (εr ≈ 9), with applications generally driven by its high thermal conductivity, a high coefficient of thermal expansion compatible with metal contact layers, and high melting point.34–39 More recently, highly ordered MgO crystals were found to exhibit giant magnetoresistance40–42 and high transparency,43 making it a suitable matrix component for new categories of multifunctional materials for electronic and optical applications. Moreover, its simple face-centred cubic lattice with a low unit cell occupancy, its predominantly ionic polarization, and its wide bandgap (around 7 eV) make MgO relatively straightforward to treat computationally, and thus a good model dielectric material for metal/oxide nanocomposites. Particularly, the lower number of polarizable d-electrons than those of other mid/high-κ materials, such as HfO2, is important in Car–Parrinello molecular dynamics, where valence electrons in matrix atoms greatly increase the computational cost.
Theoretical approaches for predicting the response of mixed materials to applied fields and for optimizing their morphology and elemental composition have been developed, although several challenges remain. Effective medium approximations44–46 are suitable for macroscale mixtures, especially where experimental data is broadly available. Classical atomistic approaches work at the nanoscale as well as for certain optical responses, but do not capture, or provide insight into, the quantum response and local field effects that can dominate the dielectric response in complex-structured solid-state materials.47,48 Direct DFT approaches have been used for doped materials, but a complete treatment of the quantum polarization of the mixed material has not been attempted until recently.49
In a previous publication from our group,49 we used the modern theory of polarization50,51 to develop a model for describing the polarization of mNP NCs. We sought to unravel the contributions of the inclusion and matrix to the overall response of a model Ag8/MgO NC and found significant interfacial effects between the mNP and matrix, contributing to a greater than expected polarization response. Here, we follow up on that initial study, to explore the effects of the distribution and shape of the mNP inclusions on the dielectric capacity of a metal-oxide material. We find that for small mNP sizes of less than 30 atoms, the size, shape and orientation of the inclusion greatly alter how the inclusion electrons behave and therefore affect polarization at both the atomic scale, and at material scale. These effects are important to understand as we leverage combinations of materials with desirable properties to design smaller and more precise microelectronic devices.
2 Theory and model systems
2.1 Models
We considered a series of NCs based on an MgO matrix, containing silver mNPs inclusions of varying shapes and sizes. Models were built using the Avogadro software,52 based on an ideal face-centered cubic (FCC) MgO lattice. An example NC with a Ag18 inclusion is shown in Fig. 1.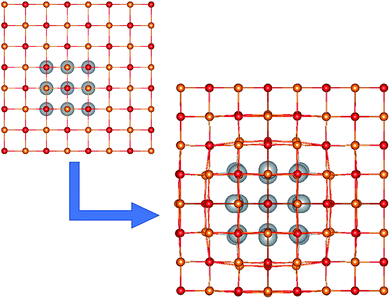 | ||
| Fig. 1 The unit cell of the Ag18/MgO NC, before and after geometry optimization. Mg2+, O2− and Ag are shown in orange, red and grey, respectively. | ||
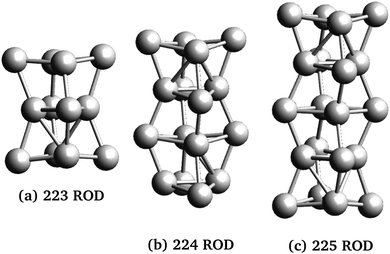
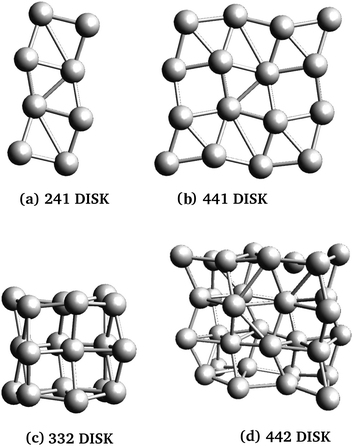
Three rod-like inclusions and five disk-like inclusions were considered, as shown in Fig. 2 and 3. Inclusions were built initially by replacing MgO ions with Ag atoms, and the entire structure was allowed to relax in the structural optimization phase of the calculation, as described in Section 2.2.1. The matrix extended at least 2 Mg–O layers beyond the edge of the inclusion in each direction. This was done to prevent the cell from conducting into its periodic images while maintaining control of loading and cell size, and ensuring appropriate lattice continuation at boundaries. % loading ratios were between 3–5.5%. Atom-based % loading values are slightly lower than volume-based values. However, for atomistic calculations, the definition of atomic and thus inclusion volumes is ambiguous,53 and moreover, inclusion volumes are subject to change during the simulation. For consistency, we report atomic number % loading here.
2.2 Low-frequency ionic and electronic polarization
The process for calculating the low-frequency polarization of a NC material using the modern theory of polarization, as well as our methodology of partitioning the complex material's response, are described in detail in ref. 49. Briefly, the CPMD method is used in the Quantum Espresso (QE) code,54,55 with the two major stages of the calculation, structural relaxation and polarization, outlined in the following two subsections.
 | (1) |
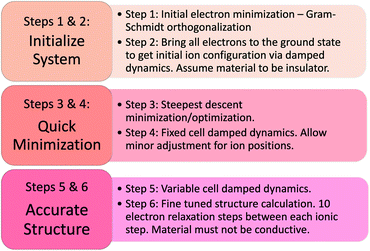
Prior to applying an electric field, the reference polarization Pzerofield is calculated in Step 7 (Fig. 5) for the relaxed geometries and electronic structures produced in Step 6 (Fig. 4). This damped polarization is prone to computational errors due to sudden movements and high electron velocities that can cause integration/orthogonalization errors. This is fixed by manually adjusting velocities and dampening parameters in Step 7.
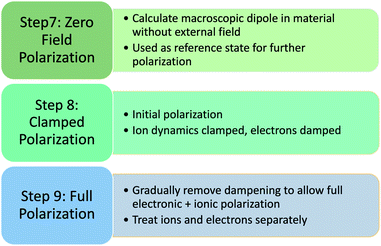 | ||
| Fig. 5 Polarization steps using Quantum Espresso – step numbers continued from Structure calculation (Fig. 4). | ||
The field-induced electronic and ionic polarization were calculated using damped dynamics. A homogeneous electric field E = 0.001 a.u. is applied in the z direction in Step 8 (Fig. 4), and the electronic density is allowed to relax while holding the ions fixed (Fig. 4, Step 8). This step models the high frequency dielectric response ε∞ and is necessary for calculating the Born effective charges discussed below. Finally, the ions and electrons are allowed to relax together in Step 9, which allows calculation of the field-induced polarization Prelaxed and the low-frequency dielectric constant.
The requirement of a consistent choice of unit cell becomes problematic when that unit cell is stressed during the polarization process, or when charges are displaced beyond cell boundaries. In the periodic calculations described here, some of the charge density will polarize into neighboring image cells (or, more specifically, to the other side of the simulation box), shifting the charge distribution relative to the coordinate system in which the “reference” polarization was calculated. The reported polarization then shifts by a positive or negative multiple of the quantum of polarization (in this case, one box length along the polarization direction for each displaced electron). These effects are more likely to arise when the matrix is deformed by larger, anisotropic inclusions, thus monitoring and correction of cell polarization becomes essential. However, it is important to note that monitoring cell polarization for quantum of polarization discontinuities should be performed regardless of the system's anisotropy.
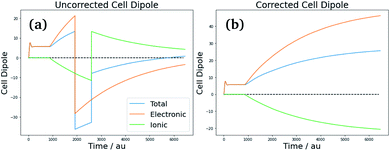
Consequently, care must be taken when calculating the effective polarization, particularly for anisotropic, low-symmetry systems or deformed crystal lattices. As discussed in ref. 51 however, the system follows a single “polarization branch” as it structurally and electronically adapts to the applied field – i.e., the evolution of polarization during the field-on simulation should be smooth. The corrections for polarization jumps can be done during post-processing, and involve checking the full simulation run for discontinuities and inconsistencies of the total dipole of the simulation cell [see Fig. 6(a) for an example], followed by shifting its value (and respectively the value of the volume-adjusted permittivity) by the required number of polarization quanta [Fig. 6(b)].
2.3 Born effective charge
To understand the electronic polarization effects in the composite, we examine its Born effective charge tensor ( , BEC). BECs reflect the changes in the polarization of a material as a result of ionic displacements. The BEC of an individual atom or ion is defined as the change in the force acting on that atom or ion as a result of the application of an external electric field:
 | (2) |
 are the BEC tensor elements at the nucleus α, Ej is the j-direction component of the external field, and Fα;i is the i-direction component of the force acting on α.
In a bulk ionic crystal, the static charges of constituent elements (or ions) are their nominal valence charge59 (−2 for oxygen, +2 for magnesium in the case of MgO). Upon application of an electric field, the average overall BEC tensor remains the same, as all the atoms experience the field uniformly. In a NC, however, significant changes in the charge distribution of the matrix ions arise from the influence of mNP electrons, especially under an applied field. This impact is strongest for the ions near the mNP–matrix interface, where the local field effects of the polarizable mNP electrons are strongest. BEC maps are thus a useful tool for depicting the local charge density and spatial distribution of induced fields at small scales. Here, BECs are calculated using eqn (2).
2.4 Numerical details
Electronic structure calculations were carried out in a zero-field environment. Electronic structure, relaxed crystal structures and polarization were calculated using the CPMD methodology implemented in the Quantum Espresso code versions 6.0 and 6.6, with a plane wave-basis and the LDA functional. Test calculations were run using GGA functionals such as PBE. However, the structural minimization steps were significantly slower in these calculations, and furthermore, convergence of the polarization was impeded in GGA-based calculations. Mg atoms were described using Bachelet–Hamann–Schluter60 norm-conserving pseudopotentials, whereas Rappe–Rabe–Kaxiras–Joannopoulos61 ultra-soft pseudopotentials from Materials Cloud62 were used for O and Ag. The total energy convergence criterion was increased from the standard 10−4 to 10−8 and a force threshold of 10−4 was used. A wavefunction cutoff (wfcut) of 50–60 Ry and charge density (rhocut) cutoffs of 560 Ry were used for all calculations. Electron masses were set initially at 300 a.u., and increased to 450 a.u. after initial damped minimizations, to accelerate convergence of the initial structure.All calculations were done using periodic boundary conditions (PBCs), and the Brillouin zone was sampled at the Γ point. The size and volume of the simulation cell were allowed to relax with the matrix structure throughout the zero-field dynamics and structure minimization.
A thermostat was not applied nor were temperatures controlled for the runs reported herein. No specific ensemble is implemented. Instead, CPMD-based damped dynamics63 is used to relax ion positions and electronic structure. Test runs using thermostats between 200 and 600 K found that temperature effects, especially those on geometry were negligible in these systems. We attribute this to the intrinsic rigidity of the lattice due to high ionic charges, as well as the high melting temperature of the ionic matrix.
3 Results and discussion
Two types of effects accompany the inclusion of silver clusters within a uniform MgO matrix, both contributing to the dielectric response of the material in applied electric fields. On one hand, the inclusion distorts local structure in the matrix (as shown in Fig. 1 for example). In the cases considered here, the somewhat compacted mNPs push outward against the ionic layers of the matrix. Other types of lattice mismatch will lead to inward buckling at the interface. Generally, this distortion only encompasses the nearest neighbors of the inclusions (up to around 3 Å from the edge of the mNP), since the doubly charged ions of the matrix create a rigid lattice. This rigidity, as well as the relatively low % volume loadings of 4–5% ensure that the mNP-induced distortion does not extend to neighboring simulation cells, in all cases. However, disruption of local structure in the strongly ionic matrix changes the electronic structure at the interface (defined here as the roughly 3 Å-thick layer of matrix atoms neighboring the inclusion), and its response to the applied field.The second class of effects has to do with the specifics of the charge density in the two mixture components, and at the interface. In broad terms, the mNP electrons mobilize along the applied external field, creating strong local fields at the NP–matrix interface, further impacting the ionic and electronic polarization of the matrix. For the small Ag8 inclusion considered in our previous work,49 the field of the polarized mNP resembled that of a point dipole located at the mNP center. In this analogy, using larger, anisotropic inclusions should further enhance the dielectric response of the NC by creating stronger induced dipoles through polarization of a larger charge density over longer distances. We discuss the electronic structure of the composites, and the various effects impacting the materials' response to applied fields, in the following paragraphs.
3.1 Electronic structure of the NC
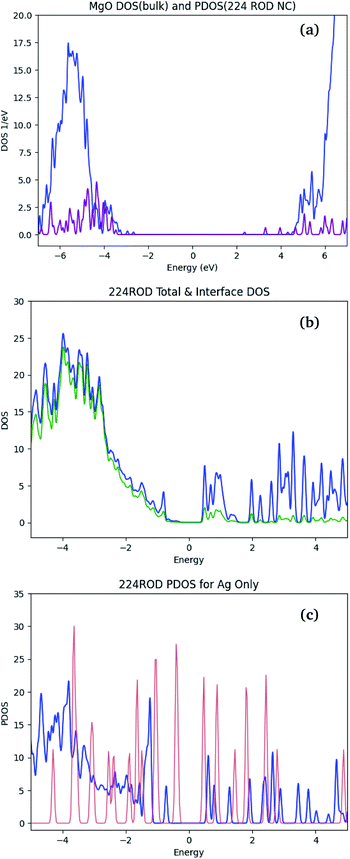
Calculated bandgaps of polarizable materials require careful consideration of the errors arising from the DFT formalism – particularly when using the LDA functional. The calculated bandgap is generally expected to be significantly lower than the corresponding experimental bandgap, due to DFT's known underestimation of virtual orbital energies.64,65 For bulk MgO, the electronic structure calculations described in Section 2.4 yield a bandgap of 5.5 eV [see Fig. 7(a)], compared to the experimental value of ≈7 eV.In large-bandgap materials (over 4–5 eV), metallic inclusions introduce additional states in the bandgap.66,67 These states are generally located in the vicinity of the Fermi level, and occupied by the many mNP electrons. In Ag/MgO NCs, the bandgap of the pure MgO [Fig. 7(a)] is populated. Comparison of the Fermi regions in the NC DOS (blue line in Fig. 7(b)) and the matrix- and mNP-projected DOSs in the composite (blue lines in Fig. 7(a) and (c), respectively) suggests that all the states within ∼2 eV of the Fermi level are mainly localized on the mNP. Interaction between the NP and the matrix is reflected in the splitting of NP states [Fig. 7(c)], particularly in the region of overlap with the matrix conduction band. Thus we expect that the response properties of the NC are dominated by mNP effects, and thus DFT performance for these properties will mirror more closely its performance for nanoparticles,68,69 than that of bulk materials.
3.2 Dielectric response of NCs with rod and disk-shaped inclusions
We have shown previously that the inclusion of “spherical” Ag8 mNPs at 4% loading increased the dielectric constant of the MgO matrix by 30%.49 Larger, anisotropic NPs with rod-like and disk-like geometries can further enhance the dielectric response, both by increasing the inclusion volume ratios, and through specific local field enhancements. Dielectric constants for the series of Ag/MgO NCs with rod-like and disk-like inclusions are presented in Table 1. The data indicate that asymmetric inclusions bring on dielectric enhancements that are, depending on orientation, larger than expected based on volume ratios alone. For example, multi-layer disks (Disks 332, 432 and 442) exhibit more than 70% enhancement in εr over the matrix permittivity, at loadings of around 4% (see Table 1).| Inclusion | Ninc | Natoms | % loadinga | ε‖b | ε⊥c |
|---|---|---|---|---|---|
| a Calculated as a ratio of the number of atoms in the mNP to the total number of atoms in the cell.b ‖ indicates that the field is applied parallel to the longest axis of the inclusion.c ⊥ indicates that the field is applied perpendicular to the longest axis of the inclusion. | |||||
| None (bulk MgO) | 0 | 9.8 | |||
| SPHERE 222 (ref. 49) | 8 | 216 | 3.7 | 11.9 | |
| ROD 223 | 12 | 288 | 4.2 | 12.9 | 12.2 |
| ROD 224 | 16 | 288 | 5.6 | 13.9 | 12.3 |
| ROD 225 | 20 | 360 | 5.6 | 14.9 | 12.8 |
| DISK 332 | 18 | 384 | 4.7 | 15.0 | 13.3 |
| DISK 432 | 24 | 800 | 3 | 15.9 | 14.8 |
| DISK 442 | 32 | 800 | 4 | 16.9 | 15.9 |
| DISK 241 | 8 | 192 | 4 | 11.3 | 10.7 |
| DISK 441 | 16 | 384 | 4.2 | 12.6 | 11.0 |
The series of rod-like inclusions considered here have similar cross-sections, with longer mNPs featuring additional atom planes along the inclusion's principal axis (see Fig. 2). NCs with rod-like inclusions exhibit stronger response when the applied field is parallel to the principal axis of the inclusion (ε‖) than when the field is applied perpendicular to the inclusion (ε⊥). This is because of the larger polarization distance available along the principal axis in the longer rods. That polarization distance within the inclusion is an important factor in the field response of these NCs is illustrated by the discrepancy between the size dependence of ε‖ and that of ε⊥ (Table 1): whereas ε‖ increases significantly with mNP length, ε⊥ is roughly constant in the series of rod-shaped inclusions.
However, dielectric enhancement in general is more complex than a simple correlation to the mNP length or the availability of polarizable electrons. This is evidenced by comparison of ε‖ (Table 1) for Rod225 and Disk332: the mNPs have similar atom numbers but have different shapes, and Rod225 has a longer dimension parallel to the field with two more atoms than Disk332. Despite this, NCs containing Disk332 inclusions have similar ε‖ values to those containing Rod225. Moreover, response to transverse applied fields (ε⊥) is generally stronger in multilayer disks and increases with mNP size, in contrast with the relatively constant transversal response of rods of varying sizes.
When the polarizing field is applied along the mNP's longest axes, NCs with disk-shaped inclusions show increased response for larger nanoparticles, with marked increases in ε‖ over their rod-like counterparts. The effect can be attributed to the larger number of electrons and polarization length in the larger mNPs. Moreover, NCs with disk-like inclusions show stronger dependence of dielectric response on the field direction and NP shape than those with rod-like inclusions. NCs with 3-dimensional mNPs (Disk332, Disk432 and Disk442) had stronger response than rod inclusions with similar axis ratios, a fact that can be traced back to the availability of larger numbers of polarizable electrons, with greater overall space to move in the disk-like mNP. On the other hand, dielectric response is weaker in NCs with 2-dimensional NPs (Disk421 and Disk441), regardless of applied field direction. This observation holds even when accounting for the fewer metal atoms in these mNPs, and is attributed to the small polarization distance in the direction of the smallest NP axis, and the overall lower number of electrons for these mNPs (see Table 1).
Broadly, disk-like inclusions do not conform as much as rods to the induced-point-dipole analogy, from both electronic and a structural perspectives. In these cases, consideration of polarization volumes instead of polarization lengths, and a more sophisticated classical model such as a polarizable metal disk or ellipsoid are necessary to help interpret many of the observed trends.53
3.3 Local polarization fields and Born effective charges
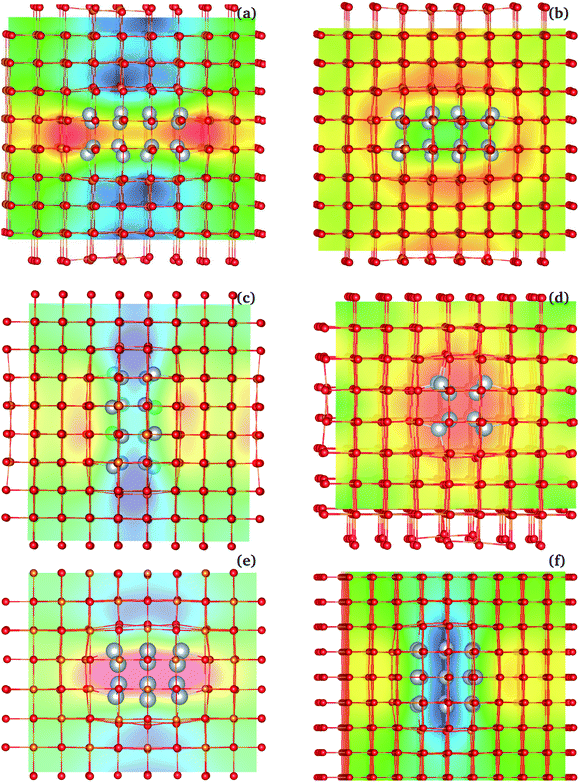
Beyond the mNP polarization, the dielectric response of the Ag/MgO NCs presented in Table 1 includes significant interfacial and matrix contributions. The different contributions (NP electrons, interface, matrix ions and electrons) are not directly separable, as polarization modes are coupled. One such coupling, between the electronic polarization in the NP and that of the matrix, is described by the matrix-ion BECs. The BECs reflect the influence of the NP polarization on the charge distribution within the matrix ions. To illustrate this effect in the three-dimensional lattice, we generated interpolated plots of BECs. These serve as effective maps of the local electrostatic field created by the NP's polarization in the matrix (see Fig. 8 for example).Fig. 8 shows the interpolated BEC maps for NCs with a 224 rod-like inclusion and a 332 disk-like inclusion. Enhancement of the matrix polarization field (blue regions in Fig. 8) is observed in regions adjacent to the NP poles, in the applied field direction. In the equatorial regions, a depolarization arises (red/yellow regions in BEC plots), where the effective ionic charge is weaker than in the absence of the external field. The enhancement is intense and mainly localized to two layers of matrix ions at the interface. The increased charge density in the mNP close to the interface, particularly strong along the polarization direction, leads to increased forces acting on the nearby ions, along the direction of polarization [see Fig. 8(a) and (c)]. This raises the overall dipole moment in the cell, beyond the NP polarization, and prior to ionic movement in the overall field. The opposite effect arises perpendicular to the polarization direction [Fig. 8(b) and (d)].
From a classical perspective, the polarization of the NP creates an electric field, similar to the field of a dipole, which modifies the local field in which matrix ions polarize. However, the classical picture neglects the quantum coupling of the mNP electrons and those of the matrix ions – particularly coupling to the electrons in the oxygen ions. The BECs capture this interaction, in the clamped ion regime. The movement of nuclei in Step 9 (Fig. 5) further modifies this polarization picture. Nevertheless, the BEC plots bring out the importance of the interface in the polarization of nanocomposite materials. Interfacial effects also impact the ionic movement under the field, as ions at the interface are not bound in the crystal lattice in the same fashion as bulk ions, and lattice mismatches between the inclusion and the matrix can further modulate this effect. In the systems considered here, the larger interfacial area present in NCs with disk-like inclusions enhances further the overall polarization of the material. The relative importance of these effects would have to be reconsidered for matrix materials with more diffuse charges, or with weaker ionic or even covalent bonding.
4 Conclusions
This work examines the effects of nanoparticle size and shape on optimizing dielectric response in metal/metal oxide nanocomposite materials, aiming to develop an understanding of how polarization in molecular-scale metallic inclusions affects in turn the polarization of the metal-oxide matrix. Introduction of molecular scale metal inclusions of silver in a magnesium oxide matrix is found to increase the dielectric capacity of the material, by up to 80% at below 5% volume loading, an enhancement depending on the shape, size and orientation of the inclusion relative to the external field. As the inclusions are small enough to behave as molecules, their polarization behaviour is quantized, requiring quantum approaches to model the material's response to an applied static field. Calculation of electron dynamics and Born effective charges provide a picture of the local fields generated around the polarized inclusions. The electronic and ionic polarization modes are coupled and cannot be individually described; however, the BEC picture suggests that induced fields at the matrix–inclusion interface enhance the matrix response to the applied field beyond the bulk level. The extent of the interface is particularly important, both as it relates to the accumulation of charges, and as it affects the mobility of nearby ions. The balance of polarization enhancement and destruction in the vicinity of the inclusion points towards a specificity of the outcome to individual matrix materials.The qualitative trends discussed above should be applicable to a broad range of composites, particularly those based on ionic matrices with a large band gap. Lower-bandgap matrix materials will exhibit further interaction with nanoparticle states, likely leading to a more pronounced effect of nanoparticle polarization on the dielectric response of the composite. Other oxide matrix materials exhibit more covalent bonding, altering the matrix polarization mode. In these systems, the interfacial effects should be distinct from those observed here. We are currently extending our calculations to other relevant matrix materials, including SiO2, Al2O3 and HfO2, as well as other inclusion options. These calculations are extremely lengthy, and rely on highly uniform mNP distributions. Such distributions are challenging to achieve experimentally, particularly from the point of view of nanoparticle alignment with the field. We are working on developing alternative, quantum/classical approaches for estimating polarization response in nanocomposite materials, to mitigate these problems and enable studies of polydisperse, non-uniform systems, including broader nanoparticle size and orientational distributions.
Conflicts of interest
There are no conflicts to declare.Acknowledgements
We acknowledge the support of the Natural Sciences and Engineering Research Council of Canada (NSERC). This research was enabled in part by support provided by WestGrid (http://www.westgrid.ca) and Compute Canada (http://www.computecanada.ca).Notes and references
- IRDS 2020: International Roadmap for Devices and Systems 2020 Edition: Beyond CMOS, https://irds.ieee.org/editions/2021/beyond-cmos, 2020, accessed 27 July 2021 Search PubMed.
- IRDS 2020: International Roadmap for Devices and Systems 2020 Edition: Executive Summary, https://irds.ieee.org/editions/2020/executive-summary, accessed 27 July 2021 Search PubMed.
- IRDS 2021: International Roadmap for Devices and Systems 2021 Edition: More than Moore White Paper, https://irds.ieee.org/editions/2020/more-than-moore, 2020, accessed 27 July 2021 Search PubMed.
- M. R. Lukatskaya, B. Dunn and Y. Gogotsi, Nat. Commun., 2016, 7, 1–13 CrossRef PubMed.
- D. Shamiryan, T. Abell, F. Iacopi and K. Maex, Mater. Today, 2004, 7, 34–39 CrossRef CAS.
- X. Yang, Z. Zhou, T. Nan, Y. Gao, G. M. Yang, M. Liu and N. X. Sun, J. Mater. Chem. C, 2016, 4, 234–243 RSC.
- J. Robertson, Eur. Phys. J.: Appl. Phys., 2004, 28, 265–291 CrossRef CAS.
- F. Balestra and G. Ghibaudo, Semicond. Sci. Technol., 2017, 32, 023002 CrossRef.
- S. B. Zhang, S.-H. Wei and A. Zunger, Phys. Rev. B: Condens. Matter Mater. Phys., 2001, 63, 075205 CrossRef.
- N. Umezawa, K. Shiraishi, T. Ohno, H. Watanabe, T. Chikyow, K. Torii, K. Yamabe, K. Yamada, H. Kitajima and T. Arikado, Appl. Phys. Lett., 2005, 86, 143507 CrossRef.
- H. Jiang, K. S. Moon, Y. Li and C. P. Wong, Chem. Mater., 2006, 18, 2969–2973 CrossRef CAS.
- L. Kong, S. Li, T. Zhang, J. Zhai, F. Boey and J. Ma, Prog. Mater. Sci., 2010, 55, 840–893 CrossRef CAS.
- G. Subramanyam, M. W. Cole, N. X. Sun, T. S. Kalkur, N. M. Sbrockey, G. S. Tompa, X. Guo, C. Chen, S. P. Alpay, G. A. Rossetti, K. Dayal, L.-Q. Chen and D. G. Schlom, J. Appl. Phys., 2013, 114, 191301 CrossRef.
- T. Pettong, P. Iamprasertkun, A. Krittayavathananon, P. Sukha, P. Sirisinudomkit, A. Seubsai, M. Chareonpanich, P. Kongkachuichay, J. Limtrakul and M. Sawangphruk, ACS Appl. Mater. Interfaces, 2016, 8, 34045–34053 CrossRef CAS PubMed.
- J. Robertson and R. M. Wallace, Mater. Sci. Eng., R, 2015, 88, 1–41 CrossRef.
- C. L. Jia, S. B. Mi, K. Urban, I. Vrejoiu, M. Alexe and D. Hesse, Phys. Rev. Lett., 2009, 102, 117601 CrossRef CAS PubMed.
- N. Shi and R. Ramprasad, Phys. Rev. B: Condens. Matter Mater. Phys., 2006, 74, 045318 CrossRef.
- W. P. Halperin, Rev. Mod. Phys., 1986, 58, 533–606 CrossRef CAS.
- J. Tang, H. Shi, G. Ma, L. Luo and Z. Tang, Frontiers in Bioengineering and Biotechnology, 2020, 8, 1019 CrossRef PubMed.
- J. Fang, B. Zhang, Q. Yao, Y. Yang, J. Xie and N. Yan, Coord. Chem. Rev., 2016, 322, 1–29 CrossRef CAS.
- K. Kwak and D. Lee, Acc. Chem. Res., 2018, 52, 12–22 CrossRef PubMed.
- R. Jin, G. Li, S. Sharma, Y. Li and X. Du, Chem. Rev., 2020, 121, 567–648 CrossRef PubMed.
- J. Yan, B. K. Teo and N. Zheng, Acc. Chem. Res., 2018, 51, 3084–3093 CrossRef CAS PubMed.
- H. Yu, B. Rao, W. Jiang, S. Yang and M. Zhu, Coord. Chem. Rev., 2019, 378, 595–617 CrossRef CAS.
- L. Zhang and E. Wang, Nano Today, 2014, 9, 132–157 CrossRef CAS.
- S. Guo and E. Wang, Nano Today, 2011, 6, 240–264 CrossRef CAS.
- Y. Tao, M. Li, J. Ren and X. Qu, Chem. Soc. Rev., 2015, 44, 8636–8663 RSC.
- X. Kang and M. Zhu, Chem. Soc. Rev., 2019, 48, 2422–2457 RSC.
- T. Goswami, N. Kamboj, A. Bheemaraju, A. Kataria and R. S. Dey, Mater. Adv., 2021, 2, 1358–1368 RSC.
- H. Chong, P. Li, J. Xiang, F. Fu, D. Zhang, X. Ran and M. Zhu, Nanoscale, 2013, 5, 7622 RSC.
- T. Goswami, K. M. Reddy and A. Bheemaraju, ChemistrySelect, 2019, 4, 6790–6799 CrossRef CAS.
- J. Yang and R. Jin, J. Phys. Chem. C, 2020, 125, 2619–2625 CrossRef.
- I. Chakraborty and T. Pradeep, Chem. Rev., 2017, 117, 8208–8271 CrossRef CAS PubMed.
- C. Chen, L. Pan, S. Jiang, S. Yin, X. Li, J. Zhang, Y. Feng and J. Yang, J. Eur. Ceram. Soc., 2018, 38, 1639–1646 CrossRef CAS.
- C. Zhang, Y. Chen, X. Li, H. Ren, G. Wang and X. Dong, Journal of Materiomics, 2021, 7, 478–487 CrossRef.
- D. C. Harris, L. R. Cambrea, L. F. Johnson, R. T. Seaver, M. Baronowski, R. Gentilman, C. S. Nordahl, T. Gattuso, S. Silberstein, P. Rogan, T. Hartnett, B. Zelinski, W. Sunne, E. Fest, W. H. Poisl, C. B. Willingham, G. Turri, C. Warren, M. Bass, D. E. Zelmon and S. M. Goodrich, J. Am. Ceram. Soc., 2013, 96, 3828–3835 CrossRef CAS.
- C. Zhang, Y. Chen, M. Zhou, X. Li, L. Wang, L. Xia, Y. Shen and X. Dong, J. Mater. Chem. C, 2019, 7, 8120–8130 RSC.
- L. Yan, C. M. Lopez, R. P. Shrestha, E. A. Irene, A. A. Suvorova and M. Saunders, Appl. Phys. Lett., 2006, 88, 142901 CrossRef.
- A. Posadas, F. J. Walker, C. H. Ahn, T. L. Goodrich, Z. Cai and K. S. Ziemer, Appl. Phys. Lett., 2008, 92, 233511 CrossRef.
- S. S. P. Parkin, C. Kaiser, A. Panchula, P. M. Rice, B. Hughes, M. Samant and S.-H. Yang, Nat. Mater., 2004, 3, 862–867 CrossRef CAS PubMed.
- X. Liu, D. Mazumdar, W. Shen, B. D. Schrag and G. Xiao, Appl. Phys. Lett., 2006, 89, 023504 CrossRef.
- A. Hirohata, K. Yamada, Y. Nakatani, I.-L. Prejbeanu, B. Diény, P. Pirro and B. Hillebrands, J. Magn. Magn. Mater., 2020, 509, 166711 CrossRef CAS.
- X. Chen and Y. Wu, Scr. Mater., 2019, 162, 14–17 CrossRef CAS.
- J. Y. Li, L. Zhang and S. Ducharme, Appl. Phys. Lett., 2007, 90, 132901 CrossRef.
- V. Kochergin, V. Zaporojtchenko, H. Takele, F. Faupel and H. Föll, J. Appl. Phys., 2007, 101, 024302 CrossRef.
- G. Grzela, D. Hourlier and J. Gómez Rivas, Phys. Rev. B: Condens. Matter Mater. Phys., 2012, 86, 045305 CrossRef.
- F. Aryasetiawan, O. Gunnarsson, M. Knupfer and J. Fink, Phys. Rev. B: Condens. Matter Mater. Phys., 1994, 50, 7311–7321 CrossRef CAS PubMed.
- L. Lajaunie, F. Boucher, R. Dessapt and P. Moreau, Phys. Rev. B: Condens. Matter Mater. Phys., 2013, 88, 115141 CrossRef.
- D. J. Hally and I. Paci, Nanoscale, 2018, 10, 9583–9593 RSC.
- N. Marzari and D. Vanderbilt, Phys. Rev. B: Condens. Matter Mater. Phys., 1997, 56, 12847–12865 CrossRef CAS.
- N. A. Spaldin, J. Solid State Chem., 2012, 195, 2–10 CrossRef CAS.
- M. D. Hanwell, D. E. Curtis, D. C. Lonie, T. Vandermeersch, E. Zurek and G. R. Hutchison, J. Cheminf., 2012, 4, 17 CAS.
- B. Henderson, A. Adluri and I. Paci, 2021, ChemRxiv:10.33774/chemrxiv-2021-s0vqp.
- R. Car and M. Parrinello, Phys. Rev. Lett., 1985, 55, 2471–2474 CrossRef CAS PubMed.
- P. Giannozzi, S. Baroni, N. Bonini, M. Calandra, R. Car, C. Cavazzoni, D. Ceresoli, G. L. Chiarotti, M. Cococcioni, I. Dabo, A. D. Corso, S. de Gironcoli, S. Fabris, G. Fratesi, R. Gebauer, U. Gerstmann, C. Gougoussis, A. Kokalj, M. Lazzeri, L. Martin-Samos, N. Marzari, F. Mauri, R. Mazzarello, S. Paolini, A. Pasquarello, L. Paulatto, C. Sbraccia, S. Scandolo, G. Sclauzero, A. P. Seitsonen, A. Smogunov, P. Umari and R. M. Wentzcovitch, J. Phys.: Condens. Matter, 2009, 21, 395502 CrossRef PubMed.
- N. Drakos and R. Moore, CP User's Guide Search PubMed.
- P. Umari and A. Pasquarello, Phys. Rev. Lett., 2002, 89, 157602 CrossRef CAS PubMed.
- N. Wiser, Phys. Rev., 1963, 129, 62–69 CrossRef.
- Y. Li, B. Xiao, L. Sun, Y. Gao and Y. Cheng, J. Alloys Compd., 2017, 692, 713–719 CrossRef CAS.
- M. van Setten, M. Giantomassi, E. Bousquet, M. Verstraete, D. Hamann, X. Gonze and G.-M. Rignanese, Comput. Phys. Commun., 2018, 226, 39–54 CrossRef CAS.
- A. D. Corso, Comput. Mater. Sci., 2014, 95, 337–350 CrossRef.
- K. Lejaeghere, G. Bihlmayer, T. Bjorkman, P. Blaha, S. Blugel, V. Blum, D. Caliste, I. E. Castelli, S. J. Clark, A. D. Corso, S. de Gironcoli, T. Deutsch, J. K. Dewhurst, I. D. Marco, C. Draxl, M. D. ak, O. Eriksson, J. A. Flores-Livas, K. F. Garrity, L. Genovese, P. Giannozzi, M. Giantomassi, S. Goedecker, X. Gonze, O. Granas, E. K. U. Gross, A. Gulans, F. Gygi, D. R. Hamann, P. J. Hasnip, N. A. W. Holzwarth, D. Iusan, D. B. Jochym, F. Jollet, D. Jones, G. Kresse, K. Koepernik, E. Kucukbenli, Y. O. Kvashnin, I. L. M. Locht, S. Lubeck, M. Marsman, N. Marzari, U. Nitzsche, L. Nordstrom, T. Ozaki, L. Paulatto, C. J. Pickard, W. Poelmans, M. I. J. Probert, K. Refson, M. Richter, G.-M. Rignanese, S. Saha, M. Scheffler, M. Schlipf, K. Schwarz, S. Sharma, F. Tavazza, P. Thunstrom, A. Tkatchenko, M. Torrent, D. Vanderbilt, M. J. van Setten, V. V. Speybroeck, J. M. Wills, J. R. Yates, G.-X. Zhang and S. Cottenier, Science, 2016, 351, aad3000 CrossRef PubMed.
- A. Kohlmeyer, CPMD Tutorial Search PubMed.
- J. P. Perdew, Int. J. Quantum Chem., 1985, 28, 497–523 CrossRef.
- J. P. Perdew, W. Yang, K. Burke, Z. Yang, E. K. U. Gross, M. Scheffler, G. E. Scuseria, T. M. Henderson, I. Y. Zhang, A. Ruzsinszky, H. Peng, J. Sun, E. Trushin and A. Görling, Proc. Natl. Acad. Sci. U. S. A., 2017, 114, 2801–2806 CrossRef CAS PubMed.
- C. K. Rowan and I. Paci, J. Phys. Chem. C, 2011, 115, 8316–8324 CrossRef CAS.
- C. K. Rowan and I. Paci, Theor. Chem. Acc., 2012, 131, 1–11 Search PubMed.
- M. Li and J. Li, Mater. Lett., 2006, 60, 2526–2529 CrossRef CAS.
- A. Walsh, J. L. F. D. Silva and S.-H. Wei, Phys. Rev. B: Condens. Matter Mater. Phys., 2008, 78, 075211 CrossRef.
Footnote |
| † Electronic supplementary information (ESI) available: A GitHub repository including minimized nanocomposite structures, scripts and input files for a successful dielectric constant calculation is publicly available at https://github.com/Paci-Group/Dielectric-Nanocomposite-QE. See DOI: 10.1039/d1ra07472e |
| This journal is © The Royal Society of Chemistry 2022 |

