 Open Access Article
Enrichment of gas storage in clathrate hydrates by optimizing the molar liquid water–gas ratio
Sai Kiran Burla ab and
S. R. Prasad Pinnelli
 *ab
*ab
aGas Hydrate Division, CSIR-National Geophysical Research Institute (CSIR-NGRI), Hyderabad-500 007, India. E-mail: psrprasad@ngri.res.in; Fax: +91 40 2717 1564; Tel: +91 40 2701 2710
bAcademy of Scientific and Innovative Research (AcSIR), Ghaziabad-201002, India
First published on 13th January 2022
Abstract
Natural gas (NG) is considered a modern source of energy. Gas hydrates are anticipated to be an alternative method for gas storage and transportation applications. The process must be handy, rapid, and proficient for scale-up. In the present study, methane (CH4) and carbon dioxide (CO2) hydrates are synthesized by varying the guest (gas) to host (water) volume. The experiments are performed in a non-stirred system. The results specify that the maximum storage capacity is achieved when the molar liquid water–gas ratio is about 4.08 and 8.25 for CH4 and CO2 hydrates. At the optimal water–gas ratios, the total CH4 and CO2 gas uptake capacity is about 14.3 ± 0.4 and 9.1 ± 0.4 liters at standard temperature and pressure (STP) conditions. The gas uptake gradually increases with the solution volume and abruptly falls after a threshold point. The hydrate grows across the reactor's metal surface; when the process fully covers the surface, the growth continues horizontally (increase in thickness). With varying the liquid water–gas ratio (low to high), the formation kinetics (t90) is delayed. The hydrate growth rate gradually decreases and does not significantly influence the hydrate formation temperatures. Optimizing the molar liquid water–gas ratio yields a high gas storage capacity and faster process kinetics.
1. Introduction
1.1. Gas hydrates
Clathrate hydrates, also called gas hydrates, are ice-like crystalline compounds. The gas molecules are trapped in the water molecules' cavities developed by hydrogen bonding under suitable temperature and pressure conditions.1 A weak van der Waals interaction confines the motion of the gas molecules within the hydrate structure. Based on the size, shape, and nature of the gas molecules, the hydrate structures are classified into three types, namely structure I (sI), structure II (sII), and structure H (sH). In nature, these hydrates form naturally in the permafrost and ocean depths.2–7 The natural hydrates mainly comprise methane gas.8 Natural hydrates are ascertained to be a future energy source if used with feasible technology and will have economic value.9 The synthetic hydrates provide multifaceted applications such as storage media for greenhouse gases,10–16 carbon dioxide capture from fuel gas,17 methane recovery from coal mine gas,18,19 desalination,20–22 cold storage,23–27 and gas transportation.12,28 Because of their structural properties and selectivity, this process slowly escalates to address various food technology issues.29 On one side, they serve as a technological solution for modern-day problems; conversely, these hydrates are considered a bottleneck in the oil and gas industry.30 The hydrate plug formation in pipelines during production and transportation is hazardous. Several researchers have addressed possible solutions to minimize these issues.31–391.2. Conventional methods for gas storage & transportation
With the increasing population, the demand for energy consumption is high. Natural gas (NG) is the cleanest burning fossil fuel, contributing 24.2% of the world's total primary energy consumption.40 Being the pristine and less CO2 emitter, the natural gas demand is expected to be increasing in the coming years. The conventional gas storage and transportation methods are through compression (CNG) and liquefaction (LNG).41,42 Although the commercial development is via CNG and LNG, their complications are risky and unsafe. In CNG, the gas is stored by compressing it to less than 1% volume at standard temperature & pressure (STP) conditions. As a result, the gas is stored in high-pressure conditions. This leads to the high-pressure cylinder requirement (20–25 MPa). The CNG process requires huge compressors to compress the gas to 20–25 MPa, and the energy needed by these engines is high, which consumes high electricity. The process takes a long time and is noisy, sometimes requires multistage, and the overall budget to maintain and operate these plants is expensive. Also, the transport containers are designed heavy-walled (adds weight to the transport vehicle). The effect of tank weight on the mileage and payload is a hindering factor. Fluctuations/increases in the ambient temperatures could influence or limit the storage capacity in CNG tanks. The transportation of the gas to long distances and changes in the ambient temperature with locations could trigger the expansion of gas and is unsafe.42 In LNG, the gas is condensed into a liquid by compressing it to 1/600 times volume at STP. The gas exists in liquid form at atmospheric pressure and low-temperature conditions (−162 °C). For the transportation of LNG, special cryogenic containers are required, which in turn requires high investment.41 In comparison with CNG and LNG, LNG is most preferred for the long-distance transport of natural gas because of its high volumetric capacity. Studies show the economic feasibility of gas hydrates, i.e., the hydrating process's overall cost is much lower than that of the LNG process.43 Another primary concern associated with the LNG procedure is the emission of industrial pollutants such as CO2 and SO2 during the production process. The LNG process consists of four operational stages wherein stage (i) upstream gas production (feed gas), (ii) pre-treatment, (iii) liquefaction, and (iv) shipping and regasification. The natural gas supplied from the source point is refined, and impurities such as CO2, CO, SO2, and H2S are vented out in the pre-treatment process through various separation methods. These pollutant gases discharged during the liquefaction process must be properly treated, reprocessed, and reused, to reduce environmental pollution.44,45 Different methodologies are adopted to facilitate the process cost, and search for an alternative medium is in demand.46 Also, studies report that 70% of the gas reserves are far or small to connect with the existing pipeline connections or liquefaction facility.471.3. Hydrate technology for gas storage & transportation
Hydrate-based technology is preferred and could potentially bypass the above-mentioned technical issues and effectively explore the gas resource.48,49 Gas hydrates can compress a large gas volume in a small space and act as a potential gas storage medium. Ideally, the unit volume of gas hydrate would give 160–180 times of gas upon dissociation.1,30 Also, the moderate formation conditions and minimum energy requirement for complete recovery of the stored gas are advantageous.50 The storage and transportation of gas via hydrate technology are in demand because of their high safety. Comparatively 18–24% lower cost than LNG transportation.43,51 Though hydrate-based technology offers economical and feasible solutions over CNG and LNG, few bottlenecks are associated with this process. The inefficient water-to-hydrate conversion and the sluggish kinetics are primary concerns to scale up this process.1 Several researchers over the past decades established and proposed various methods to overcome these bottlenecks. Mechanical techniques such as stirring the sample solution, spraying the liquid, and continuously injecting gas into the liquid phase enhance the gas water interaction.52 Thermodynamic promoters such as tetrahydrofuran, cyclopentane, tetra-n-butyl ammonium bromide, and epoxycyclopentane increase the hydrate stability conditions to higher temperatures.11,53–60 The use of packed beds, porous materials, nanoparticles, dry water, foams, and hydrogels proved to accelerate the growth kinetics and higher gas uptake by increasing the surface area.10,61–66 Surfactants such as sodium dodecyl sulfate, sodium benzenesulfonate, alkyl benzene sulfonates, etc., are studied rigorously. Studies report that the micelle formation and the decreased surface tension offer higher gas water interaction and enhance mass transfer.67–71 All these methods and materials are good at laboratory scale, but industrial-scale may hamper the cost and technical constraints. Recently additives such as amino acids and bio powders are proved to be kinetic hydrate promoters for CH4 and CO2 hydrates.12,13,72–75 The hydrates are formed easily at moderate temperature and pressure conditions. No additional stirring or mixing is required. Also, 90% of the hydrate conversion is in less than an hour. Thus, using these water-soluble additives could better serve faster kinetics, higher hydrate yield, and ease to pelletize for storage and transportation application.The present study explains the formation of methane and carbon dioxide hydrates in the presence of low dose (0.5 wt%) L-methionine amino acid (L-met). L-Methionine is a kinetic hydrate promoter for both CH4 and CO2 hydrates.12,72,75 Emphasis is to achieve rapid kinetics, higher uptake capacity, and exhibit a simple experimental setup to reduce the overall process cost. An attempt is made to understand the role of reactant concentrations in maximizing the process yield. The experiments are performed by varying the solution bed height and free gas. The process operation is simple since the amino acid is easily soluble in water, and the formation conditions are moderate. The reactor design does not require additional stirring, which could be a worthy setup if escalated to real-time use.
2. Experimental section
2.1. Materials
99.95% purity methane and carbon dioxide gases are used to perform experiments procured from M/S Bhuruka Gas Company. Deionized water type 1 is used to make the sample solution. The amino acid powder is purchased from M/S Sigma Aldrich and is used as received.2.2. Apparatus
The apparatus includes a high-pressure reactor vessel (500 ml volume) made of SS-316 and can hold up the pressure to 10 MPa. The temperature is controlled by a closed-loop chiller (ANCRYO-LTCCB-40) with a circulating liquid tank attached to it. Glycol and water mixture in the selected ratio is used as a coolant. The temperature and pressure measurements are recorded using platinum resistance thermometers (Pt100) and a pressure transducer (WIKA, type A-10 for pressure range 0–25 MPa with ±0.5% accuracy).2.3. Procedure
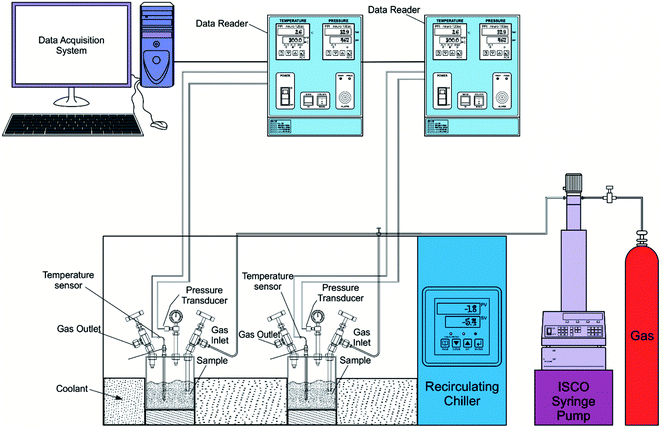
The experiments are performed in a batch reactor following the isochoric method procedure. The aqueous sample solution of the chosen volume is poured into the reactor vessel. The sample gas with desired pressure is filled into the reactor vessel through the inlet valve using the Teledyne ISCO syringe pump. Before introducing the gas, the reactor cell is purged with sample gas 3–4 times. The pump is disconnected after introducing the gas. The reactor vessels are immersed into the coolant tank. The chiller is set to the desired experimental value to increase or decrease the reactor vessel's temperature. The hydrate formation is inferred from the temperature spike because of the exothermic heat release during the hydrate crystal growth. The gas consumed in the hydrate conversion process is calculated from the observed pressure drop. Subcooling is the difference between the phase equilibrium temperature at the operating pressure and the experimental formation temperature. Each experiment is repeated at least three times, and the data is represented with an average value and standard deviation. The schematic experimental design is shown in Fig. 1. The temperature and pressure data points are recorded every 30 seconds. In all the cycles, the experimental parameters were kept constant.2.4. Equations used for data calculations
The following equation defines the molar gas concentration of CH4 and CO2 gas in the hydrate phase during an experiment at any given time t.
 | (1) |
The volume changes during phase transformation are neglected, and volume is constant throughout the experiment.
The gas consumption rate was computed using forward differentiation by the following equation.
| Gas uptake rate = (ni+Δt − ni)/Δt | (2) |
The amount or percentage of water converted into hydrate is calculated using the following equation.
 | (3) |
The following equation calculates the hydration number
| For structure I: 46/(2(θs) + 6(θl)) | (4) |
The following equation defines the molar liquid water–gas ratio.
| Φ = Vw/Vg | (5) |
The conversion of consumed gas (mole) into liters is by the following equation
 | (6) |
3. Results and discussion
3.1. CH4 and CO2 hydrate formation conditions
Methane, a principal constituent, and carbon dioxide, a secondary component of natural gas, are of primary concern for climate change. Gas hydrates are considered the best materials for gas storage and transportation applications with high storage capacity. The CH4 and CO2 hydrates are synthesized by varying the molar liquid–gas volume in the isochoric method. 0.5 wt% of the L-methionine (L-met) is added to water to accelerate the reaction process. In the presence of amino acids, the hydrate growth is rapid.12 The reusability of the sample is easy and yields the exact conversion. It is non-foaming and is feasible for pelletizing. The complexity with experimental design increases when scaling to higher capacities. Since stirring/mixing or spraying the liquid becomes difficult and adds additional cost, we performed the experiments in a non-stirred condition. The formation and dissociation of the CH4 and CO2 hydrates are at moderate pressure-temperature conditions. The experiments are performed with 30, 60, 90, 200, and 330 ml of varying sample volumes. Fig. 2 shows the CH4 and CO2 hydrates' pressure-temperature trajectory synthesized with 90 ml of the sample solution.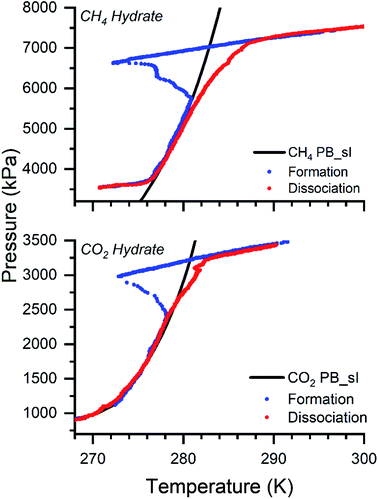 | ||
| Fig. 2 The graph shows the formation and dissociation of the CH4 and CO2 hydrates with a 90 ml volume solution. The black line represents the theoretical phase boundary curve for CH4 and CO2 hydrates, computed from CSM GEM application.1 The blue and red dots show the formation and dissociation cycles for both gases. | ||
The black line represents the theoretical phase equilibrium boundary for CH4 and CO2 hydrates generated using the CSM GEM application.1 The blue and red dots show the hydrate formation and dissociation pattern. The initial experimental conditions are 7500 and 3500 kPa at ambient temperature 298 K for CH4 and CO2 systems. The operating conditions are chosen since a higher driving force offers a faster reaction rate and enhances the yield.11,72,74 The gas is introduced at 298 K. As the reactor temperature decreases, the gas linearly decreases. Once the phase equilibrium boundary is crossed, a steep reduction in the pressure is observed. A sharp increase in the temperature with an abrupt decrease in pressure is observed at one point. This point is termed the nucleation point, which indicates the hydrate nucleation (exothermic reaction). With time, the pressure reduction reaches saturation, and a linear behavior is observed with a further decrease in temperature. This point defines the saturation of the hydrate growth and confirms the end of the reaction. Further heating up the system, the hydrate dissociates, and the captured gas in the hydrate cages is released. The hydrate dissociation (red dots) is governed and followed along the phase equilibrium curve. To observe the dissociation pattern, the warming is performed at 0.5–1 K/H (ideally, it could be performed at a faster heating rate to degasify). At higher pressures, the deviation on the dissociation is due to the faster heating rate. The experiments are repeated three times at each sample volume, and the average value is taken for presentation. The formation temperature and pressure conditions are not varied with the sample volumes. They are in the range 270–272 K and 6600–6800 kPa for CH4 hydrates and 272–273 K and 2600–2900 kPa for CO2 hydrates. At 90 ml sample volume, the formation temperature and pressure points for CH4 hydrate are around 271.6 ± 0.8 K and 6610 ± 28.3 kPa, and for the CO2 system is around 273 ± 0.9 K and 2800 ± 20 kPa. In all the experiments, it is ensured the driving force is constant. Driving force is defined as the difference between the experimental and the equilibrium pressure (calculated from CSM GEM).1.
3.2. Optimizing the molar liquid water–gas ratio
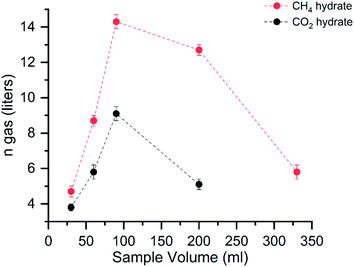
Fig. 3 shows the gas uptake into the hydrates with varying volumes.The graph shows the amount of gas consumed (in liters at STP conditions) in the hydrates with varying solution capacities. The red and black dots represent the CH4 and CO2 hydrate storage capacities. The maximum gas consumed by the hydrates is around 90 ml in both systems. An abrupt decrease in the gas uptake is seen around 200 ml for the CO2 system; hereafter, we did not perform experiments with the further increasing solution concentration. The gas intake into the hydrates is linearly increased until the solution volume is 90 ml. Another addition to the solution, the gas intake capacity abruptly decreased. This reduction signifies the importance of the reactant's volume in the hydrate conversion. It is defined as a molar liquid water–gas ratio, a dimensionless quantity represented by eqn (5).
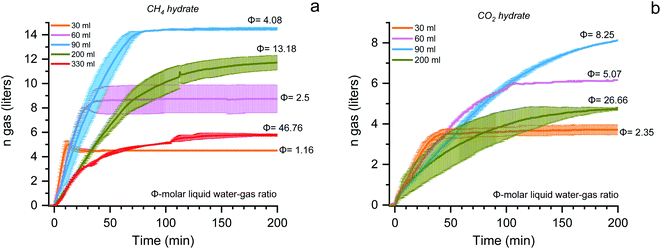
The gas uptake capacity is in increasing trend up to 90 ml solution. At a lesser sample volume, the availability of free gas molecules is high. The overall hydrate yield in 30, 60, and 90 ml is about ∼80% for methane hydrates and ∼60% for carbon dioxide hydrates (see Table 1). This means the maximum water is utilized in the hydrate conversion process. At 30 and 60 ml, the absolute gas molecules captured into the hydrates are less than 90 ml solution showing the available space for gas encasing is fewer due to the lesser availability of the water molecules. Further increase in the solution quantity, the free space for the available gas molecules is less, and the hydrate growth is limited. The gas uptake kinetics for the CH4 and CO2 systems with different water–gas ratios are shown in Fig. 4.
| S. no. | Sample volume (ml) | Tformation (K) | Pformation (kPa) | Hydrate yield (%) | Gas consumed (liters at STP) | Subcooling (K) | t90 kinetics (min) | Gas uptake rate (mmol min−1) | Molar liquid water–gas ratio (Φ) |
|---|---|---|---|---|---|---|---|---|---|
| CH4 hydrate | |||||||||
| 1 | 30 | 270.9 ± 0.9 | 6635 ± 148.5 | 78.1 ± 3.6 | 4.7 ± 0.2 | 11.8 ± 0.6 | 9.5 ± 1.4 | 23.4 ± 0.9 | 1.16 |
| 2 | 60 | 270.7 ± 0.8 | 6630 ± 56.6 | 72.9 ± 3.1 | 8.7 ± 0.5 | 12.3 ± 0.7 | 26.5 ± 7.8 | 18.6 ± 1.1 | 2.5 |
| 3 | 90 | 271.6 ± 0.8 | 6610 ± 28.3 | 81 ± 2.8 | 14.3 ± 0.4 | 11.2 ± 0.9 | 61.5 ± 6.3 | 13.1 ± 0.6 | 4.08 |
| 4 | 200 | 270.3 ± 2.5 | 6520 ± 56.6 | 32.2 ± 1.5 | 12.7 ± 0.3 | 12.5 ± 2.6 | 132 ± 8.4 | 6.8 ± 0.3 | 13.18 |
| 5 | 330 | 270.4 ± 0.9 | 6730 ± 14.1 | 8.9 ± 1.8 | 5.8 ± 0.3 | 13 ± 0.8 | 109 ± 4.9 | 7.4 ± 0.3 | 46.76 |
![[thin space (1/6-em)]](https://www.rsc.org/images/entities/char_2009.gif) |
|||||||||
| CO2 hydrate | |||||||||
| 1 | 30 | 273.2 ± 2.5 | 2973.3 ± 110.1 | 71.1 ± 1.4 | 3.8 ± 0.2 | 7.5 ± 2.3 | 34.3 ± 7.7 | 5 ± 0.2 | 2.35 |
| 2 | 60 | 272.1 ± 1.1 | 2760 ± 42.4 | 52.8 ± 3 | 5.8 ± 0.4 | 8.3 ± 1.1 | 89 ± 8 | 4.8 ± 0.3 | 5.07 |
| 3 | 90 | 273 ± 0.9 | 2800 ± 20 | 56.1 ± 3.1 | 9.1 ± 0.4 | 7.2 ± 1 | 144.8 ± 51.3 | 3.1 ± 0.1 | 8.25 |
| 4 | 200 | 273.3 ± 2.3 | 2600 ± 127.3 | 14 ± 1.2 | 5.1 ± 0.3 | 6.8 ± 2.5 | 153 ± 63.6 | 2.6 ± 0.2 | 26.66 |
Fig. 4 shows the plot, reaction time vs. gas uptake capacity for the methane (a) and carbon dioxide (b) hydrates with varying molar liquid water–gas ratios. The absolute gas uptake is significantly less with increasing the solution's quantity. When the molar liquid water–gas ratio is 1.16 and 2.35, the storage capacity and the reaction time (t90 – the time required for completing 90% of the reaction process) is about 4.7 ± 0.2, 3.8 ± 0.2 liters, and 9.5 ± 1.4, 34.3 ± 7.7 minutes for CH4 and CO2 systems. When the ratio increases to 2.5 and 5.07, the storage capacity is double, and the reaction time increases 2 and 3 times for CH4 and CO2 systems. The maximum storage capacity is obtained when the water–gas ratio is 4.08 and 8.25 for CH4 and CO2 hydrates. The total CH4 and CO2 gas uptake are about 14.3 ± 0.4 and 9.1 ± 0.4 liters (at STP conditions), further increasing the ratio to 13.18 (CH4) and 26.66 (CO2), the gas storage capacity abruptly decreases. The average data points of formation temperature, pressure, and the amount of hydrate conversion at each bed height for both CH4 and CO2 system and the subcooling required, formation kinetics, the gas uptake rate, and the molar liquid water–gas ratio of the reactor are tabulated in Table 1. Close observation shows the t90 kinetics for the two gas systems vary with increasing the solution concentration—the lesser the solution volume, the faster the hydrate growth kinetics. The t90 for 30, 60, 90, 200, and 330 ml solution quantity is 9.5, 26.5, 61.5, 132, and 109 minutes for CH4 and is about 34.3, 89, 144.8, and 153 minutes for the CO2 system. With an increase in the solution quantity, the time required for 90% of the hydrate formation increased 10 and 4 times higher for CH4 and CO2 systems. From Fig. 4, it is apparent that the molar liquid water–gas ratio has a strong influence on the hydrate formation process. The reaction time is faster at a lower ratio and has considerable uptake capacity. The uptake capacity is high at a higher ratio (optimal condition) but longer reaction time. The appropriate or optimal water–gas ratio used in this work is 4.08 and 8.25 for CH4 and CO2 systems.76 The hydrate conversion is maximum when the reactant volume is 20–25% of the total reactor volume.
Similarly, Rossi et al. developed a high-pressure spray reactor with a 25 liter capacity to enhance methane uptake.77 The liquid is sprayed into the reactor filled with gas. The maximum gas uptake is achieved when the sample volume is about 5 liters, corresponding to 20% of the total reactor volume. The study also reported that the hydrate growth is mainly on the metal surfaces of the reactor. Pang et al. studied the scale-up effect for gas storage in the form of hydrate in a quiescent reactor (10 liters capacity).78 Methane hydrate was synthesized using sodium dodecyl sulfate as an additive. They assessed the various parameters in scaling the hydrating process, such as water quantity's impact on the storage capacity, formation rate, the effect of the double-deck cells, deck height and plate span, and liquid water's role. The study reported that the gas uptake capacity and the hydrate formation rate decreased with the increased sample solution quantity. The morphological observation revealed that the hydrate growth is dominantly on the metal surfaces of the reactor. A multi-deck cell type vessel is used as an internal part of the reactor to enhance the growth rate, where the hydrates form inside the cells. The volume of each cell and the quantity of water loaded do not alter the specific formation rate. The liquid's role is assed to show the tap water could be used instead of the expensive distilled water. Our observations strongly agree with the earlier experimental results. The gas uptake capacity decreased by 60 and 40% when the sample volume was increased to 330 and 200 ml for CH4 and CO2 hydrates. When the quantity of water is less (30 and 60 ml), the gas uptake capacity is high. The decrease in the storage capacity speeded up when the water quantity exceeded 90 ml for both systems.
3.3. Hydrate growth morphology
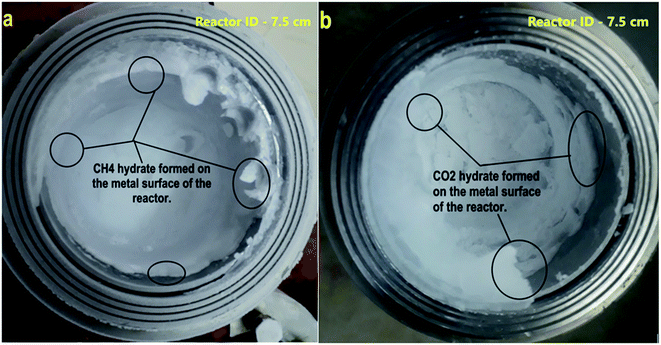
It is observed the hydrate formation is mainly on the surface of the reactor. This creep behavior ensures enhanced interaction between water molecules via capillary action and gas molecules, thus promoting rapid and efficient hydrate conversion.12,78 Fig. 5 shows the hydrate formation via creep behavior on the metal surface of the reactor.The hydrate saturation is ensured, the reactor temperature is lowered to 150 K, and simultaneously depressurized. The head part is removed from the reactor, and the photograph is captured. At the gas–water interface, the hydrate particle triggered moves upward rapidly to adsorbed on the metal surface. The water level is decreased as the hydrate grows across the reactor walls. This is because of the water creep phenomenon via capillary pores. This leads to a remarkable increase in the gas–water interface and results in rapid and higher gas uptake. The hydrate grows upwards, above the liquid level along the reactor's metal surface; when all the metal surface is covered with hydrate creep, the hydrate increases in thickness (see circled portions in Fig. 5). During this process, the water adsorbed by the hydrate particles became interstitial, which does not directly contact the gas. The gas water interaction is possible only through the diffusion process, a controlling factor for hydrate growth. Since the hydrate's conductivity is low, the heat transfer would become another control step where the hydrate growth would decrease dramatically with increasing thickness.78 This is evident from Fig. 5, where the hydrate thickness is large once it reaches the top of the reactor wall and is small when the hydrate growth is at the bottom (see circled portions in Fig. 5). The hydrate could easily creep along the reactor wall when the sample quantity is less. The gas water interaction is enhanced, heat transfer is easy, and the hydrate growth kinetic is faster. With increased sample quantity, the reactor's bed height increases, reducing the metal surface area for hydrate to creep. It starts to grow in thickness, hindering the gas water interaction. Heat transfer delays the further hydrate growth. The rate calculation for CH4 and CO2 systems is shown in Fig. 6.
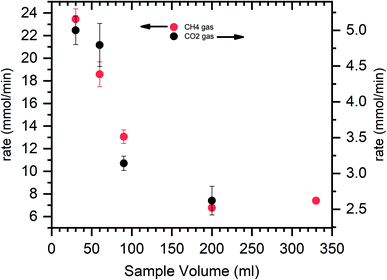
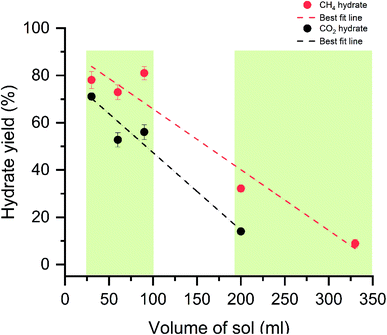
Initially, at 30 ml of the solution, the gas uptake rate is high, about 23.4 and 5 mmol min−1 for CH4 and CO2 systems. As the sample solution increases, the gas uptake rate tends to decrease. As said earlier, when the surface area is high and hydrate rapidly grows across the walls, which yields a higher gas uptake rate. The walls' surface areas are reduced with increased solution volume, and the hydrate grows in thickness. The diffusion process controls the interaction of gas water, and the heat transfer is limited, resulting in sluggish hydrate growth and a slower gas uptake rate. Similar studies on the surface area to volume optimization for sII hydrates with varying volumes of tetrahydrofuran + CH4 are studied by Kiran et al. and Veluswamy et al.11,79,80 The results reported the maximum gas consumption has occurred at half the reactor volume. The hydrate grows with a distinct hollow crater-like formation aided by well-connected channels for liquid flow upward along the reactor walls and simultaneous dendritic crystal growth within the solution in a downward trend resulting in rapid and high gas uptake. The amount of hydrate yield is shown in Fig. 7. The hydrate yield is offered in two windows where the conversion is maximum up to 90 ml of the solution and abruptly decreases with the solution's further addition.
The hydrate conversion is maximum when the water–gas ratio is in the range of 1.16 to 4.08 (CH4) and 2.35 to 8.25 (CO2). As discussed, the seed crystal triggers at the liquid water interface and starts growing above the liquid level via creeping along the reactor's wall. The increased bed height reduces the reactor wall surface area. The hydrate forms on the cold metal parts and further grow with the increase in thickness. The heat and mass transfer are limited, and the maximum water is not channelized for the hydrate conversion, reducing the hydrate conversion. The morphological observations and the molar liquid water–gas ratio are in solid agreement with ascertained hypothesis.
4. Conclusions
In summary, we have performed experiments with CH4 and CO2 gases in the presence of a low dose of 0.5 wt% L-methionine amino acid. The gas storage capacity and reaction time are assessed with varying solution quantities. The maximum efficiency is achieved when the molar liquid water–gas ratio is 4.08 and 8.25 for CH4 and CO2 hydrates. The total CH4 and CO2 gas storage capacity is about 14.3 ± 0.4 and 9.1 ± 0.4 liters (at STP conditions); further increasing the water–gas ratio, the gas storage capacity abruptly decreased. The molar liquid water–gas ratio strongly influences the gas storage capacity of the system. The hydrate morphology shows the hydrate creeps across the reactor's metal surface; the case is the same for CH4 and CO2 systems. When the hydrate fully covers the surface, the growth continues horizontally (increased thickness). With varying water–gas ratios (low to high), the formation kinetics (t90) is delayed. Due to inefficient gas–water interaction, the hydrate formation rate gradually decreases with an increased water–gas ratio. The water adsorbed by the hydrate particles became interstitial, not directly contacting the gas. The gas water interaction is possible only through the diffusion process, a controlling factor for hydrate growth. Optimizing the molar liquid water–gas ratio yields high gas storage capacity and a faster CH4 and CO2 hydrates growth rate—the proposed methodology and the appropriate water–gas ratio help scale up the process.Author contributions
Pinnelli S. R. Prasad: conceptualization, methodology, supervision, writing – review & editing. Burla Sai Kiran: data curation, investigation, software, validation, writing – original draft.Conflicts of interest
There are no conflicts to declare.Acknowledgements
The authors sincerely thank the Director of the National Geophysical Research Institute, Hyderabad, for his encouragement and permission to publish this paper (NGRI/Lib/2021/Pub-168). Partial financial support from MoES (India) and DGH-NGHP (India) are acknowledged. The first author (BSK) acknowledges the Council of Scientific and Industrial Research (CSIR) for the Senior Research Fellowship (SRF-Direct).References
- E. D. Sloan and C. A. Koh, Clathrate hydrates of natural gases, CRC Press, 2007 Search PubMed.
- P. Dewangan, G. Sriram, A. Kumar, A. Mazumdar, A. Peketi, V. Mahale, S. S. C. Reddy and A. Babu, Mar. Pet. Geol., 2021, 124, 104783 CrossRef CAS.
- P. Kumar, T. S. Collett, K. M. Shukla, U. S. Yadav, M. V. Lall and K. Vishwanath, Mar. Pet. Geol., 2019, 108, 3–38 CrossRef.
- T. S. Collett, R. Boswell, W. F. Waite, P. Kumar, S. K. Roy, K. Chopra, S. K. Singh, Y. Yamada, N. Tenma, J. Pohlman and M. Zyrianova, Mar. Pet. Geol., 2019, 108, 39–142 CrossRef.
- D. Oppo, L. De Siena and D. B. Kemp, Sci. Rep., 2020, 10, 2562 CrossRef CAS PubMed.
- I. B. Mizandrontsev, V. V. Kozlov, V. G. Ivanov, K. M. Kucher, E. S. Korneva and N. G. Granin, Water Resour., 2020, 47, 122–129 CrossRef CAS.
- A. Yatsuk, R. Shakirov, A. Gresov and A. Obzhirov, Geo-Mar. Lett., 2019, 40, 481–490 CrossRef.
- A. Mazzini, M. K. Ivanov, J. Parnell, A. Stadnitskaia, B. T. Cronin, E. Poludetkina, L. Mazurenko and T. C. E. van Weering, Mar. Geol., 2004, 212, 153–181 CrossRef CAS.
- C. Sahu, R. Kumar and J. S. Sangwai, Energy Fuels, 2020, 34, 11813–11839 CrossRef CAS.
- P. S. R. Prasad, B. S. Kiran and K. Sowjanya, RSC Adv., 2020, 10, 17795–17804 RSC.
- B. Sai Kiran, K. Sowjanya, P. S. R. Prasad and J.-H. Yoon, Oil Gas Sci. Technol., 2019, 74, 12 CrossRef.
- P. S. R. Prasad and B. Sai Kiran, Sci. Rep., 2018, 8, 8560 CrossRef PubMed.
- B. S. Kiran and P. S. R. Prasad, ACS Omega, 2018, 3, 18984–18989 CrossRef CAS PubMed.
- G. Bhattacharjee, M. N. Goh, S. E. K. Arumuganainar, Y. Zhang and P. Linga, Energy Environ. Sci., 2020, 13, 4946–4961 RSC.
- H. P. Veluswamy, A. Kumar, R. Kumar and P. Linga, Appl. Energy, 2017, 188, 190–199 CrossRef CAS.
- H. P. Veluswamy, G. Bhattacharjee, J. Liao and P. Linga, Energy Fuels, 2020, 34, 15257–15269 CrossRef CAS.
- J. S. Pandey, Y. J. Daas and N. von Solms, Processes, 2020, 8, 124 CrossRef CAS.
- B. S. Kiran, K. Sowjanya, V. V. Eswari and P. S. R. Prasad, Curr. Sci., 2018, 114, 661–666 CrossRef CAS.
- Q. Zhang, J. Zheng, B. Zhang and P. Linga, Appl. Energy, 2021, 287, 116576 CrossRef CAS.
- S. Nallakukkala and B. Lal, J. Environ. Chem. Eng., 2021, 9, 105053 CrossRef CAS.
- P. Babu, C. Bollineni and N. Daraboina, Energy Fuels, 2021, 35, 2514–2519 CrossRef CAS.
- J.-n. Zheng and M. Yang, Desalination, 2020, 478, 114284 CrossRef CAS.
- A. Stoporev, R. Mendgaziev, M. Artemova, A. Semenov, A. Novikov, A. Kiiamov, D. Emelianov, T. Rodionova, R. Fakhrullin and D. Shchukin, Appl. Clay Sci., 2020, 191, 105618 CrossRef CAS.
- A. Mohammadi, J. Mol. Liq., 2020, 309, 113175 CrossRef CAS.
- Y. Liu, J. Han and H. You, Energy, 2020, 190, 116201 CrossRef CAS.
- A. M. Javidani, S. Abedi-Farizhendi, A. Mohammadi, A. H. Mohammadi, H. Hassan and H. Pahlavanzadeh, J. Mol. Liq., 2020, 304, 112665 CrossRef CAS.
- C. Cheng, F. Wang, Y. Tian, X. Wu, J. Zheng, J. Zhang, L. Li, P. Yang and J. Zhao, Renewable Sustainable Energy Rev., 2020, 117, 109492 CrossRef CAS.
- J. Zheng, N. K. Loganathan, J. Zhao and P. Linga, Appl. Energy, 2019, 249, 190–203 CrossRef CAS.
- T. Claßen, P. Seidl, S. Loekman, B. Gatternig, C. Rauh and A. Delgado, Curr. Opin. Food Sci., 2019, 29, 48–55 CrossRef.
- E. D. Sloan, Natural gas hydrates in flow assurance, Gulf Professional Publishing, 2010 Search PubMed.
- B. S. Kiran, G. Rama Rao and P. S. R. Prasad, Petrol. Petrochem. Eng. J., 2020, 4, 000234 Search PubMed.
- L. Wan and D. Q. Liang, J. Ind. Eng. Chem., 2021, 96, 183–193 CrossRef CAS.
- Y. D. Zhang, X. D. Shen and N. Maeda, Energy Fuels, 2020, 34, 2790–2799 CrossRef CAS.
- X. Zhang, E. O. Straume, G. A. Grasso, R. E. M. Morales and A. K. Sum, Fuel, 2020, 262, 116558 CrossRef CAS.
- A. Qasim, M. S. Khan, B. Lal, M. C. Ismail and K. Rostani, Fuel, 2020, 259, 116219 CrossRef CAS.
- F. O. Goodness, A. A. Sarah and A. O. Oluwatoyin, Curr. J. Appl. Sci. Technol., 2020, 38, 1–8 Search PubMed.
- L. Mu and N. von Solms, J. Pet. Sci. Eng., 2020, 188, 106940 CrossRef CAS.
- D. Lee, W. Go and Y. Seo, Fuel, 2020, 263, 116689 CrossRef CAS.
- Y. Kim, I. I. Q. Afonso, H. Jang and J. Lee, J. Ind. Eng. Chem., 2020, 82, 349–358 CrossRef CAS.
- The editor Statistical Review of World Energy, BP p.l.c., 1St James's Square London, SW1Y 4PD UK, http://sr@bp.com.
- In Handbook of Liquefied Natural Gas, ed. S. Mokhatab, J. Y. Mak, J. V. Valappil and D. A. Wood, Gulf Professional Publishing, Boston, 2014, pp. 147–183, DOI:10.1016/B978-0-12-404585-9.00003-9.
- In Handbook of Natural Gas Transmission and Processing, ed. S. Mokhatab, W. A. Poe and J. G. Speight, Gulf Professional Publishing, Burlington, 2006, pp. 295–322, DOI:10.1016/B978-075067776-9/50013-0.
- H. Kanda, Economic study on natural gas transportation with natural gas hydrate (NGH) pellets, Amsterdam, Netherlands, 2006 Search PubMed.
- X. Yuan, B. Zhang, R. Liang, R. Wang and Y. Sun, Appl. Sci., 2020, 10, 1701 CrossRef CAS.
- W. C. Ikealumba and H. Wu, Energy Fuels, 2014, 28, 3556–3586 CrossRef CAS.
- S. Yang, D. Xu, Y. Cui, Y. Ni and C. Duan, Nat. Resour., 2015, 06, 306–311 Search PubMed.
- E. D. Sloan, Nature, 2003, 426, 353–359 CrossRef CAS PubMed.
- Z. Zhang, T. Borhani, M. El-Naas, S. Soltani and Y. Yan, Processes, 2020, 8, 70 CrossRef CAS.
- D. Saha, H. A. Grappe, A. Chakraborty and G. Orkoulas, Chem. Rev., 2016, 116, 11436–11499 CrossRef CAS PubMed.
- H. P. Veluswamy, P. Y. Lee, K. Premasinghe and P. Linga, Ind. Eng. Chem. Res., 2017, 56, 6145–6154 CrossRef CAS.
- L. Shi, J. Ding and D. Liang, Energy, 2019, 180, 978–988 CrossRef CAS.
- H. Li, N. Wei, L. Jiang, J. Zhao, Z. Cui, W. Sun, L. Zhang, S. Zhou, H. Xu, X. Zhang, C. Zhang and X. Wang, Energies, 2020, 13, 531 CrossRef CAS.
- J. Lee, K.-S. Kim and Y. Seo, Chem. Eng. J., 2019, 375, 121974 CrossRef CAS.
- J. Lee, Y. K. Jin and Y. Seo, Chem. Eng. J., 2018, 338, 572–578 CrossRef CAS.
- Y. Wang, D.-L. Zhong, Z. Li and J.-B. Li, Energy, 2020, 197, 117209 CrossRef CAS.
- G. Yue, F.-x. Gao, Y.-w. Wang, Z. Xu, Y. Liu, Q. Sun, X.-x. Li, L.-y. Yang, A.-x. Liu and X.-q. Guo, J. Chem. Eng. Data, 2019, 64, 5824–5837 CrossRef CAS.
- J. Seol, J. Park and W. Shin, Chem. Commun., 2020, 56, 8368–8371 RSC.
- P. S. R. Prasad and V. D. Chari, J. Nat. Gas Sci. Eng., 2015, 25, 10–14 CrossRef CAS.
- V. Dhanunjana Chari, D. V. S. G. K. Sharma and P. S. R. Prasad, Fluid Phase Equilib., 2012, 315, 126–130 CrossRef.
- K. Shin, Y. Kim, T. A. Strobel, P. S. Prasad, T. Sugahara, H. Lee, E. D. Sloan, A. K. Sum and C. A. Koh, J. Phys. Chem. A, 2009, 113, 6415–6418 CrossRef CAS PubMed.
- P. Linga and M. A. Clarke, Energy Fuels, 2016, 31, 1–13 CrossRef.
- P. S. R. Prasad, Y. Sowjanya and V. Dhanunjana Chari, J. Phys. Chem. C, 2014, 118, 7759–7764 CrossRef CAS.
- C. V. V. Eswari, B. Raju, V. D. Chari, P. S. R. Prasad and K. Sain, Mar. Pet. Geol., 2014, 58, 199–205 CrossRef CAS.
- V. D. Chari, P. S. R. Prasad and S. R. Murthy, Oil Gas Sci. Technol., 2014, 70, 1125–1132 CrossRef.
- B. Raju, C. V. V. Eswari, V. D. Chari and P. S. R. Prasad, Methane hydrates with nano/micro size stböer silica, Beijing, China, 2014 Search PubMed.
- V. D. Chari, B. Raju, P. S. R. Prasad and D. N. Rao, Energy Fuels, 2013, 27, 3679–3684 CrossRef CAS.
- Z. Liu, Y. Li, W. Wang, G. Song, Z. Lu, Y. Ning and S. Liu, Fuel, 2021, 293, 120320 CrossRef CAS.
- F. Asadi, N. N. Nguyen and A. V. Nguyen, Energy Fuels, 2020, 34, 9971–9977 CrossRef CAS.
- J. S. Pandey, Y. J. Daas and N. von Solms, Processes, 2019, 7, 598 CrossRef CAS.
- Y. He, M.-T. Sun, C. Chen, G.-D. Zhang, K. Chao, Y. Lin and F. Wang, J. Mater. Chem. A, 2019, 7, 21634–21661 RSC.
- A. Kumar, G. Bhattacharjee, B. D. Kulkarni and R. Kumar, Ind. Eng. Chem. Res., 2015, 54, 12217–12232 CrossRef CAS.
- P. S. R. Prasad and B. S. Kiran, Adv. Chem. Eng., 2020, 3, 100022 CrossRef.
- P. S. R. Prasad, B. S. Kiran and K. Sain, Curr. Sci., 2018, 114, 1163–1165 CrossRef CAS.
- P. S. R. Prasad and B. S. Kiran, J. Nat. Gas Sci. Eng., 2018, 52, 461–466 CrossRef CAS.
- Q. Nasir, H. Suleman and Y. A. Elsheikh, J. Nat. Gas Sci. Eng., 2020, 76, 103211 CrossRef CAS.
- W. F. Hao, J. Q. Wang, S. S. Fan and W. B. Hao, Energy Convers. Manage., 2008, 49, 2546–2553 CrossRef CAS.
- F. Rossi, M. Filipponi and B. Castellani, Appl. Energy, 2012, 99, 167–172 CrossRef CAS.
- W. X. Pang, G. J. Chen, A. Dandekar, C. Y. Sun and C. L. Zhang, Chem. Eng. Sci., 2007, 62, 2198–2208 CrossRef CAS.
- H. P. Veluswamy, A. J. H. Wong, P. Babu, R. Kumar, S. Kulprathipanja, P. Rangsunvigit and P. Linga, Chem. Eng. J., 2016, 290, 161–173 CrossRef CAS.
- H. P. Veluswamy, S. Kumar, R. Kumar, P. Rangsunvigit and P. Linga, Fuel, 2016, 182, 907–919 CrossRef CAS.
| This journal is © The Royal Society of Chemistry 2022 |

