 Open Access Article
Ball pen writing-without-ink: a truly simple and accessible method for sensitivity enhancement in lateral flow assays
Zedong Li†
 ab,
Shuang Wu†ab,
Jingcheng Jiab,
Yuemeng Baiab,
Pengpeng Jiaab,
Yan Gongc,
Shangsheng Fengab and
Fei Li*ab
aThe Key Laboratory of Biomedical Information Engineering of Ministry of Education, School of Life Science and Technology, Xi'an Jiaotong University, Xi'an 710049, P. R. China. E-mail: feili@xjtu.edu.cn
bBioinspired Engineering and Biomechanics Center (BEBC), Xi'an Jiaotong University, Xi'an 710049, P. R. China
cSuzhou DiYinAn Biotechnology Co., Ltd., Suzhou 215010, P. R. China
First published on 13th January 2022
Abstract
Lateral flow assays (LFAs), a popular point-of-care testing platform, have found widespread applications from laboratory to clinics. However, LFA-based testing is still subject to limited detection sensitivity, especially for classical gold nanoparticle-based LFAs. Inspired by traditional pen-based writing technologies, we developed a ball pen writing-without-ink method to amplify the detection signal of LFAs through controlling fluid flow rate. An enhancement of detection sensitivity by two times was obtained. Since the underlying mechanism of this method to improve detection sensitivity is to control the flow rate of the liquid on paper, it may be suitable for most paper-based platforms.
Introduction
Paper is a low-cost, eco-friendly and ubiquitous product in our daily life with a history of more than 2000 years. Meanwhile, paper holds special physicochemical properties of hydrophilicity, flexibility, porosity and flammability, making it very popular in point-of-care testing (POCT) as a microfluidic substrate.1–4 For now, various types of paper-based POCT devices have been developed,5 such as dipstick assays,6 lateral flow assay (LFA),7 and microfluidic paper-based devices (μPADs).8,9 Among them, LFAs, especially for classical gold nanoparticle-based (AuNP-based) LFAs, have found widespread POCT applications from laboratory to clinics, due to their excellent simplicity and practicality. One of the most well-known application of AuNP-based LFAs might be the early pregnancy test, which became commercially available in the 1980s.10 Recently, a large amount of AuNP-based LFAs have been proposed for extending their applications to a wide range of targets, such as heavy metal ions,11 food contaminants12 and infectious diseases.13 Even with such attractive features, AuNP-based LFAs, are still subject to their insufficient detection sensitivity mainly due to the weak visible colorimetric signal produced by gold nanoparticles' aggregation at the test line of LFAs, which inhibits their wide clinical utility.14To address this limitation, many efforts have been made to improve analytical sensitivity of LFA. A typical ready-for-use LFA is constructed by two parts: the labelling systems for signal transition and the paper components for liquid flow. Therefore, sensitivity enhancement strategies have been created mainly aimed at the two parts. For labelling systems, modification of typical AuNPs, such as AuNPs aggregates15 and enzyme modified AuNPs,16 and introduction of alternative nanoparticles, such as quantum dots17 and upconversion nanoparticles,18 have been reported. For this strategy, the detection sensitivity can be improved dramatically (up to three orders18), but these methods are subjected to either time and cost consuming synthesis or complicated peripheral readers. On the other hand, the alteration of fluid flow in LFA has been demonstrated to be an efficient way to improve analytical sensitivity,19 as the delayed fluidic flow can increase reaction time between targets and capture probes. This strategy is mostly obtained by tuning the paper geometry or by introducing flow barriers into paper (e.g., wax pillars,20 polydimethylsiloxane21 and hydrogel22). Furthermore, another valid way to control the fluid flow in LFA can be realized by changing the pore size through pressing paper using pressure controller.23 These fluidic control methods are relatively simple and versatile without modifying labelling systems and can be completed with minimal instruments, thus attracting considerable interests. Even so, these strategies are not available for users at field-use or home-use, which yearns for a sensitivity enhancement strategy without need for any special equipment.
Inspired by pen-based writing on paper,24 which is a truly simple method to deposit functional materials on paper, the pen nib would compress the paper substrate under hand pressure and induce nicks on paper during writing process, especially between hard nibs (e.g., ball pen, fountain pen) and soft papers (e.g., NC membrane). This phenomenon may pose negative effect on making paper electronics, but offers feasibility to control fluid flow in paper, as the porosity of nicked paper would change. Based on this, we developed a ball pen writing-without-ink method to realize fluid flow control in this paper and applied this strategy on LFAs for detection sensitivity enhancement.
Experimental section
Materials
Ball pen (M&G, ball size 1 mm) was purchased from local store. Chloroauric acid (HAuCl4·4H2O) and sodium citrate (Na3C6H5O7·2H2O) were purchased from Shanghai Sinopharm Chemical Reagent Co., Ltd. (China) and American AMRESCO, respectively. The nitrocellulose (NC) membranes (UniSart CN 140) were obtained from Sartorius Stedim Biotech. The conjugate pads, backing pads and absorbent pads used to prepare LFAs were purchased from Shanghai Jiening Biotechnology Co., Ltd. (China). The reagents including detection probe, capture probe, control probe and target DNA used for detection of human immunodeficiency virus type 1 (HIV-1), were synthesized by Shanghai Sangon Biotech Co., Ltd. (China). The detailed sequences were shown in Table 1. All aqueous solutions used in this work were prepared from Milli-Q reagent water (Millipore Corp., resistivity of 18.2 MΩ cm at 25 °C).| Name | Sequence (5′-3′) |
|---|---|
| HIV detection probe | CACAACAGACGGGCACACACTACT |
| HIV capture probe | GTCTGAGGGATCTCTAGTTACCAG |
| HIV control probe | AGTAGTGTGTGCCCG TCTGTTGTG |
| Target DNA | AGTAGTGTGTGCCCGTCTGTTGTGTGACTCTGGTAACTAGAGATCCCTCAGAC |
Synthesis and modification of AuNPs
The synthesis of AuNPs (diameter of 13 nm) and modification of AuNPs with detection probe were reported in our previous work,25 where the detailed characterization of synthesized AuNPs (e.g., SEM image) can also be seen. In brief, 20 μL of 500 mM acetic acid solution (pH = 4.76), 4 μL of 10 mM TCEP solution, 100 μL of deionized water were mixed with detection probe and kept standing for 1 hour at room temperature, and the detection probe solution with concentration of 100 mM was obtained. The mixture solution was added into 20 mL of the prepared AuNPs solution, and proceeded vortex oscillation for 1 hour and followed standing for 16 hours at room temperature for improving their combination efficiency. Then, 221 μL of 1% SDS solution was added. After 1 hour, 1768 μL of 2 M NaCl solution was added, whose process was carried out in four times for 15 min interval. After oscillation of the obtained mixture for 1 hour and standing for 24 hours at room temperature, the obtained AuNPs-DP solution was centrifuged at speed of 14![[thin space (1/6-em)]](https://www.rsc.org/images/entities/char_2009.gif) 500 rpm for 20–30 minutes. After removing the supernatant, the remaining red particles were washed once in PBS (pH = 7.4) and then resuspended in buffer (20 mM Na3PO4, 5% BSA, 0.25% Tween20, 10% sucrose) for ready to use.
500 rpm for 20–30 minutes. After removing the supernatant, the remaining red particles were washed once in PBS (pH = 7.4) and then resuspended in buffer (20 mM Na3PO4, 5% BSA, 0.25% Tween20, 10% sucrose) for ready to use.
Preparation of capture probe and control probe solution
The capture probe solution was prepared by the following protocol: 165 μL of 2 mg mL−1 streptavidin solution and 29 μL of PBS solution (1×) were added into the tube containing 21.6 nmol capture probe powder. After standing for 1 hour at room temperature, 22 μL of absolute ethanol was added into the tube to obtain the capture probe with concentration of 100 μM. Similarly, 173 μL of 2 mg mL−1 streptavidin solution and 31 μL PBS solution (1×) were added into the tube containing 22.7 nmol control probe. After standing for 1 hour at room temperature, 23 μL of absolute ethanol was added into the tube to obtain the control probe with concentration of 100 μM.Preparation of target solution
For preparing HIV standard sample, we used SSC buffer solution (4×) to prepare the stock solution (10 nM), which was then diluted to desired concentrations.Preparation of LFAs
In this study, the LFA was composed of conjugate pad, NC membrane, absorbent pad and backing pad. The NC membrane, the conjugate pad and the absorbent pad were attached to the backing pad in sequence, and mutually overlapped by about 2 mm to ensure they close contact. After the assembly, the program shearer (Matrix™ 2360) was employed to cut into LFAs with a width of 2.5 mm. Then the prepared capture probe solution (0.5 μL) and the control probe solution (0.5 μL) were added onto the NC membrane of LFAs through pipetting. In the same way, 8 μL AuNPs-DP solution was added onto the conjugate pad of LFAs. Finally, the LFAs were stored in a 37 °C incubator and dried for 2 hours for later use.Preparation of the home-made ball pen
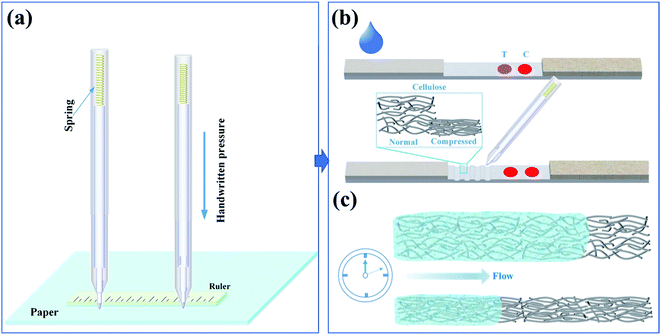
As the pen writing process is carried out manually, writing pressure may differ in different individuals, posing unsatisfactory repeatability. To address this, we made a minor change in pen holder through introducing a spring in the holder (Fig. 1a). During the writing process, the deformation degree of the paper mainly depends on the pressure from the pen. This configuration converts the pressure of handwriting into the elastic force generated by the deformation of the spring. Therefore, the pressure of the pen writing can be controlled only by controlling the deformation degree of the spring, which is determined by the thickness of the ruler during writing.Pen writing trace on LFA
For making nicked trace on LFA, we directly scribe the NC membrane through writing with the ball pen without ink under the aid of a ruler after the LFA was assembled but before it was cut into strips. Specifically, when the NC membrane, absorbent pad, and conjugate pad were all pasted on the backing pad, writing is performed on the lower half of the NC film, and then cut into nicked LFAs with a width of 2.5 mm by using the program shearer.Measurement of flow rate on LFA
To verify that the nicked trace on paper by ball pen writing poses effect on fluid flow on paper, we prepared an NC membrane with a length of 6 cm and a width of 2.5 mm. The flow rate was characterized by analyzing the relationship between the wicking distance of dye solution on NC membrane and the wicking time.LFA for HIV-1 DNA detection
For HIV-1 DNA detection on LFA, we firstly added 80 μL the target solution into the 96-well plate, and then inserted LFA into the well to make the conjugate pad immersed into target solution, and finally recorded the result after 15 minutes.Results and discussion
Principle of ball pen writing technology for controlling fluid flow on paper
During writing process on paper with a hard pen, the pen nib can easily compress the paper substrate with low mechanical strength in the direction of thickness under handwriting pressure, especially for ball pens and fountain pens with metal nibs. Besides, the nib of ball pen is smooth, which makes it not easy to scratch the paper substrate during writing. Compared to fountain pen, ball pen writing shows higher repeatability, because the width of the written trace will change when the writing direction by using fountain pen is changed. Hence, we chose ball pen writing in this paper. Different from the general ball pen writing technology, the proposed ball pen without inks can change the porous structure to slow down the liquid flow rate (Fig. 1). The mechanism for this is mainly based on the relationship of porosity with flow rate as described in Darcy's law.26where Q is flow rate, k is the permeability, W is the width, H is the thickness, μ is the viscosity of fluid, L is the length, and ΔP is the pressure difference. The decrease of the porosity causes the decrease in permeability, resulting in decrease in fluid flow rate. The decreased fluid flow would increase reaction time between targets and capture probes, thus enhancing visualization of AuNPs-based LFA.
Characterization of paper porous structure change after ball pen writing
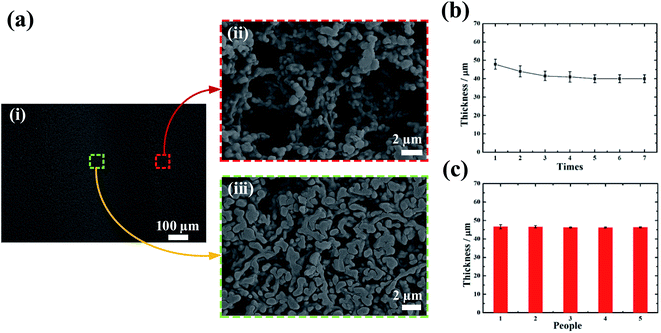
To verify that the ball pen writing can change the porosity of the NC membrane, we investigated the microstructure change of NC membrane after writing (Fig. 2a). From the enlarged view, the fiber alignment becomes tighter in the written trace, leading to remarkable local porosity reduction. Besides, the thickness of written paper also decreases locally, as the pen nib compresses the paper during writing. The thickness and porosity change are determined by writing pressure. To demonstrate its feasibility, we assessed the thickness changes with repeated writing times (Fig. 2b). Since the nib of the ballpoint pen is hemispherical, the traces left on paper are arc-shaped. We measured the smallest thickness using a microscope and found that the thickness decreases slowly and gradually and then stabilizes with the repeated writing times increasing from 1 to 7. The standard deviation of the thickness is significantly reduced, indicating that the repeatability has been significantly improved. On the other hand, we studied the writing repeatability from different individuals and found that the thickness changes are consistent among different individuals (Fig. 2c). These results indicate that the porosity change by ball pen writing is feasible, and the writing process is controllable by simple configuration.Characterization of fluid flow rate on paper
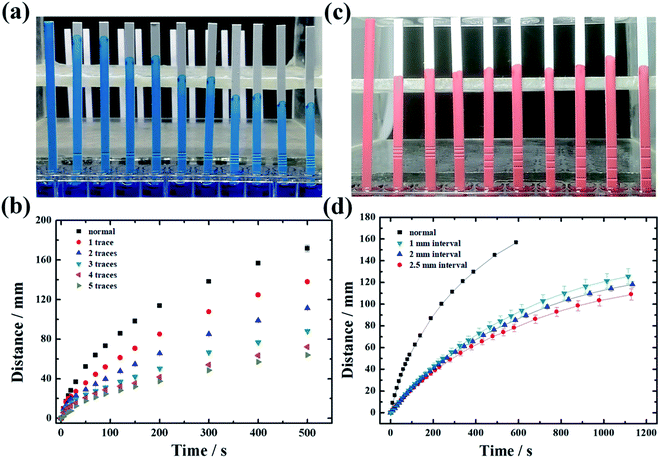
To prove that proposed pen writing method can control the fluid flow rate on paper, we analyzed the change of liquid flow rate on NC membrane by using dye solution (Fig. 3). Considering that the number of written lines may have prominent effects on the flow rate, we wrote different traces from 1 to 4 on NC membrane (Fig. 3a and b). We analyzed the wicking distance with wicking time, whose slope represents flow rate. We found that with increasing number of traces, the flow rate gradually decreases. The main reason is that the greater number of traces, the larger area of paper compressed, posing corresponding larger flow resistance. On the other hand, the water absorption height of the paper also gradually decreases, indicating that the water absorption capacity of the paper decreases. The main reason for this is that the fluid flow on paper is determined by capillary force, gravity and viscous force during the wicking process. The compressed porous structure will weaken the capillary force. When the number of traces exceeds 4, the flow rate stabilizes. Considering that the distance between the written traces may affect the flow rate, we similarly wrote 4 lines with different interval (1, 2, 2.5 mm) on the NC membrane (Fig. 3c and d). When the interval gradually increases, there is no significant difference in the flow rate of the liquid, which means that the interval distance between traces has negligible effect on flow rate.Ball pen writing for LFAs detection sensitivity enhancement
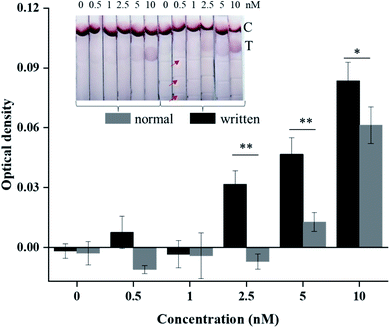
For paper-based POCT applications, LFAs are widely used because of their simple operation, minimum user intervention, and rapid results readout. Classical LFAs are based on AuNPs aggregation to produce visible color, holding advantages of equipment-free readout.27 However, its insufficient detection sensitivity is a major challenge for its wider application. At present, most methods for signal enhancement of LFAs are based on LFAs modification in laboratories. It is of great significance to develop a facile method that users can directly use to achieve detection signal enhancement outside laboratories, as most users have limited access to expensive resources and to common tools or reagents in the laboratory (e.g., pipettes, polydimethylsiloxane reagents). Therefore, user-oriented signal enhancement methods cannot involve these dedicated instruments and reagents. The method proposed in this paper only needs a ball pen, a spring, and a ruler, which are all easily accessible for users. Therefore, to demonstrate practicality, we applied such ball pen writing technology to enhance AuNPs-based LFA detection sensitivity. Based on the above flow rate analysis, it can be seen that the more written traces, the slower flow rate. Here, we chose three written traces. Noteworthily, the thickness of compressed trace is important for LFA detection, which may cause AuNPs residual during wicking process if the thickness is too small. Through optimization, one-time writing was carried out here, as repeated writing would decrease the thickness (Fig. 2b). We tested HIV-1 DNA samples with different concentrations: 0, 0.5, 1, 2.5, 5 and 10 nM. It can be seen that the detection limit of normal LFAs can reach 5 nM based on naked eye qualitative readout, while the detection limit of LFAs after writing can reach 2.5 nM, with detection sensitivity increased by two times (Fig. 4 inset). From the quantitative optical density analysis (Fig. 4), the optical density values of written LFAs are significantly higher than the normal LFAs at the concentrations of 2.5, 5 and 10 nM (three times repeated), which is consistent with the qualitative readout. Here, the optical density of LFA was obtained by subtracting the optical density of the background with the optical density of the test line through the Image-Pro Plus software. So negative values are obtained at low concentrations (0, 0.5, 1 nM), which are acceptable as they are all identified as background values. Therefore, the obtained results indicate that the ball pen writing has a positive effect on enhancing detection signal of LFA.Conclusions
In this paper, we proposed a simple pen-based writing method for signal enhancement of LFA for POCT, as inspired by the phenomenon that the nib of a hard pen makes a compression on soft paper in conventional pen-based writing method. Unlike traditional pen writing techniques, the proposed pen writing in this method does not need inks. We verified that such pen writing technology can change the porosity and pore size of the paper, and further influence the fluid flow on paper. Finally, the detection sensitivity increases by two times was obtained by using such pen writing method. Since the method proposed in this paper only involves easily accessible instruments (a ball pen, a spring, and a ruler), this method shows great practical application value. As the underlying mechanism of this method to improve the detection sensitivity is to control the flow rate of the liquid on paper, it is expected to be suitable for most paper-based platforms. However, considering that NC membrane substrate is soft, its porosity is easy to change through writing. For other paper substrates, such as filter paper and office paper, it may be limited to change their porosity through writing due to their high-strength fiber.Conflicts of interest
There are no conflicts of interest to declare.Acknowledgements
This work was supported by the National Natural Science Foundation of China (21904104), China Postdoctoral Science Foundation (2020M673418), Fundamental Research Funds for the Central Universities (xzy012019067).References
- M. M. Gong and D. Sinton, Chem. Rev., 2017, 117, 8447–8480 CrossRef CAS PubMed.
- Y. Yang, E. Noviana, M. P. Nguyen, B. J. Geiss, D. S. Dandy and C. S. Henry, Anal. Chem., 2016, 89, 71–91 CrossRef PubMed.
- S. Nishat, A. T. Jafry, A. W. Martinez and F. R. Awan, Sens. Actuators, B, 2021, 336, 129681 CrossRef CAS.
- L.-L. Shen, G.-R. Zhang and B. J. M. Etzold, ChemElectroChem, 2020, 7, 10–30 CrossRef CAS PubMed.
- Z. Li, Y. Bai, M. You, J. Hu, C. Yao, L. Cao and F. Xu, Biosens. Bioelectron., 2021, 177, 112952 CrossRef CAS PubMed.
- A. B. N. Najian, E. Syafirah, N. Ismail, M. Mohamed and C. Y. Yean, Anal. Chim. Acta, 2016, 903, 142–148 CrossRef PubMed.
- S. Dalirirad and A. J. Steckl, Sens. Actuators, B, 2019, 283, 79–86 CrossRef CAS.
- D. M. Cate, S. D. Noblitt, J. Volckens and C. S. Henry, Lab Chip, 2015, 15, 2808–2818 RSC.
- J. Reboud, G. Xu, A. Garrett, M. Adriko, Z. Yang, E. M. Tukahebwa, C. Rowell and J. M. Cooper, Proc. Natl. Acad. Sci. U. S. A., 2019, 116, 4834–4842 CrossRef CAS PubMed.
- W. C. Mak, V. Beni and A. P. Turner, TrAC, Trends Anal. Chem., 2016, 79, 297–305 CrossRef CAS.
- A. M. López_Marzo, J. Pons, D. A. Blake and A. Merkoçi, Biosens. Bioelectron., 2013, 47, 190–198 CrossRef.
- S. Rong-Hwa, T. Shiao-Shek, C. Der-Jiang and H. Yao-Wen, Food Chem., 2010, 118, 462–466 CrossRef CAS.
- D. Lee, Y. Shin, S. Chung, K. S. Hwang, D. S. Yoon and J. H. Lee, Anal. Chem., 2016, 88, 12272–12278 CrossRef CAS PubMed.
- J. R. Choi, Z. Liu, J. Hu, R. Tang, Y. Gong, S. Feng, H. Ren, T. Wen, H. Yang, Z. Qu, B. Pingguan-Murphy and F. Xu, Anal. Chem., 2016, 88, 6254–6264 CrossRef CAS PubMed.
- D. H. Choi, S. K. Lee, Y. K. Oh, B. W. Bae, S. D. Lee, S. Kim, Y.-B. Shin and M.-G. Kim, Biosens. Bioelectron., 2010, 25, 1999–2002 CrossRef CAS PubMed.
- C. Parolo, A. de la Escosura-Muñiz and A. Merkoçi, Biosens. Bioelectron., 2013, 40, 412–416 CrossRef CAS PubMed.
- Y.-Y. Lin, J. Wang, G. Liu, H. Wu, C. M. Wai and Y. Lin, Biosens. Bioelectron., 2008, 23, 1659–1665 CrossRef CAS PubMed.
- M. You, M. Lin, Y. Gong, S. Wang, A. Li, L. Ji, H. Zhao, K. Ling, T. Wen, Y. Huang, D. Gao, Q. Ma, T. Wang, A. Ma, X. Li and F. Xu, ACS Nano, 2017, 11, 6261–6270 CrossRef CAS PubMed.
- E. Fu and C. Downs, Lab Chip, 2017, 17, 614–628 RSC.
- L. Rivas, M. Medina-Sánchez, A. de la Escosura-Muñiz and A. Merkoçi, Lab Chip, 2014, 14, 4406–4414 RSC.
- J. R. Choi, Z. Liu, J. Hu, R. Tang, Y. Gong, S. Feng, H. Ren, T. Wen, H. Yang, Z. Qu, B. Pingguan-Murphy and F. Xu, Anal. Chem., 2016, 88, 6254–6264 CrossRef CAS PubMed.
- J. R. Choi, K. W. Yong, R. Tang, Y. Gong, T. Wen, H. Yang, A. Li, Y. C. Chia, B. Pingguan-Murphy and F. Xu, Adv. Healthcare Mater., 2017, 6, 1600920 CrossRef PubMed.
- J. Park, J. H. Shin and J.-K. Park, Anal. Chem., 2016, 88, 3781–3788 CrossRef CAS.
- N. Guo, F. Lou, Y. Ma, J. Li, B. Yang, W. Chen, H. Ye, J.-B. Zhang, M.-Y. Zhao, W.-J. Wu, R. Shi, L. Jones, K. S. Chen, X. F. Huang, S.-Y. Chen and Y. Liu, Sci. Rep., 2016, 6, 33519 CrossRef CAS.
- R. Tang, H. Yang, J. R. Choi, Y. Gong, J. Hu, S. Feng, B. Pingguan-Murphy, Q. Mei and F. Xu, Talanta, 2016, 152, 269–276 CrossRef CAS.
- J. Park, J. H. Shin and J.-K. Park, Micromachines, 2016, 7, 48 CrossRef PubMed.
- Q. Wang, Y. Liu, M. Wang, Y. Chen and W. Jiang, Anal. Bioanal. Chem., 2018, 410, 223–233 CrossRef CAS PubMed.
Footnote |
| † The authors contributed equally. |
| This journal is © The Royal Society of Chemistry 2022 |


