 Open Access Article
Integrated in silico – in vitro strategy for the discovery of potential xanthine oxidase inhibitors from Egyptian propolis and their synergistic effect with allopurinol and febuxostat†
Dina S. Ghallaba,
Eman Shawky a,
Ali M. Metwallya,
Ismail Celikb,
Reham S. Ibrahim‡
 *a and
Mohamed M. Mohyeldin‡a
aDepartment of Pharmacognosy, Faculty of Pharmacy, Alexandria University, Alexandria 21521, Egypt. E-mail: rehamsaid84@yahoo.com; reham.abdelkader@alexu.edu.eg; Tel: +20-1223821098
bDepartment of Pharmaceutical Chemistry, Faculty of Pharmacy, Erciyes University, Kayseri 38039, Turkey
First published on 21st January 2022
Abstract
Xanthine oxidase (XO) has been well-recognized as a validated target for the treatment of hyperuricemia and gout. Currently, there are two drugs in clinical use that shut down XO overactivity, allopurinol and febuxostat; however, detrimental side effects restrict their applications. Propolis is a unique natural adhesive biomass of structurally variable and biologically active metabolites that exert remarkable health benefits. Moreover, combination drug therapy has become a promising pharmacotherapeutic strategy directed for reformulating existing drugs into new combination entities with potentiating therapeutic impacts. In this study, computer-aided molecular docking and MD simulations accompanied by biochemical testing were used for mining novel pharmacologically active chemical entities from Egyptian propolis to combat hyperuricemia. Further, with a view to decrease the potential toxicity of synthetic drugs and enhance efficacy, propolis hits were subjected to combination analysis with each of allopurinol and febuxostat. More specifically, Glide docking was utilized for a structure-based virtual screening of in-house datasets comprising various Egyptian propolis metabolites. Rosmarinic acid, luteolin, techtochrysin and isoferulic acid were the most promising virtual hits. In vitro XO inhibitory assays demonstrated the ability of these hits to significantly inhibit XO in a dose-dependent manner. Molecular docking and MD simulations revealed a cooperative binding mode between the discovered hits and standard XO inhibitors within the active site. Subsequently, the most promising hits were tested in a fixed-ratio combination setting with allopurinol and febuxostat separately to assess their combined effects on XO catalytic inhibition. The binary combination of each techtochrysin and rosmarinic acid with febuxostat displayed maximal synergy at lower effect levels. In contrast, individually, techtochrysin and rosmarinic acid with allopurinol cooperated synergistically at high dose levels. Taken together, the suggested strategy seems imperative to ensure a steady supply of new therapeutic options sourced from Egyptian propolis to regress the development of hyperuricemia.
1. Introduction
Xanthine oxidase (XO) is a highly versatile enzyme that is predominantly distributed throughout diverse mammalian tissues including the liver, gut, lung, kidney, heart, and brain, as well as the plasma.1 XO is one of the rate-limiting enzymes involved in purine metabolism. Importantly, XO catalyzes the sequential oxidative hydroxylation of hypoxanthine to uric acid via xanthine as an intermediate accompanied by the generation of two reactive oxygen species (ROS), hydrogen peroxide (H2O2), and superoxide anion (O2−).2 These biochemical reactions can be illustrated in the schematic diagram depicted in Fig. 1.Xanthine oxidoreductase (XOR) exists in two interconvertible forms; xanthine dehydrogenase (XDH) and XO.1 Most XOR exists in its XDH form in the liver while being converted into the XO form under oxidative conditions.3 The X-ray crystal structure of XO reveals a large homo-dimer with a molecular weight of 290 kDa. It belongs to a molybdoflavoprotein family with each catalytically independent subunit-containing four redox-active sites: (a) one molybdo-pterin (Mo-pt) cofactor in the C-terminal domain, wherein the oxidation process of xanthine occurs reducing it from Mo(VI) to Mo(IV) by exploiting either NAD+ or O2, (b) a pair of non-identical ferredoxin-like (2Fe-2S) centers in the N-terminal domain and, (c) one flavin adenine dinucleotide cofactor (FAD) located in the intermediate domain in which the reduction of NAD+ to NADH takes place at the FAD site of XDH while that of O2 to O2− or hydrogen peroxide at the FAD site of XO.4 These biochemical reactions usually proceed in a “ping-pong” manner.1
Overproduction or under-excretion of uric acid leads to an enhanced serum level of uric acid, which is termed hyperuricemia. Importantly, hyperuricemia is directly associated with elevated XO activity; it is potentially injurious and usually triggers numerous pathophysiological conditions including gout.5 Gout is a common musculoskeletal pathology in which excessive levels of uric acid deposit as urate crystals in joints, resulting in painful acute gouty arthritis.6 Moreover, gout is also linked with other deleterious conditions such as hypertension, diabetes mellitus and cardiovascular diseases.7 Meanwhile, an elevated number of reactive oxygen species (ROS) generated by XO is also implicated in the development of inflammation, multiple cardiovascular attacks, renal hypoxia, ischemia-reperfusion injury and carcinogenesis.8 Accordingly, xanthine oxidase has been recognized as a validated pharmacological target for the treatment of hyperuricemia and gout. Furthermore, XO inhibition has been considered as one of the best defensive approaches against hazardous oxidative stress due to free radicals. In this scenario, XO inhibitors markedly remain in the first-line as free radical scavengers.
Allopurinol is the first purine-based therapeutic option approved by the food and drug administration (FDA) for the clinical treatment of gout; it blocks the synthesis of uric acid by shutting down XO activity.9 However, its prolonged use may cause undesirable side effects such as hypersensitivity problems, Stevens–Johnson syndrome, renal toxicity, liver necrosis and gastrointestinal distress.10 Therefore, there is an immense need for evolving non-purine alternatives with potent XO inhibitory activity and better safety profile. Meanwhile, febuxostat has been launched in the US as a potent non-purine XO inhibitor, which has attracted worldwide attention.1 Although febuxostat is a very clinically effective drug, its use is occasionally limited by some adverse effects including hypersensitive drug reactions.11 Moreover, febuxostat has been lately restricted for broad use in various hyperuricemia-related diseases.12 Recently, febuxostat has been issued a new boxed warning by the FDA cautioning that the drug may increase the risk of death from heart-related issues, or any other causes compared with allopurinol.13 Hence, there is a continued need to discover an expanded repertoire of novel XO inhibitors with an enriched pharmacological profile and diminished undesirable side effects.
The wonder plant-derived bee product, propolis (bee glue), has been traditionally used in complementary medicine since ancient times.14 Propolis is a powerful resinous mixture that comprises multiple bioactive components including flavonoids, terpenes, alcohols, phenolic acids and their esters.15 Due to its complex chemistry, propolis potentially exhibited various biological effects such as antioxidants, antimicrobial, anti-inflammatory, anticancer, hepatoprotective and anti-neurodegenerative activities.15
In fact, propolis has definitively a large variety of therapeutic properties, being broadly used since 300 years B.C. in folk medicine worldwide.16 More specifically, poplar-type propolis has been traditionally used in gout- and arthritis-treatment practices in medieval Europe with satisfactory therapeutic outcomes.17 Besides, Populus nigra is traditionally used to ameliorate several inflammatory-related pathologies primarily gouty arthritis, bronchitis and respiratory tract diseases.18 Importantly, the inclusion of this wonderful bee product in food and food supplements as a safe complementary and alternative medicine has been readily approved by the United States Food and Drug Administration (FDA) and the Scientific Committee (SC) of the European Food Safety Authority (EFSA).19
The chemical variability and biological activities of propolis are markedly attributed to the plant origin, geographical locations and collecting season.20 Egyptian propolis has recently drawn growing interest among chemists and biologists, both as a remedy and as a source of new pharmacologically active chemical entities owing to its diverse biomedical applications.21 Propolis collected in Egypt has been demonstrated to have a chemical profile similar to the poplar-type propolis, which is rich in flavonoids and phenylpropanoids,22 hence they can be utilized as attractive leads for the rational design of therapeutic xanthine oxidase inhibitors due to their beneficial antioxidant, anti-inflammatory, and micromolar inhibitory activities against xanthine oxidase.23
In the same context, previous studies have revealed that some flavonoids such as apigenin and luteolin, isolated from Perilla frutescens, act as potential XO competitive inhibitors with IC50 values of (6.33 ± 0.18) × 10−6 and (8.21 ± 0.77) × 10−6 mol L−1, respectively, their inhibitory activities were superior to allopurinol [IC50= (13.16 ± 0.72) × 10−6 mol L−1].24 In addition, pinobanksin and galangin were reported to exhibit potent XO inhibitory potential in a dose-dependent and competitive manner.25 Various in vitro kinetic studies have readily indicated that quercetin is a significant mixed-type inhibitor of xanthine oxidase with IC50 value of (2.92 ± 0.03) × 10−6 mol L−1.1
Employing computational virtual screening approach can offer clear molecular insights into the ligand-binding mechanism by identification of the involved key amino acid residues, docking the molecules within the target protein, ranking hits according to their binding affinities, checking their physio-chemical features and predicting their pharmacokinetics and toxic potential aimed at opening new avenues for the discovery of new potential drug-like candidates amenable for hit-to-lead design to satisfy unmet medical needs.26
Combination or multicomponent drug therapy has gained considerable attention as an effective approach in the management of chronic medical conditions, including rheumatoid arthritis, diabetes mellitus, Alzheimer's disease, malignancies, pulmonary disorders, cardiovascular diseases, pain, neurologic disorders, as well as HIV and other infectious diseases.27 In this respect, multicomponent therapies exploit the chances for better efficacy, minimize adverse effects of each individual agent, and delay the emergence of drug resistance.28 In addition, the reformulation of existing drugs into new combination products directed at multiple therapeutic targets acts as an attractive pharmacotherapeutic strategy for the pharmaceutical industry that is currently facing a diminution in the discovery and approval of novel molecular entities.29 Currently, there are numerous preclinical-research articles on drug combinations in several disease settings including cancer, autoimmune, cardiovascular, metabolic, and neurological disorders to improve treatment response.30,31 In the same context, a recent study revealed that the combined regimen of baicalein with allopurinol manifested a distinct synergistic effect against XO activity that could ultimately treat hyperuricemia, a pre-disposing factor of gout.32
In view of the aforementioned points, Egyptian propolis-derived phytoconstituents have been assessed in the present study for their XO inhibitory effects as well as the mechanisms underlying these effects using computer-aided molecular docking accompanied by further biochemical testing, in an attempt to discover novel candidates for the regulation of uric acid overproduction and its resulting complications. The resulting potential hits were also investigated for their XO enzyme suppressive effects when combined with allopurinol or febuxostat compared to a single compound treatment.
2. Materials and methods
2.1. Materials
XO enzyme (grade I, from bovine milk, approximately 10.4 units per mL) and xanthine substrate were purchased from Sigma Chemical Co. (St. Louis, MO, USA). Allopurinol, febuxostat, quercetin, rosmarinic acid, luteolin, kaempferol, isoferulic acid, genkwanin and techtochrysin (analytical grade) were also obtained from Sigma-Aldrich Co. All other reagents and solvents used in the study were of analytical grade.2.2. In silico docking studies
The Schrödinger Maestro 11.8 software package (LLC, New York, NY) was chosen for structure-based virtual screening as well as the prediction of the binding mode of the top-scoring constituents-XO complexes.After the dataset generation, the chemical structure of each compound was imported into the Maestro 11.8 panel interface (Maestro, version 11.8, 2018, Schrödinger, USA). The LigPrep 2.3 module (LigPrep, version 2.3, 2018, Schrödinger, USA) was implemented to generate the 3D structure and to search for different conformers. The OPLS (OPLS 2005, Schrödinger, USA) force field was implemented to geometrically optimize each ligand structure and compute partial atomic charges. Finally, since the chirality center of each ligand was not specified, 32 poses per ligand were generated with different steric features for subsequent docking studies.
The constructed validation set comprising 30 molecules with experimentally verified activity against XO (Table S2†), together with 1000 decoys implanted at the Schrödinger suite were docked into 3NVY crystalline structure to judge the ability of the enzyme structure in discriminating XO inhibitors from decoys. Glide enrichment calculator with numerous validation parameters such as sensitivity, specificity, ROC, AUC-ROC, BEDROC and EF (at 2%, 5% and 10%) was employed to assess the accuracy of Glide docking in predicting geometric poses and scoring protein–ligand complexes.
2.3. Experimental treatments
Briefly, tested compounds were dissolved in 10% dimethyl sulfoxide (DMSO) as stock solutions (10.0 × 10⁻³ mol L−1), and then diluted to different concentrations according to the following protocol: all tested samples (10 mM) were quantitatively transferred into a 10 mL volumetric flask, dissolved in 10% dimethyl sulfoxide (DMSO) and the volume was adjusted to 10 mL with the same solvent, then 10 μL portions from the prepared stock solutions were separately transferred into 10 mL volumetric flasks and the volume was adjusted to 10 mL using distilled water. Hence, (10 μM) stock solution for each tested sample was prepared. Finally, all stock solutions were diluted to the required concentrations with the buffer.2.4. In vitro assay of xanthine oxidase inhibitory activity
The ability of in silico hits to inhibit the catalytic activity of xanthine oxidase was monitored spectrophotometrically (Hitachi U-2000 UV/visible spectrophotometer, UK) under aerobic conditions by continuously measuring uric acid formation using xanthine as a substrate at 295 nm according to the previously reported methods with slight modifications.23,24 In brief, the assay mixture consisted of 1 mL of the test inhibitor solution, 1.9 mL of phosphate buffer (pH 7.5) and 0.1 mL of XO enzyme solution (0.24 units per mL in phosphate buffer, pH 7.5), which was prepared immediately before use. After pre-incubation at 37 °C for 15 min, the reaction was initiated by the addition of 1 mL of freshly prepared substrate solution (0.4 mM) into the mixture. The assay mixture was then incubated at 37 °C for 30 min. The enzyme reaction was stopped by adding 1 mL of hydrochloric acid (1 M) and the absorbance was measured at 295 nm using the UV/vis spectrophotometer. A blank solution was prepared in the same manner, but the enzyme solution was added to the assay mixture after adding 1 M HCl. The FDA-approved XO inhibitor, febuxostat (0.08 μM) was set up as a positive control. Each treatment was replicated twice, and XO activity was expressed as percent inhibition of xanthine oxidase. % inhibition was determined according to the following equation:| [1-(AbsTest inhibitor − Abspositive control)/(Absnegative control − Abspositive control)] × 100 | (1) |
Inhibitory potencies for the tested compounds were expressed as IC50 values (the concentrations causing the half-maximal inhibition) determined by fitting the experimental data to a dose-response nonlinear regression curve using GraphPad Prism software (Version 6.01).
2.5. The study of synergistic inhibitory activity on XO enzyme
The XO inhibitory activity of the combination therapy was assayed using the same method as described in Section 2.4. Operationally, the doses of techtochrysin, rosmarinic acid, allopurinol and febuxostat exhibited the following effect levels of enzymatic activity reduction (10%, 30%, 50%, 70% and 90%) were redefined and summarized in Table 1.
| Effect level (ECx)a | Dose (μM) | |||
|---|---|---|---|---|
| Techtochrysin | Rosmarinic acid | Febuxostat | Allopurinol | |
| a EC10, EC30, EC50, EC70 and EC90, are the doses of each individual agent required to induce 10, 30, 50, 70 and 90% inhibition of XO enzyme activity, respectively. | ||||
| EC10 | 0.024 | 0.26 | 0.005 | 0.18 |
| EC30 | 0.046 | 0.48 | 0.015 | 0.42 |
| EC50 | 0.084 | 0.97 | 0.02 | 0.82 |
| EC70 | 0.28 | 2.44 | 0.04 | 1.84 |
| EC90 | 0.88 | 5.22 | 0.12 | 4.05 |
The most active propolis hits; techtochrysin and rosmarinic acid were tested in a fixed-ratio combination setting with allopurinol or febuxostat to assess their combined effects on XO catalytic inhibition. Various published methodologies, including the median-effect analysis, isobologram, combination index, and dose reduction index analysis, were applied in an attempt to evaluate the nature of the proposed combinations in this study.
2.5.1.1. The median-effect analysis approach. Using the user-friendly CompuSyn software (Chou and Martin, 2005, CompuSyn Inc., USA), the sigmoidal dose-effect curve for every single agent and their binary combination was easily plotted and then transformed into their corresponding linear median-effect plots based on the median-effect equation,40 derived from the general mass-action law principle. This principle provides a reasonable link between a single entity and multiple entities.41 The median-effect equation (MEE) suggested by Chou (2006) can be itemized as follows42
 | (2) |
 | (2′) |
In the median-effect plot, y = log(fa/fu) versus x = log(D), log(Dm) is the x-intercept. The conformity of the data to the mass-action principle can be manifested by the linear correlation coefficient (r) of the median-effect plot, which is usually >0.97 for in vitro experiments.43
2.5.1.2. Isobolographic analysis. Dose-normalized isobolograms were generated using the computer program CompuSyn (Chou and Martin, 2005, CompuSyn Inc., USA) to provide a fundamental basis for illustrating the dose-dependent interaction of combined drugs at various effect levels. The combination effect could be greater, equal to, or smaller than would have been expected from individual agents.41
Operationally, isobologram is a two-coordinate plot with each coordinate representing the concentration of drugs A and B, respectively. The concentrations of both drugs A and B needed to yield a particular effect x (e.g., IC50,A and IC50,B when x = 50%), when applied as single drugs, were placed on the x and y-coordinates, respectively. The diagonal line of additivity was created by connecting these two points (e.g., (IC50,A, 0) and (0, IC50,B) for a 50% effect isobologram plot). Following that, the concentrations of A and B, which have been used in the combination study to provide the same effect x (e.g. x = 50%), were represented in the same plot as a by point (CA, x, CB, x). Combination data points depicted above, on or below the additivity line indicated antagonism, additivity, or synergy, respectively.44
2.5.1.3. Combination index analysis. The isobologram-combination index equation (CI) merging with the median-effect equation provides a quantitative measurement of the extent of interaction of combined drugs at a series of effect levels. CI numerical values were automatically calculated using CompuSyn software (Chou and Martin, 2005, CompuSyn Inc., USA) according to the following formula45
 | (3) |
Meanwhile, combination index (fa–CI) plots were automatically generated using CompuSyn software (CompuSyn Inc., 2005) by plotting combination indices against a series of effect levels. The fa–CI plot represents an effect-oriented plot that simply displays the kind of interaction; synergism, antagonism, or additive effect, as a function of the effect level or potency (fa) of certain combined drugs on the enzyme.45 It is worth noting that the effect-oriented plot (fa–CI) and the dose-oriented isobologram are two sides of the same coin; each of them is based on MEE (eqn (2) and (2′)) and hence provides an identical conclusion of synergism or antagonism.
2.5.1.4. Dose reduction index (DRI) analysis. The dose reduction index (DRI) of two-compound combinations indicates how many-fold dose-reduction is achieved for each compound in their synergistic combination, as compared with the doses of each drug alone, to produce the same enzymatic activity reduction effect (fa).46
DRI was automatically calculated using CompuSyn software by applying the following formula:47
 | (4) |
A fold change of DRI > 1 is useful as it implies a decline of doses of combined agents while retaining the same effectiveness. Such favorable dose-reduction whilst maintaining the same therapeutic efficacy could result in an improvement of the potential toxicity profile to the host in clinical settings.
a The molar febuxostat–techtochrysin ratios 1![[thin space (1/6-em)]](https://www.rsc.org/images/entities/char_2009.gif) : :![[thin space (1/6-em)]](https://www.rsc.org/images/entities/char_2009.gif) 2.1, 1 2.1, 1![[thin space (1/6-em)]](https://www.rsc.org/images/entities/char_2009.gif) : :![[thin space (1/6-em)]](https://www.rsc.org/images/entities/char_2009.gif) 4.2 (IC50 4.2 (IC50![[thin space (1/6-em)]](https://www.rsc.org/images/entities/char_2009.gif) : :![[thin space (1/6-em)]](https://www.rsc.org/images/entities/char_2009.gif) IC50 ratio), 1 IC50 ratio), 1![[thin space (1/6-em)]](https://www.rsc.org/images/entities/char_2009.gif) : :![[thin space (1/6-em)]](https://www.rsc.org/images/entities/char_2009.gif) 8.4, 1 8.4, 1![[thin space (1/6-em)]](https://www.rsc.org/images/entities/char_2009.gif) : :![[thin space (1/6-em)]](https://www.rsc.org/images/entities/char_2009.gif) 16.8, and 1 16.8, and 1![[thin space (1/6-em)]](https://www.rsc.org/images/entities/char_2009.gif) : :![[thin space (1/6-em)]](https://www.rsc.org/images/entities/char_2009.gif) 33.6 are indicated in pink, green (IC50 33.6 are indicated in pink, green (IC50![[thin space (1/6-em)]](https://www.rsc.org/images/entities/char_2009.gif) : :![[thin space (1/6-em)]](https://www.rsc.org/images/entities/char_2009.gif) IC50 ratio), red, orange and grey. IC50 ratio), red, orange and grey. |
|---|
 |
![[thin space (1/6-em)]](https://www.rsc.org/images/entities/char_2009.gif) :
:![[thin space (1/6-em)]](https://www.rsc.org/images/entities/char_2009.gif) 4.2 (IC50
4.2 (IC50![[thin space (1/6-em)]](https://www.rsc.org/images/entities/char_2009.gif) :
:![[thin space (1/6-em)]](https://www.rsc.org/images/entities/char_2009.gif) IC50 molar ratio) and other different molar-based ratios (1
IC50 molar ratio) and other different molar-based ratios (1![[thin space (1/6-em)]](https://www.rsc.org/images/entities/char_2009.gif) :
:![[thin space (1/6-em)]](https://www.rsc.org/images/entities/char_2009.gif) 2.1, 1
2.1, 1![[thin space (1/6-em)]](https://www.rsc.org/images/entities/char_2009.gif) :
:![[thin space (1/6-em)]](https://www.rsc.org/images/entities/char_2009.gif) 8.4, 1
8.4, 1![[thin space (1/6-em)]](https://www.rsc.org/images/entities/char_2009.gif) :
:![[thin space (1/6-em)]](https://www.rsc.org/images/entities/char_2009.gif) 16.8, and 1
16.8, and 1![[thin space (1/6-em)]](https://www.rsc.org/images/entities/char_2009.gif) :
:![[thin space (1/6-em)]](https://www.rsc.org/images/entities/char_2009.gif) 33.6). Each agent alone or their combined concentrations (IC50
33.6). Each agent alone or their combined concentrations (IC50![[thin space (1/6-em)]](https://www.rsc.org/images/entities/char_2009.gif) :
:![[thin space (1/6-em)]](https://www.rsc.org/images/entities/char_2009.gif) IC50 ratio or other indicated ratios) were normalized to their respective single-agent IC50 and referred to as IC50 equivalent-concentrations (IC50 eq). IC50eq of individual and combined drugs were calculated using the following formula:47
IC50 ratio or other indicated ratios) were normalized to their respective single-agent IC50 and referred to as IC50 equivalent-concentrations (IC50 eq). IC50eq of individual and combined drugs were calculated using the following formula:47
 | (5) |
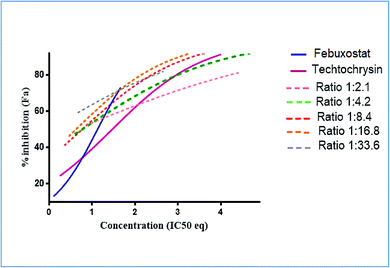
Following that, IC50 eq data of individual agents; techtochrysin and febuxostat, as well as their combined treatments at different molar concentration ratios were graphed in the same plot against their corresponding inhibitory effect levels from 0–100% (Fa × 100) using GraphPad Prism. Such simultaneous presentation of these concentration-effect curves would easily illustrate that lower drug concentrations are needed to attain any particular XO inhibitory effect relative to individual agents. Synergistic combinations will exhibit lower IC50eq values relative to single agents (IC50eq values of one) to achieve any given effect. This is visually represented in a leftward shift of the combination trendlines relative to the dose-response curves of the single agents indicating synergy. In contrast, a rightward shift of concentration-effect curves for combinations can be interpreted as antagonism.47
2.6. Statistical analysis
The results are presented as the means ± standard deviation (SD) of at least three independent experiments and analyzed by one-way (ANOVA) followed by Tukey post hoc test for single measurements, p < 0.001 was considered statistically significant. Statistical analysis was performed using GraphPad Prism (GraphPad, version 6.01) software and the Computer program CompuSyn (Chou and Martin, 2005, CompuSyn Inc., USA). The IC50 values were calculated using a non-linear regression curve fitting analysis using GraphPad Prism software version 6.01 (La Jolla, CA, USA).3. Results and discussion
3.1. Molecular docking studies on the database
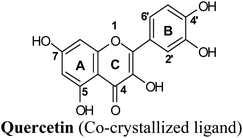
Protein visualization revealed a homodimer composed of three chains each with a tertiary structure of two domains, an alpha-beta roll and a mainly alpha orthogonal bundle. Xanthine oxidase has two distinct substrate-binding sites; (a) molybdenum molybdopterin (Mo-pt) active site in which the catalytic oxidation of xanthine occurs reducing it from Mo(VI) to Mo(IV) and (b) flavin adenine dinucleotide (FAD) center wherein the substrate oxygen is reduced with transferred electrons generating O2− radical or hydrogen peroxide (H2O2).1 The Mo center is characterized by critical amino acids including ARG880, PHE1009, PHE914, GLU802, ASN768, THR1010, VAL1011, LEU873, and GLU1216, aligning a water channel near the molybdenum atom of the Mo-pt cofactor (Fig. 2), and they were proven to play pivotal roles in the catalytic hydroxylation of the substrate.1 Catalytic inhibitors usually bind to the Mo-pt active site forming multiple interactions with its key amino acid residues involved in catalysis. This will in turn completely block the water channel leading to the molybdenum center and its surrounding space and hinder the binding of xanthine, preventing its oxidation.50 Accordingly, the binding site of the co-crystallized ligand; quercetin, which involved ARG880, PHE1009, PHE914 and GLU802 was chosen for docking simulation (PDB ID 3NVY, Fig. 2).
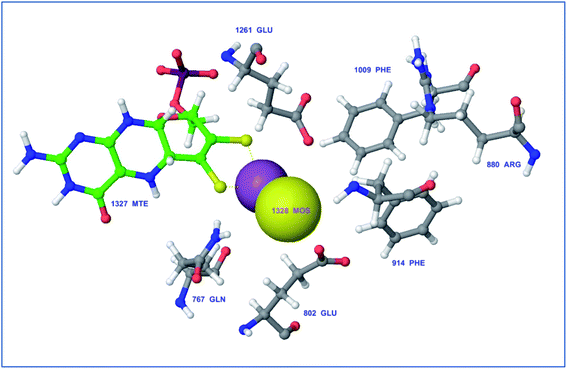 | ||
| Fig. 2 Catalytic amino acid residues in the active site of xanthine oxidase (PDB ID 3NVY). Amino acid residues are shown in grey color and labeled with names and positions. Molybdopterin (Mo) cofactor is shown in green color (ball and stick model) with Mo atoms in yellow & violet (space-filling (CPK) model). | ||
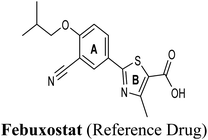
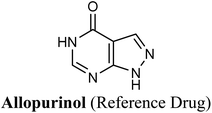
A test or a training run was performed using two marketed XO inhibitor drugs; allopurinol and febuxostat in addition to the co-crystalized ligand quercetin due to its well-documented XO inhibitory activity.51
The test run has been applied in order to validate the virtual screening protocol and ensure its efficiency. The test set was prepared and docked into the chosen XO crystal structure 3NVY using Glide XP (Schrödinger, USA). The three compounds in the test set were docked successfully, suggesting the validity of the implemented docking parameters (Table 3 and Fig. S1–S3†). The bound conformation of the co-crystal ligand; quercetin was generated with a good RMSD of 0.3 Å, showing the robustness of the docking protocols. As expected, febuxostat and quercetin demonstrated strong binding affinities with docking scores of −10.039 and −9.993, respectively (Table 3). Both compounds were able to fill the water channel near the molybdenum atom of the Mo-pt cofactor and thus inhibited enzyme activity by obstructing the substrate-binding (Fig. S1 and S2†). In contrast, allopurinol exhibited much lower binding affinity with a docking score of −4.957, despite satisfying some critical interactions with key amino acids in the active site (Table 3 and Fig. S3†). Such a low docking score of allopurinol could be attributed to the imperfect filling of the crucial hydrophobic space within the substrate entering channel near the molybdenum atom of the Mo-pt cofactor, leading to a serious energy penalty affecting the allopurinol's overall binding affinity. It is important to point out that allopurinol, unlike febuxostat and quercetin, is further hydroxylated by XO to give oxipurinol, the actual potent inhibitor of XO in biological settings, which in turn tends to bind covalently to the reduced molybdenum ion Mo(IV) of the enzyme and inhibits catalysis.52 Importantly, oxipurinol exhibited only weak inhibition of the enzyme without this covalent bond.53 This could explain the relatively low docking score of allopurinol in the training set in silico results and suggest the validity of the implemented scoring functions.
| Rank | Hit name & chemical structure | Docking score | Type of interactiona | Amino acid (ligand functional group) involved in interaction |
|---|---|---|---|---|
| a Hb denotes hydrogen bonding interaction, π–π stacking denotes pi–pi stacking. | ||||
| — |  |
−9.993 | Hb (side chain) | SER876 (3′-OH), ARG880 (7-OH), THR1010 (7-OH), GLU802 (3-OH) |
| π–π stacking | ARG880 (ring A), PHE1009 (ring A), PHE914 (ring A) | |||
| Hydrophobic | PHE1013 (ring B), LEU 1014 (ring B), LEU873 (ring B) | |||
| — |  |
−10.039 | Hb (backbone and side chain) | ARG880 (C![[double bond, length as m-dash]](https://www.rsc.org/images/entities/char_e001.gif) O), THR1010 (COO−), ASN768 (CN) O), THR1010 (COO−), ASN768 (CN) |
| Hydrophobic | LEU648 (isobutyl), LEU873 (ring A) | |||
| π–π stacking | PHE1009 (ring B), PHE914 (ring B) | |||
| Salt bridge | ARG880 (COO−) | |||
| — |  |
−4.975 | Hb (backbone and side chain) | THR1010 (C![[double bond, length as m-dash]](https://www.rsc.org/images/entities/char_e001.gif) O & pyrimidine NH), ARG880 (C O & pyrimidine NH), ARG880 (C![[double bond, length as m-dash]](https://www.rsc.org/images/entities/char_e001.gif) O) O) |
| π–π stacking | ARG880 (pyrazole), PHE1009 (pyrazole), PHE914 (pyrazole) | |||
| 1 | 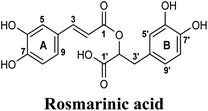 |
−10.390 | Hb (side chain) | SER876 (6′ & 7′-OH), ARG880 (7-OH), THR1010 (7-OH), ASN768 (1′-C![[double bond, length as m-dash]](https://www.rsc.org/images/entities/char_e001.gif) O) O) |
| π–π stacking | ARG880 (ring A), PHE1009 (ring A), PHE914 (ring A) | |||
| Hydrophobic | LEU648 (ring B), PHE649 (ring B) | |||
| Salt bridge | LYS771 (1′-COO−) | |||
| 2 | 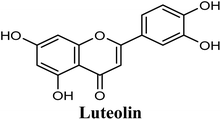 |
−9.887 | Hb (side chain) | THR1010 (7-OH), ARG880 (7-OH) |
| Hydrophobic | LEU648 (ring B), PHE1013 (ring B) | |||
| π–π stacking | PHE1009 (ring A), PHE914 (ring A), ARG880 (ring A) | |||
| 3 | 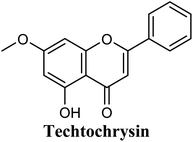 |
−9.563 | Hb (backbone and side chain) | THR1010 (5-OH), ARG880 (5-OH), VAL1011 (C![[double bond, length as m-dash]](https://www.rsc.org/images/entities/char_e001.gif) O) O) |
| Hydrophobic | LEU648 (ring B), PHE649 (ring B), LEU873 (ring B), ALA910 (ring B), PHE911(Ring B), PHE1005 (–OCH3), ALA1078 (–OCH3), ALA1079 (–OCH3) | |||
| π–π stacking | PHE1009 (rings A & C), PHE914 (rings A & C), ARG880 (rings A & C) | |||
| 4 | 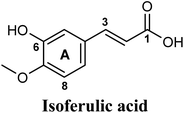 |
−9.557 | Hb (backbone and side chain) | ARG880 (C![[double bond, length as m-dash]](https://www.rsc.org/images/entities/char_e001.gif) O), SER876 (6-OH), THR1010 (COO−) O), SER876 (6-OH), THR1010 (COO−) |
| Salt bridge | ARG880 (COO−) | |||
| Hydrophobic | PHE1013 (ring A), LEU1014 (ring A) | |||
| 5 | 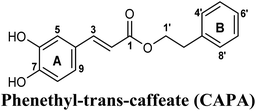 |
−9.474 | Hb (side chain) | THR1010 (6-OH), ARG880 (7-OH) |
| π–π stacking | PHE1009 (ring A), PHE914 (ring A) | |||
| Hydrophobic | VAL1011 (ring B), PHE1013 (ring B), LEU1014 (ring B) | |||
| π–cation | LYS771 (ring B) | |||
| 6 | 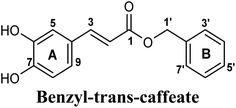 |
−9.343 | Hb (side chain) | THR1010 (6-OH), ARG880 (7-OH) |
| π–π stacking | PHE1009 (ring A), PHE914 (ring A) | |||
| Hydrophobic | LEU648 (benzyl moiety), PRO1076 (ring B), ALA1078 (ring B) | |||
| 7 | 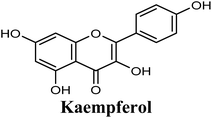 |
−9.289 | Hb (side chain) | THR1010 (7-OH), ARG880 (7-OH), GLU802 (3-OH) |
| π–π stacking | PHE1009 (rings A & C), PHE914 (rings A & C) | |||
| Hydrophobic | LEU873 (ring B), LEU1014 (ring A) | |||
| 8 | 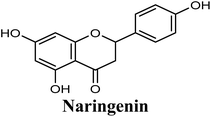 |
−9.252 | Hb (backbone and side chain) | THR1010 (C![[double bond, length as m-dash]](https://www.rsc.org/images/entities/char_e001.gif) O), VAL1011 (C O), VAL1011 (C![[double bond, length as m-dash]](https://www.rsc.org/images/entities/char_e001.gif) O), ARG880 (5-OH), ALA1079 (7-OH) O), ARG880 (5-OH), ALA1079 (7-OH) |
| π–π stacking | PHE1009 (ring A), PHE914 (ring A) | |||
| Hydrophobic | LEU1014 (ring B), ALA 1078 (ring A) | |||
| 9 | 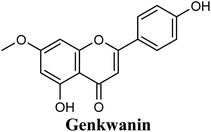 |
−9.221 | Hb (backbone and side chain) | THR1010 (5-OH), ARG880 (5-OH), VAL1011 (C![[double bond, length as m-dash]](https://www.rsc.org/images/entities/char_e001.gif) O) O) |
| Hydrophobic | LEU1014 (ring B) | |||
| π–π stacking | PHE1009 (rings A & C), PHE914 (rings A & C) | |||
| 10 | 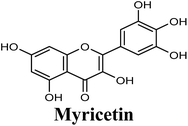 |
−9.158 | Hb (side chain) | THR1010 (7-OH), ARG880 (7-OH), GLU802 (3-OH) |
| π–π stacking | PHE1009 (rings A & C), PHE914 (rings A & C) | |||
| Hydrophobic | LEU648 (ring B), PHE649 (ring B) | |||
| 11 | 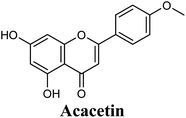 |
−9.145 | Hb (side chain) | THR1010 (7-OH), ARG880 (7-OH) |
| π–π stacking | PHE1009 (rings A & C), PHE914 (rings A & C) | |||
| Hydrophobic | LEU648 (ring B), PHE649 (ring B), LEU873 (ring B), VAL1011 (ring B), PHE1013 (ring B), LEU1014 (ring B) | |||
| 12 | 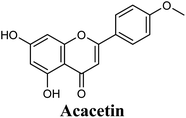 |
−8.981 | Hb (side chain) | THR1010 (7-OH), ARG880 (7-OH) |
| π–π stacking | PHE1009 (rings A & C), PHE914 (rings A & C) | |||
| Hydrophobic | LEU648 (ring B), PHE649 (ring B), LEU873 (ring B), VAL1011 (ring B), PHE1013 (ring B), LEU1014 (ring B) | |||
| 13 | 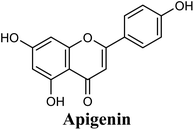 |
−8.857 | Hb (side chain) | THR1010 (7-OH), ARG880 (7-OH) |
| π–π stacking | PHE1009 (rings A & C), PHE914 (rings A & C) | |||
| Hydrophobic | VAL1011 (ring B), PHE1013 (ring B), PHE1005 (ring A) | |||
| 14 | 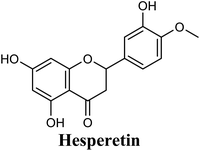 |
−8.842 | Hb (side chain) | THR1010 (7-OH) |
| π–π stacking | PHE1009 (ring A), PHE914 (ring A) | |||
| Hydrophobic | LEU648 (ring B), PHE1013 (ring B), LEU1014 (ring B), PRO1076 (ring B) | |||
| 15 | 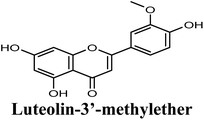 |
−8.791 | Hb (side chain) | THR1010 (7-OH), ARG880 (7-OH) |
| π–π stacking | PHE1009 (rings A & C), PHE914 (rings A & C) | |||
| Hydrophobic | Pro1076 (ring B), VAL1011 (ring B), PHE1013 (ring B), LEU 1014 (ring B) | |||
| 16 | 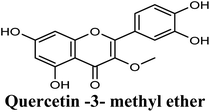 |
−8.775 | Hb (side chain) | SER876 (3′-OH), THR1010 (7-OH), ARG880 (7-OH) |
| π–π stacking | PHE1009 (rings A & C), PHE914 (ring A) | |||
| Hydrophobic | PRO1076 (3-OCH3), ALA1078 (3-OCH3), ALA1079 (3-OCH3), PHE649 (ring B) | |||
| 17 | 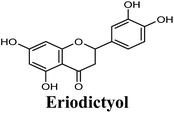 |
−8.660 | Hb (side chain) | THR1010 (7-OH) |
| π–π stacking | PHE1009 (ring A), PHE914 (ring A) | |||
| Hydrophobic | PHE649 (ring B), VAL1011 (ring B), PHE1013 (ring B), LEU1014 (ring B) | |||
| 18 |  |
−8.616 | Hb (side chain) | ARG880 (7-OH, 6-OCH3), THR1010 (7-OH) |
| π–π stacking | PHE1009 (ring A), PHE914 (ring A) | |||
| Hydrophobic | LEU648 (butenyl group), PHE1013 (butenyl group), LEU1014 (butenyl group) | |||
| 19 |  |
−8.583 | Hb (backbone and side chain) | ARG880 (C![[double bond, length as m-dash]](https://www.rsc.org/images/entities/char_e001.gif) O), THR1010 (C O), THR1010 (C![[double bond, length as m-dash]](https://www.rsc.org/images/entities/char_e001.gif) O) O) |
| Salt bridge | ARG880 (COO−) | |||
| Hydrophobic | LEU648, PHE649, PHE1009, PHE1013, LEU1014, MET1118 (long 18-carbon chain) | |||
| 20 |  |
−8.484 | Hb (backbone and side chain) | ARG880 (C![[double bond, length as m-dash]](https://www.rsc.org/images/entities/char_e001.gif) O), THR1010 (COO−) O), THR1010 (COO−) |
| Salt bridge | ARG880 (COO−) | |||
| Hydrophobic | LEU648, PHE914, VAL1011, PHE1013, LEU1014 (long 16-carbon chain) | |||
The in-house compound set was prepared and docked into the same XO crystal structure 3NVY applying the same docking parameters used for the test set and binding poses were saved. Following that, potential hits were ranked according to their extra precision docking scores and the results for the top twenty virtual hits are demonstrated in Table 3. The primary hit list resulting herein consisted of a compilation of 20 natural products belonging to different chemical classes including flavonoids (e.g. techtochrysin), phenolic acids (e.g. isoferulic acid), phenolic esters (e.g. 3-methyl-3-butenyl ferulate), phenolic esters with a free carboxylic acid group (e.g. rosmarinic acid), and long-chain saturated fatty acids (e.g. stearic acid). For instance, Fig. S4† shows the docking model of techtochrysin in the co-crystal structure of quercetin bound to XO (PDB ID 3NVY). Techtochrysin almost overlaid quercetin, the original co-crystallized ligand, satisfying the same critical interactions within the Mo-pt center (Fig. S4†).
Docking and ranking results revealed that rosmarinic acid, luteolin, techtochrysin and isoferulic acid had the lowest binding energies and the strongest binding affinities with docking scores of −10.390, −9.887, −9.563 and −9.557, respectively (Table 3). Among the primary hit list, the natural flavonoid luteolin has been previously reported to inhibit XO activity in different platforms, which added further validation to the results of the virtual screening campaign.54 Accordingly, a final shortened hit list of three natural products; rosmarinic acid, techtochrysin and isoferulic acid, was made available for further biological validation.
The binding mode of selected natural products representing the final hit list, as predicted by molecular docking, is shown in Fig. 3. Initially, the visualization of the binding poses of rosmarinic acid, techtochrysin and isoferulic acid in XO crystal structure 3NVY emphasized their complete shape fitting within the water channel leading towards the Mo-pt cofactor in the XO active site (Fig. 3, lower panel). Rosmarinic acid; the top identified hit, formed five hydrogen bonds with XO key amino acid residues SER876, ARG880, THR1010, ASN768, thus hindering their involvement in catalysis (Fig. 3A and Table 3). Chemically, rosmarinic acid is composed of two fragments: caffeic acid and 3,4-dihydroxyphenyllactic acid, which are connected together via an ester linker. The aromatic ring of the caffeic acid moiety is sandwiched between PHE914 and PHE1009, forming strong π–π stacking interactions with their side chains, in a manner similar to the binding modes observed for all substrates of the enzyme51 (Fig. 3A and Table 3). Meanwhile, the free carboxylic acid group of the 3,4-dihydroxyphenyllactic acid moiety is predicted to form a salt bridge with the side chain of LYS771 under physiological conditions, thus anchoring rosmarinic acid in a pose that allows for a tight ligand–receptor interaction, and hence better blockade of xanthine substrate binding in the Mo center preventing its oxidation.
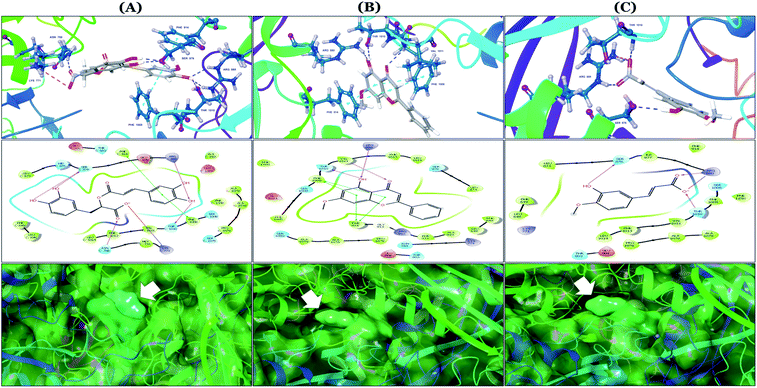 | ||
| Fig. 3 In silico binding poses of (A) rosmarinic acid, (B) techtochrysin, and (C) isoferulic acid interacting with XO active site's amino acid residues (PDB ID 3NVY). Upper panel: important interactions of potential hits along with the corresponding amino acids at the XO binding site, the protein is shown in three-dimensional cartoon presentation. Blue dotted lines indicate hydrogen bonds while light blue dotted lines show pi–pi stacking interactions. Magenta dotted lines indicate salt bridges in 3D view. Middle panel: the two-dimensional ligand interaction diagrams (LID) of potential hits at the XO binding site are shown. Magenta solid arrows indicate hydrogen bonds (backbone) while magenta dotted arrows denote hydrogen bonds (side chain). Green & purplish red solid lines represent pi–pi stacking interactions and salt bridges, respectively. Lower panel: the transparent protein surface, in aquamarine color, and the solid hits surface, in spring green color marked with white arrows. | ||
Docking studies clearly showed that the co-crystallized ligand; quercetin and other structurally analogous flavonoids; namely, luteolin, techtochrysin, kaempferol, naringenin, genkwanin, myricetin, acacetin, biochanin A, luteolin-3′-methylether, quercetin-3-methylether and eriodictyol represents a cluster of good XO binders with docking scores ranging from −9.790 to −8.660 (Table 3). Binding mode analyses and acquired docking scores demonstrated that quercetin and related natural flavonoids bind strongly at the molybdenum center active site with their benzopyran scaffold, or at least ring A, sandwiched between the conserved phenylalanine residues; PHE914 and PHE1009, and their exocyclic carbonyl groups oriented toward ARG880 (Fig. 3B, S1 and S5,† Table 3). Meanwhile, the aromatic ring B of the investigated flavonoids was buried in the XO binding site and exerted potential hydrophobic interactions with the side chains of LEU648, PHE649, LEU873, ALA910, PHE911, PRO1076, VAL1011, PHE1013, and LEU1014 lining the enzyme hydrophobic pockets (Fig. 3B, S1 and S5,† Table 3). Except for 2,3-dihydroflavones, the flavonoids cluster interacted via its phenolic hydroxyl group at either C-5 or C-7 forming bidentate hydrogen bonding interactions with the side chains of both ARG880 and THR1010, thus hindering these residues from participating in catalysis (Fig. 3B, S1 and S5,† Table 3). In contrast, hesperetin and eriodictyol, with a flavonone or 2,3-dihydroflavone skeleton, maintained a single hydrogen bond through their C-7 hydroxyl group with the side chain of THR1010 only (Table 3). Meanwhile, the 2,3-dihydroflavone named naringenin hydrogen bonded with; naringenin, hydrogen bonded with the side chains of both ARG880 and THR1010, but through its C-5 hydroxyl and C-4 carbonyl groups, respectively (Table 3). Moreover, the C-4 carbonyl group of naringenin, in addition to techtochrysin and genkwanin, engages in a hydrogen bond with the backbone NH of VAL1011 (Fig. 3B and Table 3). In the case of 3- hydroxy flavones such as quercetin, kaempferol and myricetin, the C-3 hydroxyl group is attributed to a favorable hydrogen bonding interaction with GLU802 (Fig. S1,† Table 3). Collectively, these crucial interactions seemed to control the overall orientation of quercetin and are structurally related flavonoids within the Mo center conferring inhibition of XO catalysis.
Docking simulations also proposed the promising potential of some phenolic acids and phenolic esters as XO inhibitors including isoferulic acid, phenethyl-trans-caffeate, benzyl-trans-caffeate and 3-methyl-3-butenyl ferulate, with docking scores of −9.557, −9.474, −9.343 and −8.616, respectively (Table 3). Detailed examination of isoferulic acid's binding pose presented the free carboxylic acid and C-6 phenolic hydroxyl groups as the main binding and anchoring pharmacophoric groups at the substrate-binding site of XO (Fig. 3C, Table 3). The free carboxylic acid group participated in a pair of important hydrogen bonds with the backbone NH of THR1010 and the side chain of ARG880 while forming a favorable salt bridge with ARG880. Meanwhile, the isoferulic acid's aromatic ring was located within the crucial hydrophobic space of the molybdopterin domain and demonstrated a strong hydrogen bond, via its C-6 phenolic hydroxyl group, with the side chain of SER876 (Fig. 3C, Table 3). It is interesting to note that long-chain saturated fatty acids, such as stearic and palmitic acids, maintained the same hydrogen bonds and electrostatic interactions exerted by the carboxylic acid group of isoferulic acid, whilst lacking the required bulkiness and aromaticity to fill the hydrophobic space of the Mo center, justifying their relatively weaker predicted binding affinities (Table 3).
On the other hand, phenolic esters showed a binding pattern nearly similar to that of isoferulic acid within the XO binding pocket; their methoxy and/or hydroxyl substituents at C-6 and C-7 of ring A satisfied the critical hydrogen bonding interactions with ARG880 and THR1010 (Table 3). Furthermore, a favorable π–π stacking interaction was observed within 5 Å distance between aromatic ring A in phenolic esters and the side chains of PHE914 and PHE1009 (Table 3). In addition, the alcohol moiety in phenolic esters was extended to form hydrophobic interactions, via either its phenyl ring B in phenethyl-trans-caffeate (CAPA) and benzyl-trans-caffeate or through its aliphatic hydrocarbon chain as in the case of 3-methyl-3-butenyl ferulate, with LEU648, PRO1076, ALA1078, VAL1011, PHE1013 and LEU1014 along with the lipophilic space of XO enzyme (Table 3). Exceptionally, the aromatic ring B of CAPA was uniquely engaged in a π–cation interaction with the side chain of LYS771, justifying its relatively higher docking score compared with other phenolic esters (Table 3).
In summary, our computational docking simulation studies predicted the potential of certain chemical scaffolds in Egyptian propolis including phenolic acids, phenolic esters, and flavonoids as promising XO inhibitors. Binding mode analysis studies provided molecular insights into the interactions of potential in silico hits with the catalytically important amino acid residues at the enzyme active site. Docking results afforded a final shortened hit list of three natural products: rosmarinic acid, techtochrysin and isoferulic acid, representing different chemical classes and with supportive binding data, thus they were subjected to further biochemical evaluation.
| Validation parameters | 3NVY |
|---|---|
| a RMSD value was calculated for 3NVY enzyme crystalline structure with co-crystallized ligand (quercetin).b Ranked actives are the number of actives recovered from the constructed validation set. | |
| RMSDa | 0.5 |
| AUC-ROC | 0.98 |
| EF (2%) | 50 |
| EF (5%) | 20 |
| EF (10%) | 10 |
| RIE | 15.15 |
BEDROC (α![[thin space (1/6-em)]](https://www.rsc.org/images/entities/char_2009.gif) = =![[thin space (1/6-em)]](https://www.rsc.org/images/entities/char_2009.gif) 8) 8) |
1 |
BEDROC (α ![[thin space (1/6-em)]](https://www.rsc.org/images/entities/char_2009.gif) = =![[thin space (1/6-em)]](https://www.rsc.org/images/entities/char_2009.gif) 20) 20) |
1 |
BEDROC (α ![[thin space (1/6-em)]](https://www.rsc.org/images/entities/char_2009.gif) = =![[thin space (1/6-em)]](https://www.rsc.org/images/entities/char_2009.gif) 160) 160) |
1 |
| Ranked activesb | 30 |
| Approximate sensitivity | 0.98 |
| Specificity | 0.99 |
For the sake of clarity, the ROC plot indicated that the enzyme crystal structure (3NVY) exhibited a good specificity successfully discriminating between the actives and decoys and high sensitivity detecting all the active compounds with an approximate value of 0.99 concerning the measure of how highly a randomly selected active is ranked compared to a randomly chosen decoy expressed by AUC-ROC, it was observed that 3NVY revealed an excellent value of 0.98.
As shown in Table 4, EF values revealed that the docking protocol principally retrieves active ligands out of a seeded random set, when the top 2%, 5% and 10% of the total set were considered, respectively, noting that the maximum attainable enrichment factors are 50, 20, and 10 for EF (2%), EF (5%), and EF (10%), respectively.33
To ensure optimal early recognition of actives from decoys at different tuning parameter values α, BEDROC parameter was utilized recording high scores at all α values. An excellent RIE value was noted highlighting the optimal performance of docking protocol in ranking active compounds at high positions of the hit list (Table 4).
3.2. In vitro xanthine oxidase inhibitory activity of the top-scoring compounds
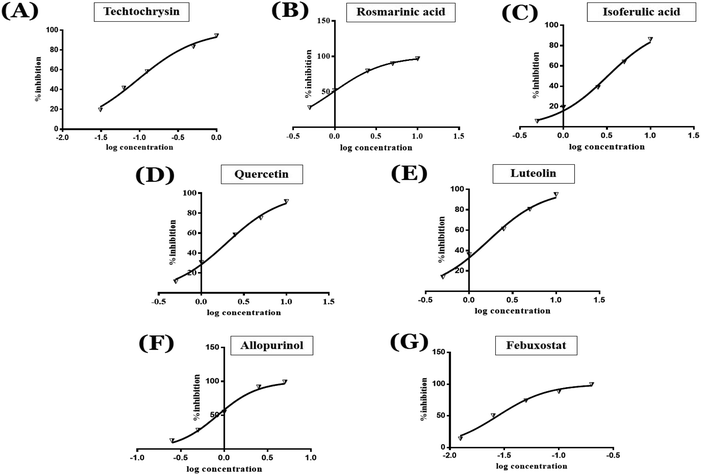
Based on the encouraging in silico results, the top-scoring virtual hits were subjected to further laboratory-based in vitro testing with an ultimate goal of investigating new molecules to be adopted as lead compounds for the rational design of potential chemical entities with less or no side effects for the treatment of hyperuricemia and associated inflammatory disease states. In this study, the in vitro XO inhibitory potency of the final shortened hit list including rosmarinic acid, techtochrysin and isoferulic acid, was assessed using a cell-free spectrophotometric assay by measuring uric acid levels at 295 nm. Generally, cell-free biochemical assays are widely used for XO inhibitors mining due to their automation-friendly, easy to use, relatively low cost, and wide availability. Quercetin and luteolin, with the previously reported XO inhibitory potential,54 were included in the study for activity comparison and structure–activity relationship (SAR) studies. Meanwhile, allopurinol and febuxostat were used as positive standard controls and their IC50 values were determined. Table 5 shows the concentration that resulted in 50% XO inhibition (IC50 values) for all tested compounds, as determined using nonlinear fitting of concentration-response data (Fig. 4). The calculated IC50 values of febuxostat and allopurinol in this assay were 0.02 and 0.82 μM, respectively, which were consistent with their reported values,11,52 validating the results of this study.| Compound | IC50 (μM) |
|---|---|
| a Data are expressed as mean of three experiments ± SD. F: F for ANOVA test, pairwise comparison bet. Each 2 groups was done using post hoc test (LSD). p: p value for comparing between the studied groups. Means in the column with common letters are not significant (i.e. means with different letters are significant). | |
| Techtochrysin | 0.084f ± 0.013 |
| Rosmarinic acid | 0.97d ± 0.042 |
| Luteolin | 1.68c ± 0.055 |
| Quercetin | 1.98b ± 0.062 |
| Isoferulic acid | 3.23a ± 0.083 |
| Febuxostat | 0.02f ± 0.003 |
| Allopurinol | 0.82e ± 0.041 |
| F | 1565.403a |
| p | <0.001a |
| LSD | 0.078 |
As shown in Fig. 4, the results of the XO assay demonstrated the ability of all investigated compounds to significantly inhibit the formation of uric acid catalyzed by XO in a dose-dependent manner, which in turn validated the results of the virtual study. Among the tested compounds, techtochrysin was found to possess the greatest potency; with an IC50 value in the nanomolar range (IC50 = 0.084 μM ± 0.013). The XO inhibitory activities of other tested hits decreased in the order of rosmarinic acid (IC50 = 0.97 μM ± 0.042), luteolin (IC50 = 1.68 μM ± 0.055), quercetin (IC50 = 1.98 μM ± 0.062) and isoferulic acid (IC50 = 3.23 μM ± 0.083) (Table 5).
Earlier studies highlighted the structure–function relationship of flavonoids interacting with XO enzyme and revealed some key structural features in the flavonoids class proved to be important in terms of effective XO inhibition; (i) the conjugated 2-phenyl benzopyran scaffold seemed desirable and complemented the shape of the active site, (ii) the exocyclic carbonyl group at position 4 appeared to be essential for effective inhibition, and (iii) the presence of hydroxyl groups at positions 5 and 7 of ring A was likely crucial for XO inhibitory activity and contributed significantly to the binding affinity.4
Structure–activity relationship studies (SARs) for the tested flavonoids in this study have been summarized in Fig. 6C. As shown in Table 3, the three tested flavonoids shared a central planer skeleton including a conjugated three-ring backbone, a hydroxy group at position 5 and an oxygenated aromatic carbon at position 7. However, techtochrysin displayed a much lower IC50 value and hence significantly higher potency, when compared with luteolin and quercetin as XO inhibitors (Table 5). The variability among studied flavonoids was due to different substitution patterns at positions 7 of the A ring and 3′, 4′, 5′ of the B ring as well as position 3 of the C ring (Table 3). Despite the fact that both quercetin and luteolin possessed hydroxyl groups at C-5 and C-7 of ring A, they exhibited a weaker XO inhibitory profile when compared with techtochrysin (Table 5). Interestingly, the replacement of one hydroxyl group at position 7 with a methoxy substituent in techtochrysin, while maintaining the second hydroxyl at C-5, resulted in a dramatically more active derivative, consistent with a previous report.55 Docking studies further justified this activity enhancement; the techtochrysin's C-7 methoxy group, despite lacking hydrogen bonding interactions, occupied lipophilic pocket-forming favorable hydrophobic interactions with the side chains of PHE914, PHE1005, ALA1078 and ALA1079 along with the lipophilic space of XO enzyme (Fig. 3B and 5A, Table 3). These hydrophobic interactions might explain, at least in part, the significant impact of the C-7 methoxy group on activity improvement in techtochrysin, compared with related flavonoids possessing hydroxyl group at this position, and underscore the importance of only one hydroxyl group in ring A for flavonoids binding and subsequent XO inhibitory capacity (Table 5). Typically, the C-7 methoxy group resided between PHE914 and the residue at the tip of the lipophilic pocket, PHE1005; nevertheless, it was not sufficiently bulky enough to perfectly fill the pocket or lacked the aromaticity to engage in π-electron interactions with the aromatic residues shaping the pocket (Fig. 3B and 5A). Therefore, increasing the bulkiness at this site is expected to enhance the XO binding affinity and subsequent inhibitory potency. Additional studies should be conducted to identify the substituent with optimal size at the C-7 position of techtochrysin. Despite its participation in a hydrogen bond with GLU802 in our docking studies, the results of the enzymatic assay showed that the presence of a hydroxyl group at position 3 of the flavonoids C ring negatively influenced the XO inhibitory activity, as evidenced by the weaker suppression ability of the 3-hydroxyl substituted benzopyran of quercetin versus the C-3 unsubstituted luteolin (Tables 3 and 5, Fig. S1, S5†). It is also important to point out that the IC50 values of quercetin and luteolin in this assay were consistent with their reported values, adding further validation for the results of this study.50,54
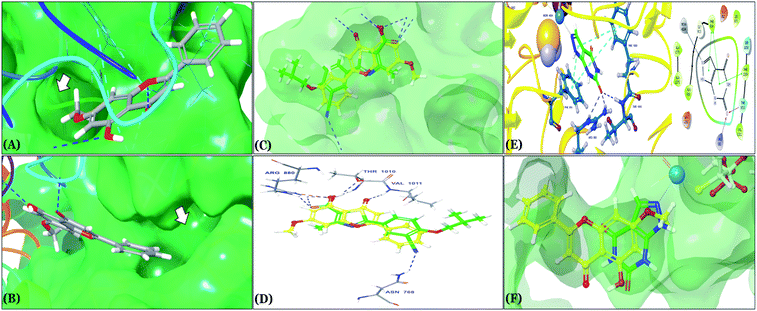 | ||
| Fig. 5 (A and B) In silico binding pose of techtochrysin at the ATP binding site of XO crystal structure (PDB ID 3NVY). The protein surface is shown in aquamarine solid surface representation; (A) the lipophilic pocket of XO protein is indicated by an arrow, (B) the deep end of the XO binding site is indicated by an arrow (C) structure overlay for techtochrysin with the febuxostat conformations (D) overlaid docked poses of techtochrysin and febuxostat interacting with XO active site's amino acid residues (PDB ID 3NVY). (E) 3D & 2D diagrams of docked pose of oxipurinol interacting with XO active site's amino acid residues. (F) Structure overlay for techtochrysin with oxipurinol conformations. | ||
As expected from our binding mode studies, techtochrysin's ring B is important to enable the molecular extension and access the deep end of the XO binding site demarcated by LEU648, PHE649, LEU873, ALA910 and PHE911 (Fig. 3B and 5B, Table 5). However, the presence of hydroxyl groups at C-3′ and C-4′ of ring B in luteolin and quercetin were presumed to be another reason underlying the tremendous difference in their XO inhibitory activities from techtochrysin (Table 5). This could be attributed to the fact that the pocket where ring B resided is entirely hydrophobic; hence the two hydroxyls exhibited multiple unfavorable van der Waal interactions with LEU648, PHE649, LEU873, VAL1011 and PHE1013 leading to a serious energy penalty and thus, negatively influencing the activity (Fig. S6†). Furthermore, a previous report has demonstrated the negative impact of the C-4′-hydroxyl group on the potency of flavonoid-based XO inhibitors, corroborating the results of this study.1
In an attempt to better understand whether positions 3′ and 4′ of techtochrysin's B ring are amenable for future optimization, structural overlay studies were conducted for techtochrysin with the antigout drug; febuxostat, at the XO binding site of the crystal structure 3NVY (Fig. 5C and D). It is noteworthy that febuxostat was 4 fold more active than techtochrysin in the XO cell-free assay, justifying its selection for overlay studies (Table 5). The space occupied by techtochrysin was similar to that exploited by febuxostat, where the techtochrysin's benzopyran core perfectly superimposed with the substituted thiazole moiety of febuxostat, which in turn formed multiple non-covalent salt bridges, hydrogen bonds and π–π stacking interactions with the catalytic amino acid residues; ARG 880, THR1010, PHE914 and PHE1009 (Fig. 5D and S2,† Table 3). It is worth noting that the fitting of techtochrysin and febuxostat to the enzyme's active site was consolidated by free rotation of the region connecting their aforementioned overlaid cores with an aromatic ring. Therefore, the two inhibitors efficiently matched the structure of the substrate entering channel leading towards the Mo-pt cofactor in the XO active pocket, adding further justification to the results of the enzymatic assay (Fig. 5C, Table 5).
Interestingly, the aromatic ring A of febuxostat almost overlaid the unsubstituted techtochrysin's B ring, however, the nitrile group at its 3-position whilst retaining the hydrophobic character extended to form a strong hydrogen bond with the side-chain amide of ASN768 (Fig. 5D and S2,† Table 3). Although this asparagine residue is located away from the active center for direct participation in substrate recognition or catalytic activity, the nitrile group of febuxostat was essential for potent XO inhibitory activity.56 Meanwhile, a bulky hydrophobic isobutoxy group at position 4 efficiently filled the remaining available lipophilic space within the channel and was also crucial for tight XO binding.56 This could explain the relatively higher potency of febuxostat versus techtochrysin in the cell-free assay (Table 5). Furthermore, these observations implied that the unsubstituted pattern at C-3′ and C-4′ of techtochrysin is not sufficient for optimal XO inhibition and characterized ring B's key pharmacophores likely to impart higher binding affinity towards XO that would be of great importance in guiding the future optimization of techtochrysin as a potential XO inhibitor. Firstly, increasing the bulkiness at the unsubstituted C-3′-position of techtochrysin by adding an isobutoxy group, mimicking the overlaid C-4 in febuxostat's ring A, should improve its XO binding affinity (Fig. 5C). However, the situation regarding the techtochrysin's C-4′ is quite dissimilar; it adopted a slightly different conformation compared with the nitrile-substituted C-3 in febuxostat's ring A (Fig. 5C). Due to its linear geometry, the nitrile substituent projected into a narrow hydrophobic subpocket/cleft and formed a hydrogen bond in a sterically congested environment (Fig. 5C and D). Despite the imperfect overlay between C-3 and C-4′ of febuxostat and techtochrysin, respectively, introducing a nitrile group at techtochrysin's C-4′ would still be a valid strategy to enhance the XO binding affinity due to the dynamic flexibility of active site.57 To mimic this, a second possible direction for future optimization of techtochrysin as a novel XO inhibitor can be implemented by introducing a small hydrophobic angular substituent, such as methoxy group, at C-4′ to efficiently fill the XO hydrophobic subpocket, where the nitrile group resides, whilst retaining the hydrogen bond acceptor property to engage in a hydrogen bond with ASN768. The small lipophilic subpocket could still be able to accommodate this methoxy group with a small conformational shift due to the plasticity of the protein in molding the Mo-pt center to the shape of the ligand in the binding site,58 and yet the XO inhibitory effect might be improved by fine-tuning modifications at 4′-position. Future optimization in the aforementioned directions is predicted to improve the techtochrysin's binding affinity, drug-likeness, and its subsequent XO inhibitory potential.
Compared with the well-reputed XO inhibitor; allopurinol, techtochrysin demonstrated 10-folds enhancement in the XO inhibitory activity in the implemented enzymatic assay (Table 5, Fig. 4). It is important to highlight that allopurinol is a potent suicide XO inhibitor; it will be further hydroxylated by the enzyme to provide the actual potent XO inhibitor namely, oxipurinol.59 Therefore, oxipurinol has been docked into the XO protein (PDB ID 3NVY, Fig. 5E) and overlaid with techtochrysin within the binding site (Fig. 5F). As expected, oxipurinol coordinated directly and bound tightly to the reduced molybdenum ion of the enzyme (Mo(IV)). In contrast, techtochrysin fitted well into the substrate-binding channel of the enzyme whilst not forming any interaction with the molybdenum metal atom. Therefore, it has been proposed that techtochrysin and allopurinol have different binding modes that are, structure-based and mechanism-based, respectively. In other words, techtochrysin could hinder the approach of the substrate toward Mo-pterin domain and eventually prevent its oxidation to uric acid. Importantly, this overlay study implied a kind of cooperativity between techtochrysin and allopurinol in modulating the catalytic activity of XO if used together and opened a new direction to assess this hypothesis virtually through sequential docking of the two inhibitors (Fig. 6A). Interestingly, allopurinol and techtochrysin maintained their binding poses and fitted cooperatively within the binding site of XO, which may suggest both structure- and mechanism-based inhibition of catalysis if both compounds were used in combination settings. The proposed hypothesis was also tested for febuxostat along with techtochrysin (Fig. 6B). Due to the plasticity of the protein, the two compounds were able to amazingly fit within the XO active site and nearly no open space was left in the channel after their binding. Such promising virtual cooperativity provided substantive guidance to further evaluate this hypothesis through MD simulation studies (Section 3.3) and in biochemical settings using combination analysis studies (Section 3.4).
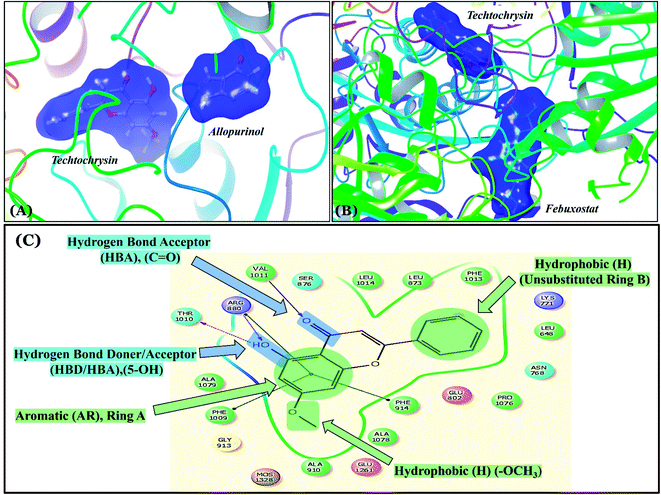 | ||
| Fig. 6 (A) Sequential docking of allopurinol and techtochrysin at the XO binding site (PDB ID 3NVY). (B) Sequential docking of febuxostat and techtochrysin at the XO active site. (C) 2D techtochrysin/XO active site's amino acid residues interactions diagram summarizing the observed structure–activity relationship studies (SARs) of techtochrysin (i.e. flavonoid class) for effective XO inhibition. | ||
The present study intuitively demonstrated that the two tested phenolic acids rosmarinic acid and isoferulic acid significantly suppressed the formation of uric acid catalyzed by XO in a dose-dependent manner. Their IC50 values indicated that rosmarinic acid possessed a strong inhibitory activity (IC50 = 0.97 ± 0.042 μM) on XO than isoferulic acid (IC50 = 3.23 ± 0.083 μM). This obvious potency difference might be attributed to the number of free hydroxyl moieties on the benzene rings60 as shown in their chemical structures (Table 3). SARs for the tested phenolic acids in this study have been summarized in Fig. S7.† Rosmarinic acid bears four hydroxyl groups on the benzene rings that appeared to promote the XO inhibitory activity via the formation of multiple hydrogen bond interactions with active site residues of the enzyme and subsequently hindered substrate linkage in (Mo-pt) active site, while isoferulic acid carries only one hydroxyl group. Even though rosmarinic acid exhibited high IC50 relative to febuxostat (IC50 = 0.02 ± 0.003) yet its inhibitory activity was comparable to that of allopurinol (IC50 = 0.82 ± 0.041) as presented in (Table 5).
Collectively, the in silico binding studies presented herein offered an efficient basis for the structure-based design of novel XO inhibitors. These results could be an inspiration for further investigation of potential XO inhibitors derived from Egyptian propolis. From the above experimental findings together with in silico results, we suggested that both techtochrysin and rosmarinic acid could be adopted as potential hits for the development of novel naturally derived therapeutics for the treatment of hyperuricemia. However, further studies are needed to claim these candidates for clinical investigation.
3.3. Molecular dynamics simulations
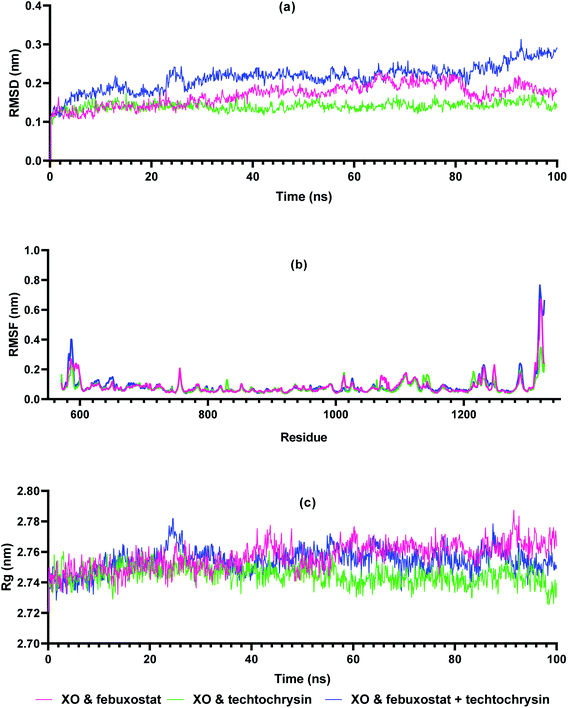
Molecular dynamics simulations are very useful in drug discovery phases to predict the stability of protein-ligand complexes in the in silico physiological environment.61 In this study, the stability of febuxostat, techtochrysin, and their combination with XO was investigated using MD simulation. Input files for MD simulation of enzyme ligand complexes obtained from Glide XP were created using amber FF19SB via CHARMM-GUI FF-Converter. MD simulation of 100 ns duration was performed for each complex. Trajectory RMSD, RMSF, and Rg analyses were made and binding free energy calculations were acquired.The RMSD measurement in MD simulations is the main parameter that provides information about protein stability and deviation.62 The stability of the RMSD graph after the pre-stage MD simulation indicates that the system is stabilizing. As shown in Fig. 7a, XO-febuxostat, XO-techtochrysin, and XO-febuxostat + techtochrysin complexes remained below 0.3 nm, and mean RMSD values of 0.16 nm, 0.14 nm, and 0.21 nm were measured for the three investigated complexes, respectively. RMSF measurements are another parameter that provides information about protein fluctuation and conformational changes.63 As seen in Fig. 7b, RMSF values fluctuated below 0.3 nm for all three complexes except for the N- and C-terminals of XO. Another parameter, Rg, provides information on protein-ligand compactness.64 A low and stable Rg value indicates the stability of the protein–ligand complex. As shown in Fig. 7c, XO-febuxostat, XO-techtochrysin, and XO-febuxostat + techtochrysin complexes remained stable between 2.74 and 2.78 nm, measuring 2.76 nm, 2.74 nm, and 2.75 nm on average for the three complexes, respectively.
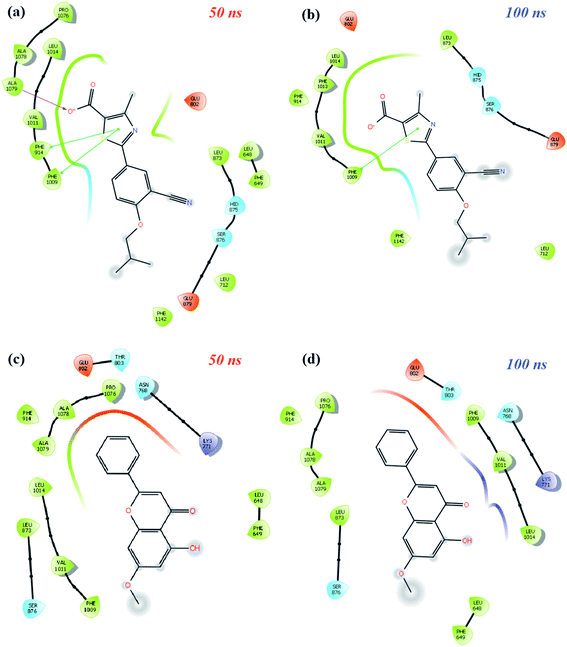
MD simulation animations of 100 snapshots between 0 and 100 ns were created as provided in ESI 3† to analyze and compare the stability of XO-febuxostat, XO-techtochrysin, and XO-febuxostat + techtochrysin protein–ligand complexes. In addition, XO-febuxostat and XO-techtochrysin protein–ligand interactions at 50 and 100 ns are shown in Fig. 8, while XO & febuxostat + techtochrysin protein–ligand interactions are provided in Fig. 9.
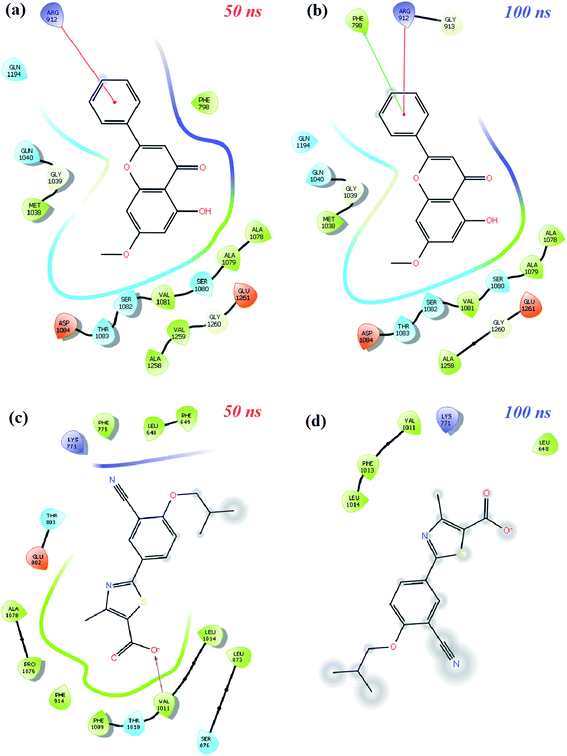 | ||
| Fig. 9 Schematic protein–ligand 2D interactions of (a and b) techtochrysin (0.47) and (c and d) febuxostat (0.99) at 50 ns and 100 ns in the XO-febuxostat + techtochrysin enzyme ligand complex. | ||
As shown in Fig. 8a and b, the pi–pi stacking interaction with the 50 and 100 ns PHE1009 of XO-febuxostat complex MD simulation was preserved and remained stable. As shown in Fig. S8a,† the RMSD value for the XO-febuxostat complex was measured below 0.20 nm with an average of 0.091 nm during the 100 ns MD simulation of febuxostat. Meanwhile, as shown in Fig. 8c and d, the hydrophobic interactions with PHE1009, VAL1011, LEU1014, ASN768, and LYS711 have been maintained in the XO-techtochrysin complex, while the ligand remained stable as well. Interestingly, the RMSD value of techtochrysin was calculated in the XO-techtochrysin complex to be below 0.08 nm with a mean of 0.056 nm, implying a more stable system when compared with the XO-febuxostat complex, highlighting the potential of techtochrysin as a promising hit (Fig. S8b†).
Finally, protein–ligand interactions in the XO-febuxostat + techtochrysin complex were analyzed. As shown in Fig. 9a and b, the techtochrysin's pi–cation interaction with ARG912 and hydrophobic interaction with PHE798 remained stable. In addition, the hydrophobic interactions exerted by febuxostat with LEU648, LYS771, VAL1011, PHE1013, and LUE1014 have been preserved (Fig. 9c and d). As shown in Fig. S8c,† RMSD values of techtochrysin and febuxostat in the XO-febuxostat + techtochrysin complex were calculated as an average of 0.047 nm and 0.099 nm, respectively.
Another important feature of MD simulation studies is that they are useful to measure the binding free energy between the protein and its ligand depending on time.65 Binding free energy is usually obtained from the energy of the MM-PBSA protein–ligand complex, subtracting the total energy of the protein and ligand and the sum of the van der Waals, electrostatic, polar solvation, and SASA energies. In this study, MM-PBSA measurements of XO-febuxostat, XO-techtochrysin, and XO-febuxostat + techtochrysin complexes were performed using frames between 60 ns and 80 ns, taking into account the fluctuations in the RMSD graph. As shown in Table 6, the binding free energies of XO-febuxostat, XO-techtochrysin and XO-febuxostat + techtochrysin complexes were measured as −64.827 ± 12.697 kJ mol−1, −70.160 ± 10.891 kJ mol−1 and −160.158 ± 18.514 kJ mol−1, respectively. Accordingly, techtochrysin has a higher MM-PBSA value than febuxostat, and the combined use of febuxostat + techtochrysin has higher binding free energy than the sum of the febuxostat and techtochrysin complexes separately. It is interesting to note that the results of MD simulation studies corroborated the techtochrysin/febuxostat cooperative binding hypothesis and clearly demonstrated that the combined use of techtochrysin and febuxostat could bind to XO more potently than either febuxostat or techtochrysin alone conferring an increased stabilization of the system.
| Parameters Energy (kJ mol−1) | Enzyme–ligand complexes | ||
|---|---|---|---|
| XO febuxostat | XO techtochrysin | XO febuxostat + techtochrysin | |
| van der Waals | −130.579 ± 8.794 | −116.160 ± 8.808 | −305.083 ± 17.785 |
| Electrostatic | −4.010 ± 5.965 | −29.914 ± 7.183 | −41.452 ± 12.930 |
| Polar solvation | 85.946 ± 15.337 | 89.942 ± 9.335 | 215.747 ± 15.410 |
| SASA | −16.184 ± 0.933 | −14.028 ± 0.778 | −29.371 ± 1.458 |
| Binding free | −64.827 ± 12.697 | −70.160 ± 10.891 | −160.158 ± 18.514 |
3.4. Study of synergistic inhibitory activity on XO
Computational approaches and screening technologies have evolved substantially over time and facilitated analysis of experimental combination data to evaluate the nature and extent of drug–drug interaction, i.e., synergistic, additive or antagonistic.43 Owing to the distinct XO inhibitory activity of Egyptian propolis-derived constituents; techtochrysin and rosmarinic acid, they were forwarded to combination analysis with each of allopurinol and febuxostat aimed at exploiting natural products more effectively in combination therapy to minimize the untoward side-effects of synthetic drugs while retaining the therapeutic efficacy as well as searching for the best synergistic drug combinations. For this purpose, we evaluated the nature of techtochrysin and rosmarinic acid interactions each with both febuxostat and allopurinol against XO.In the median-effect plot, Dm (analogous to the EC50) represented the half-maximum effective concentration required to produce 50% enzymatic activity reduction and could be calculated as the antilog of the x-intercept as illustrated in (eqn (2′)), m is the slope and r-value is the linear regression correlation coefficient of the median-effect plot.
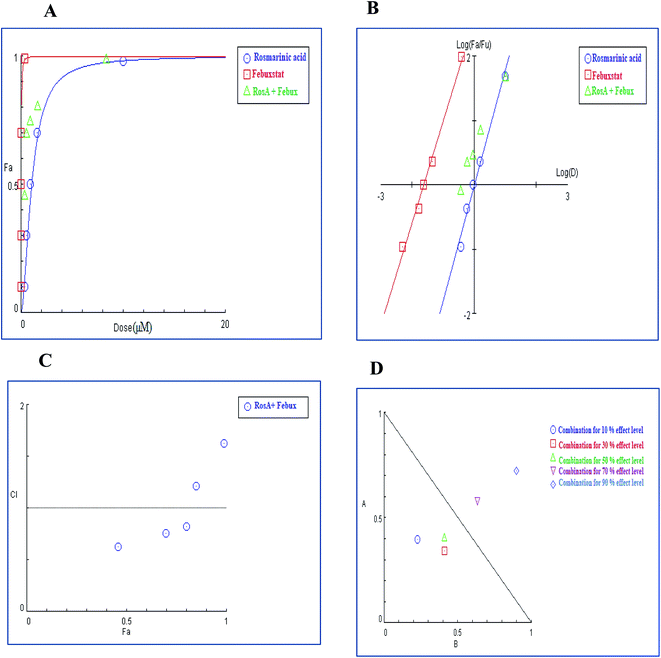
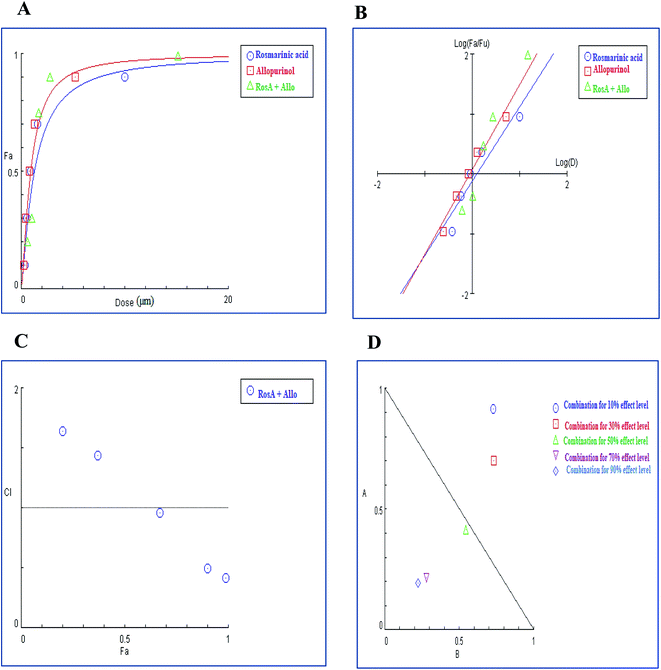
As shown in Table 7, Dm values for techtochrysin and rosmarinic acid when combined with febuxostat were lower than the expected additive effect of each individual agent indicating a moderate degree of synergy at a 50% effect level. Whereas allopurinol displayed Dm values for combinations approached the average sum of each individual agent effect, indicating additive effect at 50% effect level.
| Drug | Dose-effect curve parameters | ||
|---|---|---|---|
| Dm (μM) | m | r | |
| a The parameters Dm, m and r are the antilog of x-intercept, the slope and the linear correlation coefficient of the median-effect plot, respectively which signifies the shape of the dose-effect curve. CompuSyn software was used for automated calculations. | |||
| Techtochrysin | 0.081 | 1.73 | 0.98 |
| Rosmarinic acid | 1.042 | 1.78 | 0.99 |
| Allopurinol | 0.88 | 1.44 | 0.98 |
| Febuxostat | 0.022 | 1.57 | 0.99 |
| Techtochrysin + allopurinol | 0.89 | 1.21 | 0.98 |
| Techtochrysin + febuxostat | 0.032 | 1.12 | 0.99 |
| Rosmarinic acid + allopurinol | 0.93 | 1.42 | 0.98 |
| Rosmarinic acid + febuxostat | 0.45 | 1.13 | 0.98 |
In brief, Dm values for a single entity and their binary combinations were served as a universal reference point used for predicting synergism or antagonism at different effect levels based on CI eqn (3) and generating combination index (CI) plot.45 (r-value) was >0.97 in all cases, indicating the conformity of the data to the median-effect principle (Table 7).
3.4.2.1. Combination analysis of techtochrysin with each febuxostat and allopurinol. The combination of techtochrysin with either allopurinol or febuxostat significantly diminished the enzymatic activity compared to single component treatment. Over the full range of drug effect levels, the techtochrysin and febuxostat interactions were universally synergistic at lower effect levels.
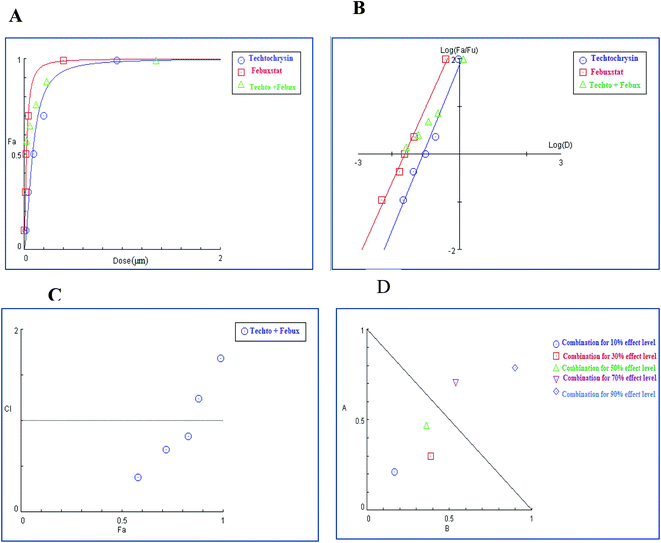
In the binary combination of techtochrysin and febuxostat, the combination data points at 10%, 30% and 50% effect levels were on the synergy side (CI < 1) (Fig. 10C) indicating that the XO inhibition was markedly enhanced when techtochrysin was combined with febuxostat at low doses as summarized in Table 8.
| (Fa × 100)% (XO) inhibition of the combined drugs | CI values | Dose (μM) techtochrysin | Dose (μM) febuxostat | DRI techtochrysin | DRI febuxostat |
|---|---|---|---|---|---|
| a CI < 0.9, (0.9–1.1), and >1.1 indicate synergism (Syn), additive effect (Add), and antagonism (Ant), respectively. Fa signifies fraction affected. DRI > 1 indicates favourable dose reduction (in fold) for the drug in combination. | |||||
| 53% | 0.39 (Syn) | 0.11 | 0.027 | 4.82 | 5.40 |
| 69% | 0.61 (Syn) | 0.20 | 0.044 | 4.54 | 2.59 |
| 75% | 0.76 (Syn) | 0.25 | 0.054 | 3.06 | 2.27 |
| 84% | 1.26 (Ant) | 0.39 | 0.081 | 1.42 | 1.77 |
| 94% | 1.58 (Ant) | 0.96 | 0.17 | 1.09 | 1.49 |
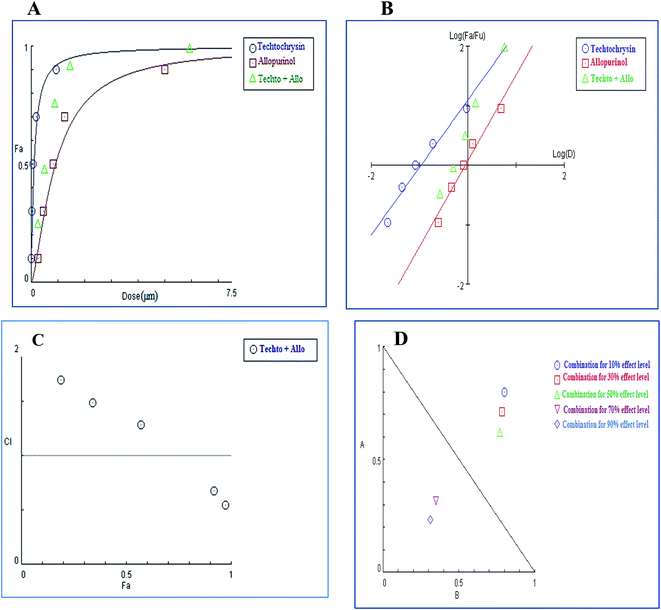
Isobolographic analysis, which graphically represented changes in the extent of interaction as a function of techtochrysin and febuxostat concentrations confirmed that at an effect level lower than 70% inhibition, the combination data points were located below the line of additivity indicating synergism (Fig. 10D). Whereas, at 70% and 90% effect level, the combination data points set above the additivity line of indicating that techtochrysin and febuxostat in higher doses produced a lower effect in combination than the expected from additivity and could be directly interpreted as antagonism (Fig. 10D).
Furthermore, our dose reduction index (DRI) analysis (Table 8) demonstrated that a decline of enzymatic activity by 53%, required 0.11 μM techtochrysin or 0.027 μM febuxostat. However, a combination of techtochrysin and febuxostat diminished their concentrations by 4.82 and 5.40-folds, respectively, (i.e. 0.024 μM techtochrysin + 0.005 μM febuxostat) to achieve the same enzymatic activity reduction. These findings clearly recommend the combination of techtochrysin and febuxostat as excellent candidates for further clinical studies as they provided better therapeutic effect with better safety profile due to the lower dose needed from each individual agent in the combination treatment.
In contrast to the remarkable synergistic effect of lower dose levels of both techtochrysin and febuxostat on XO inhibition, maximal synergy could be seen from higher dose levels of techtochrysin-allopurinol combination treatment, which produced a higher magnitude of enzymatic activity reduction (Table 9). At 70% and 90% effect levels, the combination data points were below the diagonal line of additivity in dose-normalized isobologram (Fig. 11D) with CI 0.69 and 0.53, respectively, as shown in Table 9. Additionally, the dose requirements for allopurinol decreased by 2.36-fold to achieve 70% XO inhibition as a read-out for synergy. This reduction in drug dose level, also referred to as the dose reduction index (DRI), was markedly obvious at the 90% effect level at which the allopurinol dose was reduced up to 3.92-fold (Table 9).
| (Fa × 100)% (XO) inhibition of the combined drugs | CI values | Dose (μM) techtochrysin | Dose (μM) allopurinol | DRI techtochrysin | DRI allopurinol |
|---|---|---|---|---|---|
| a CI < 0.9, (0.9–1.1), and >1.1 indicate synergism (Syn), additive effect (Add), and antagonism (Ant), respectively. Fa signifies fraction affected. DRI > 1 indicates favourable dose reduction (in fold) for the combination. | |||||
| 19% | 1.69 (Ant) | 0.031 | 0.29 | 1.32 | 1.06 |
| 35% | 1.48 (Ant) | 0.064 | 0.54 | 1.39 | 1.29 |
| 57% | 1.28 (Ant) | 0.15 | 1.13 | 1.78 | 1.38 |
| 91% | 0.69 (Syn) | 0.98 | 5.76 | 3.51 | 2.36 |
| 97% | 0.53 (Syn) | 3.19 | 15.91 | 3.63 | 3.92 |
3.4.2.2. Combination analysis of rosmarinic acid with each of febuxostat and allopurinol. Meanwhile, the results shown in Table 10 revealed that the combination treatment of rosmarinic acid and febuxostat synergistically diminished XO activity with favorable dose reduction compared to individual compound treatment. Combination analysis demonstrated that the CI values at 10%, 30% and 50% effect levels are consistently below 1, indicating synergy (Table 10) and subsequently, their corresponding combination data points were located below the line of additivity in the isobologram (Fig. 12D) whereas the combination index at 70% and 90% inhibition effect levels (Fig. 12C) readily represented moderate antagonism with IC values of 1.31 and 1.69, respectively (Table 10).
| (Fa × 100)% (XO) inhibition of the combined drugs | CI values | Dose (μM) rosmarinic acid | Dose (μM) febuxostat | DRI rosmarinic acid | DRI febuxostat |
|---|---|---|---|---|---|
| a CI < 0.9, (0.9–1.1), and >1.1 indicate synergism (Syn), additive effect (Add), and antagonism (Ant), respectively. Fa signifies fraction affected. DRI > 1 indicates favourable dose reduction (in fold) for the drug in combination. | |||||
| 42% | 0.56 (Syn) | 0.87 | 0.02 | 3.13 | 4.04 |
| 66% | 0.68 (Syn) | 1.78 | 0.041 | 3.72 | 2.42 |
| 74% | 0.85 (Syn) | 2.35 | 0.054 | 2.42 | 2.25 |
| 82% | 1.31 (Ant) | 3.42 | 0.078 | 1.46 | 1.70 |
| 92% | 1.69 (Ant) | 6.21 | 0.14 | 1.18 | 1.17 |
Our experimental data suggested that the combination of rosmarinic acid and febuxostat at low dose levels displayed a better synergistic effect than at high doses. This fact pointed out that the synergistic interactions might be weakened and even converted into antagonistic interactions with a higher dose, then bringing about undesirable adverse effects. In the same context, rosmarinic acid and allopurinol cooperated synergistically at high dose levels yielding XO inhibition that was greater than the expected inhibition achieved by either agent alone (Table 11).
| (Fa × 100)% (XO) inhibition of the combined drugs | CI values | Dose (μM) rosmarinic acid | Dose (μM) allopurinol | DRI rosmarinic acid | DRI allopurinol |
|---|---|---|---|---|---|
| a CI < 0.9, (0.9–1.1), and >1.1 indicate synergism (Syn), additive effect (Add), and antagonism (Ant), respectively. Fa signifies fraction affected. DRI > 1 indicates favourable dose reduction (in fold) for the drug in combination. | |||||
| 16% | 1.66 (Ant) | 0.32 | 0.23 | 1.14 | 1.28 |
| 34% | 1.43 (Ant) | 0.72 | 0.54 | 1.49 | 1.29 |
| 69% | 0.96 (Add) | 2.06 | 1.61 | 2.12 | 1.96 |
| 93% | 0.56 (Syn) | 8.35 | 6.80 | 3.42 | 3.70 |
| 98% | 0.47 (Syn) | 21.32 | 17.89 | 4.08 | 4.41 |
Isobologram demonstrated a stark reduction of the allopurinol dose when used with rosmarinic acid to induce even 50% inhibition or greater (Fig. 13D). In combination, allopurinol could be used at a concentration 4.41-fold less compared to its single-use to inhibit XO by 98% (Table 11). This observation agreed with data from CI plots showing antagonism below 50% inhibition level and synergy above 50% effect level (Fig. 13C). The calculated CI value at 50% effect level was 0.96 and its corresponding combination data point was located around the horizontal line of additivity in the CI-plot (Fig. 13C). The separation of the experimental points in the CI-plot was consistent with that in the isobologram. Briefly, CI decreased with increasing effect levels, indicating the enhancement of the extent of synergy at higher effect levels.
The multiple-ratio analysis elicited a broad range of the inhibitory effect level [e.g., ranging from less than 10% to greater than 90% inhibition of XO). Among the full range of 25 combinations, calculated CI values (<0.9) indicated that the combination of febuxostat and techtochrysin at the effect level 50% or lower provided the maximal synergistic effect (Table 12) Notably, the molar concentration ratios (1![[thin space (1/6-em)]](https://www.rsc.org/images/entities/char_2009.gif) :
:![[thin space (1/6-em)]](https://www.rsc.org/images/entities/char_2009.gif) 2.1 and 1
2.1 and 1![[thin space (1/6-em)]](https://www.rsc.org/images/entities/char_2009.gif) :
:![[thin space (1/6-em)]](https://www.rsc.org/images/entities/char_2009.gif) 4.2 (IC50
4.2 (IC50![[thin space (1/6-em)]](https://www.rsc.org/images/entities/char_2009.gif) :
:![[thin space (1/6-em)]](https://www.rsc.org/images/entities/char_2009.gif) IC50 ratio)) that contained higher relative amounts of febuxostat displayed lower synergy compared with that of lower febuxostat doses (1
IC50 ratio)) that contained higher relative amounts of febuxostat displayed lower synergy compared with that of lower febuxostat doses (1![[thin space (1/6-em)]](https://www.rsc.org/images/entities/char_2009.gif) :
:![[thin space (1/6-em)]](https://www.rsc.org/images/entities/char_2009.gif) 8.4, 1
8.4, 1![[thin space (1/6-em)]](https://www.rsc.org/images/entities/char_2009.gif) :
:![[thin space (1/6-em)]](https://www.rsc.org/images/entities/char_2009.gif) 16.8, and 1
16.8, and 1![[thin space (1/6-em)]](https://www.rsc.org/images/entities/char_2009.gif) :
:![[thin space (1/6-em)]](https://www.rsc.org/images/entities/char_2009.gif) 33.6), which yielded good synergistic effect especially at lower effect levels. Additionally, the required dose levels of febuxostat in the combination are substantially reduced as techtochrysin dose levels increase. This decline in dose level also referred to as dose reduction index (DRI) (Table 12) might be most relevant for gout treatment.
33.6), which yielded good synergistic effect especially at lower effect levels. Additionally, the required dose levels of febuxostat in the combination are substantially reduced as techtochrysin dose levels increase. This decline in dose level also referred to as dose reduction index (DRI) (Table 12) might be most relevant for gout treatment.
a The molar febuxostat–techtochrysin ratios 1![[thin space (1/6-em)]](https://www.rsc.org/images/entities/char_2009.gif) : :![[thin space (1/6-em)]](https://www.rsc.org/images/entities/char_2009.gif) 2.1, 1 2.1, 1![[thin space (1/6-em)]](https://www.rsc.org/images/entities/char_2009.gif) : :![[thin space (1/6-em)]](https://www.rsc.org/images/entities/char_2009.gif) 4.2 (IC50 4.2 (IC50![[thin space (1/6-em)]](https://www.rsc.org/images/entities/char_2009.gif) : :![[thin space (1/6-em)]](https://www.rsc.org/images/entities/char_2009.gif) IC50 ratio), 1 IC50 ratio), 1![[thin space (1/6-em)]](https://www.rsc.org/images/entities/char_2009.gif) : :![[thin space (1/6-em)]](https://www.rsc.org/images/entities/char_2009.gif) 8.4, 1 8.4, 1![[thin space (1/6-em)]](https://www.rsc.org/images/entities/char_2009.gif) : :![[thin space (1/6-em)]](https://www.rsc.org/images/entities/char_2009.gif) 16.8, and 1 16.8, and 1![[thin space (1/6-em)]](https://www.rsc.org/images/entities/char_2009.gif) : :![[thin space (1/6-em)]](https://www.rsc.org/images/entities/char_2009.gif) 33.6 are indicated in pink, green (IC50 33.6 are indicated in pink, green (IC50![[thin space (1/6-em)]](https://www.rsc.org/images/entities/char_2009.gif) : :![[thin space (1/6-em)]](https://www.rsc.org/images/entities/char_2009.gif) IC50 ratio), red, orange and grey, respectively. IC50 ratio), red, orange and grey, respectively. |
|---|
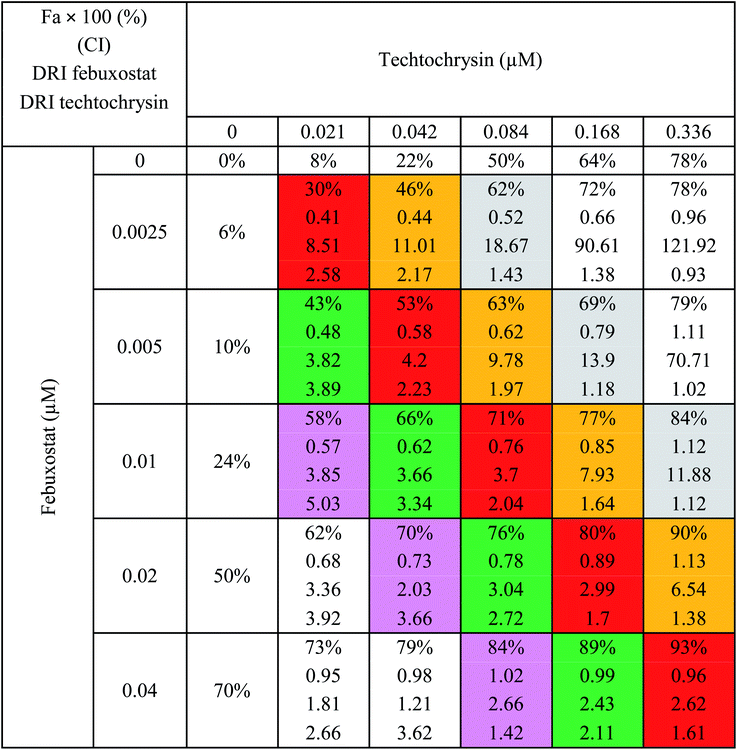 |
Further supportive evidence for the synergistic action of these ratios was obtained from curve-shift analyses, which readily circumvented the interaction analysis across the entire spectrum of effect levels and statistically estimated the effect deviation of combined agents from additivity. Curve-shift analysis pointed out that all concentration-effect curves for different techtochrysin and febuxostat ratio combinations were situated to the left of the curves for the two individual drugs. Furthermore, pronounced lower IC50 equivalents of the combination compared with IC50 values of single drugs alone were observed as a read-out of synergy (Fig. 14). The IC50 equivalents ranged from 0.2 to 0.82 μM for all combination ratios at 50% effect level with the corresponding extent of synergy ranging from approximately 1.5 to 8-fold leftward shifts along the x-axis in the curve-shift plot at this level (Fig. 14).
The data presented herein outlined that the febuxostat plus techtochrysin combination at molar concentration ratios (1![[thin space (1/6-em)]](https://www.rsc.org/images/entities/char_2009.gif) :
:![[thin space (1/6-em)]](https://www.rsc.org/images/entities/char_2009.gif) 8.4, 1
8.4, 1![[thin space (1/6-em)]](https://www.rsc.org/images/entities/char_2009.gif) :
:![[thin space (1/6-em)]](https://www.rsc.org/images/entities/char_2009.gif) 16.8, and 1
16.8, and 1![[thin space (1/6-em)]](https://www.rsc.org/images/entities/char_2009.gif) :
:![[thin space (1/6-em)]](https://www.rsc.org/images/entities/char_2009.gif) 33.6) at lower effect levels were particularly effective with prominent XO inhibitory activity and simultaneous lower toxicity profile compared to those of the single drugs. It is also important to highlight that the results of the in vitro combination analysis studies matched very well with the outcomes of the molecular docking studies and MD simulations (Sections 3.1 and 3.3) and validated these computer-directed studies.
33.6) at lower effect levels were particularly effective with prominent XO inhibitory activity and simultaneous lower toxicity profile compared to those of the single drugs. It is also important to highlight that the results of the in vitro combination analysis studies matched very well with the outcomes of the molecular docking studies and MD simulations (Sections 3.1 and 3.3) and validated these computer-directed studies.
4. Conclusion
In summary, Egyptian propolis-derived bioactive primarily techtochrysin and rosmarinic acid were found to be the most promising XO inhibitory hits for further development. Docking and MD simulations provided putative binding modes within the XO active site, which could intuitively illustrate the postulated potential observed for techtochrysin and rosmarinic acid on XO catalysis. A cooperative binding mode has been proposed between techtochrysin and standard XO inhibitors such as febuxostat and this cooperativity was supported by MD simulation studies. Future fluorescence spectroscopic studies and circular dichroism analysis should be conducted to provide additional insights on conformational changes in XO structure upon techtochrysin binding. Additionally, the combination of techtochrysin and rosmarinic acid with each of febuxostat and allopurinol synergistically inhibited XO activity with favorable dose reduction of synthetic drugs. Besides, the optimization of dose ratios in the investigated combination regimens has been conducted. However, further in vivo studies are required to confirm the superior activity of the proposed combination and consider its influence on blood biochemistry profile as well as at the histological and molecular levels, thus revealing its therapeutic mechanism in hyperuricemia and gout at the overall level.Author contributions
Dina S. Ghallab: carrying out the experiments and writing the manuscript, E-mail: dodoghalab3@gmail.com; ; Eman Shawky: designing the experiments and manuscript revision, shawkyeman@yahoo.com; ; Ali M. Metwally: suggesting point and manuscript revision, alymmetwally@yahoo.com; ; Ismail Celik: performing and writing the molecular dynamic simulation. Reham S. Ibrahim: analysis of data and manuscript revision, rehamsaid84@yahoo.com; ; Mohamed M. Mohyeldin: analysis of data and manuscript revision, mo7yee@hotmail.com.Conflicts of interest
We wish to confirm that there are no known conflicts of interest associated with this publication and there has been no significant financial support for this work that could have influenced its outcome.Acknowledgements
All molecular dynamics simulations reported were performed utilizing TÜBİTAK (The Scientific and Technological Research Council of Turkey), ULAKBİM (The Turkish Academic Network and Information Center), and High Performance and Grid Computing Center (TRUBA resources).References
- A. Šmelcerović, K. Tomović, Ž. Šmelcerović, Ž. Petronijević, G. Kocić, T. Tomašič, Ž. Jakopin and M. Anderluh, Eur. J. Med. Chem., 2017, 135, 491–516 CrossRef PubMed.
- J. Labat-Robert and L. Robert, Pathol. Biol., 2014, 62, 61–66 CrossRef CAS PubMed.
- R. Tanaka, Y. Miyata, N. Minakuchi, A. Murakami and F. Sakazaki, Yakugaku Zasshi, 2015, 135, 1169–1176 CrossRef CAS PubMed.
- C. Enroth, B. T. Eger, K. Okamoto, T. Nishino, T. Nishino and E. F. Pai, Proc. Natl. Acad. Sci. U. S. A., 2000, 97, 10723–10728 CrossRef CAS PubMed.
- H. K. Choi, D. B. Mount and A. M. Reginato, Ann. Intern. Med., 2005, 143, 499–516 CrossRef CAS PubMed.
- P. Zhao, K. Chen, G. Zhang, G. Deng and J. Li, J. Evidence-Based Complementary Altern. Med., 2017 DOI:10.1155/2017/2103254.
- P. Richette, A. Frazier and T. Bardin, Curr. Opin. Rheumatol., 2015, 27, 170–174 CrossRef CAS PubMed.
- E. Fadillioglu, Z. Kurcer, H. Parlakpinar, M. Iraz and C. Gursul, Arch. Pharmacal Res., 2008, 31, 705–712 CrossRef CAS PubMed.
- P. A. L. Pacher, A. Nivorozhkin and C. Szabó, Pharmacol. Rev., 2006, 58, 87–114 CrossRef CAS PubMed.
- P. A. L. Pacher, A. Nivorozhkin and C. Szabó, Pharmacol. Rev., 2006, 58, 87–114 CrossRef CAS PubMed.
- A. Jordan and U. Gresser, Pharmaceuticals, 2018, 11, 51 CrossRef PubMed.
- A. Jordan and U. Gresser, Pharmaceuticals, 2018, 11, 51 CrossRef PubMed.
- A. M. Abeles and M. H. Pillinger, ACR Open Rheumatology, 2019, 1, 343 CrossRef PubMed.
- S. Bogdanov, Bee Product Science, 2014, 1–40 Search PubMed.
- P. Ristivojević, J. Trifković, F. Andrić and D. Milojković-Opsenica, Nat. Prod. Commun., 2015, 10(11), 1869–1876 CrossRef.
- V. S. Bankova, S. S. Popov and N. L. Marekov, Phytochemistry, 1989, 28, 871–873 CrossRef CAS.
- B. Meyer, W. Schneider and E. F. Elstner, Arzneim. Forsch., 1995, 45, 174–176 CAS.
- B. Meyer, W. Schneider and E. F. Elstner, Arzneim. Forsch., 1995, 45, 174–176 CAS.
- N. Debbache, D. Atmani and D. Atmani, Ind. Crops Prod., 2014, 53, 85–92 CrossRef CAS.
- V. Bankova, Journal of ApiProduct and ApiMedical Science, 2009, 1, 23–28 CrossRef.
- A. G. Hegazi, A. S. El-Houssiny and E. A. Fouad, Adv. Nat. Sci.: Nanosci. Nanotechnol., 2019, 10, 45019 Search PubMed.
- E. Shawky and R. S. Ibrahim, J. Chromatogr. B: Anal. Technol. Biomed. Life Sci., 2018, 1095, 75–86 CrossRef CAS PubMed.
- N. Baltas, O. Yildiz and S. Kolayli, J. Enzyme Inhib. Med. Chem., 2016, 31, 52–55 CrossRef CAS PubMed.
- M. D. Santi, M. P. Zunini, B. Vera, C. Bouzidi, V. Dumontet, A. Abin-Carriquiry, R. Grougnet and M. G. Ortega, Eur. J. Med. Chem., 2018, 143, 577–582 CrossRef CAS PubMed.
- Y. Dong, H. Huang, M. Zhao, D. Sun-Waterhouse, L. Lin and C. Xiao, J. Funct. Foods, 2016, 24, 26–36 CrossRef CAS.
- E. Lionta, G. Spyrou, D. K. Vassilatis and Z. Cournia, Curr. Top. Med. Chem., 2014, 14, 1923–1938 CrossRef CAS PubMed.
- J. R. Pritchard, P. M. Bruno, L. A. Gilbert, K. L. Capron, D. A. Lauffenburger and M. T. Hemann, Proc. Natl. Acad. Sci. U. S. A., 2013, 110, E170–E179 CrossRef CAS PubMed.
- J. Foucquier and M. Guedj, Pharmacol. Res. Perspect., 2015, 3, e00149 CrossRef PubMed.
- J. Foucquier and M. Guedj, Pharmacol. Res. Perspect., 2015, 3, e00149 CrossRef PubMed.
- R. B. Mokhtari, T. S. Homayouni, N. Baluch, E. Morgatskaya, S. Kumar, B. Das and H. Yeger, Oncotarget, 2017, 8, 38022 CrossRef PubMed.
- B. Sillars, W. A. Davis, I. B. Hirsch and T. M. E. Davis, Diabetes, Obes. Metab., 2010, 12, 757–765 CrossRef CAS PubMed.
- N. Zeng, G. Zhang, X. Hu, J. Pan, Z. Zhou and D. Gong, J. Funct. Foods, 2018, 50, 172–182 CrossRef CAS.
- K. E. Hevener, W. Zhao, D. M. Ball, K. Babaoglu, J. Qi, S. W. White and R. E. Lee, J. Chem. Inf. Model., 2009, 49, 444–460 CrossRef CAS PubMed.
- M. J. Abraham, T. Murtola, R. Schulz, S. Páll, J. C. Smith, B. Hess and E. Lindahl, SoftwareX, 2015, 1–2, 19–25 CrossRef.
- S. Jo, T. Kim, V. G. Iyer and W. Im, J. Comput. Chem., 2008, 29, 1859–1865 CrossRef CAS PubMed.
- C. Tian, K. Kasavajhala, K. A. A. Belfon, L. Raguette, H. Huang, A. N. Migues, J. Bickel, Y. Wang, J. Pincay, Q. Wu and C. Simmerling, J. Chem. Theory Comput., 2020, 16, 528–552 CrossRef PubMed.
- D. J. Evans and B. L. Holian, J. Chem. Phys., 1985, 83, 4069–4074 CrossRef CAS.
- M. Parrinello and A. Rahman, J. Appl. Phys., 1981, 52, 7182–7190 CrossRef CAS.
- R. Kumari, R. Kumar and A. Lynn, J. Chem. Inf. Model., 2014, 54, 1951–1962 CrossRef CAS PubMed.
- L. Zhao, M. G. Wientjes and J. L. S. Au, Clin. Cancer Res., 2004, 10, 7994–8004 CrossRef CAS PubMed.
- L. Zhao, M. G. Wientjes and J. L. S. Au, Clin. Cancer Res., 2004, 10, 7994–8004 CrossRef CAS PubMed.
- T.-C. Chou, Pharmacol. Rev., 2006, 58, 621–681 CrossRef CAS PubMed.
- T.-C. Chou, Pharmacol. Rev., 2006, 58, 621–681 CrossRef CAS PubMed.
- I. Rodea-Palomares, A. L. Petre, K. Boltes, F. Leganés, J. A. Perdigón-Melón, R. Rosal and F. Fernández-Piñas, Water Res., 2010, 44, 427–438 CrossRef CAS PubMed.
- I. Rodea-Palomares, A. L. Petre, K. Boltes, F. Leganés, J. A. Perdigón-Melón, R. Rosal and F. Fernández-Piñas, Water Res., 2010, 44, 427–438 CrossRef CAS PubMed.
- J. Zhao, K. Kelnar and A. G. Bader, PLoS One, 2014, 9, e89105 CrossRef PubMed.
- J. Zhao, K. Kelnar and A. G. Bader, PLoS One, 2014, 9, e89105 CrossRef PubMed.
- L. Zhao, J. L.-S. Au and M. G. Wientjes, Front. Biosci., Elite Ed., 2010, 2, 241 Search PubMed.
- C. Enroth, B. T. Eger, K. Okamoto, T. Nishino, T. Nishino and E. F. Pai, Proc. Natl. Acad. Sci. U. S. A., 2000, 97, 10723–10728 CrossRef CAS PubMed.
- H. Cao, J. M. Pauff and R. Hille, J. Nat. Prod., 2014, 77, 1693–1699 CrossRef CAS PubMed.
- H. Cao, J. M. Pauff and R. Hille, J. Nat. Prod., 2014, 77, 1693–1699 CrossRef CAS PubMed.
- L. Fitria, M. H. Widyananda and S. P. Sakti, Journal of Smart Bioprospecting and Technology, 2019, 2686, 805 Search PubMed.
- L. Fitria, M. H. Widyananda and S. P. Sakti, Journal of Smart Bioprospecting and Technology, 2019, 2686, 805 Search PubMed.
- J. Yan, G. Zhang, Y. Hu and Y. Ma, Food Chem., 2013, 141, 3766–3773 CrossRef CAS PubMed.
- M. D. Santi, M. P. Zunini, B. Vera, C. Bouzidi, V. Dumontet, A. Abin-Carriquiry, R. Grougnet and M. G. Ortega, Eur. J. Med. Chem., 2018, 143, 577–582 CrossRef CAS PubMed.
- M. R. Ali, S. Kumar, O. Afzal, N. Shalmali, W. Ali, M. Sharma and S. Bawa, Arch. Pharm., 2017, 350, 1600313 CrossRef PubMed.
- D. Sato, T. Kisen, M. Kumagai and K. Ohta, Bioorg. Med. Chem., 2018, 26, 536–542 CrossRef CAS PubMed.
- D. Sato, T. Kisen, M. Kumagai and K. Ohta, Bioorg. Med. Chem., 2018, 26, 536–542 CrossRef CAS PubMed.
- J. Yun, J. Mattsson, K. Schnyder, S. Fontana, C. R. Largiadèr, W. J. Pichler and D. Yerly, Clin. Exp. Allergy, 2013, 43, 1246–1255 CrossRef CAS PubMed.
- W. Choi, V. Villegas, H. Istre, B. Heppler, N. Gonzalez, N. Brusman, L. Snider, E. Hogle, J. Tucker and A. Oñate, Bioorg. Chem., 2019, 86, 686–695 CrossRef CAS PubMed.
- H. Zhao and A. Caflisch, Eur. J. Med. Chem., 2015, 91, 4–14 CrossRef CAS PubMed.
- I. Celik, M. Erol and Z. Duzgun, Mol. Diversity, 2021 DOI:10.1007/s11030-021-10215-5.
- I. Celik, M. Erol and G. Kuyucuklu, New J. Chem., 2021, 45, 11108–11118 RSC.
- M. Erol, I. Celik, U. Ince, H. Fatullayev, E. Uzunhisarcikli and M. O. Puskullu, J. Biomol. Struct. Dyn., 2021, 1–15 CrossRef PubMed.
- N. Homeyer and H. Gohlke, Mol. Inf., 2012, 31, 114–122 CrossRef CAS PubMed.
Footnotes |
| † Electronic supplementary information (ESI) available. See DOI: 10.1039/d1ra08011c |
| ‡ Reham S. Ibrahim and Mohamed M. Mohyeldin contributed equally to the work. |
| This journal is © The Royal Society of Chemistry 2022 |


