 Open Access Article
Solvothermal synthesis of CeO2–ZrO2–M2O3 (M = La, Y, Bi) mixed oxide and their soot oxidation activity
Dong Zhang
School of Urban Construction and Environment, Dongguan City College, Dongguan, Guangdong 523419, People's Republic of China. E-mail: zhangdong_zhd@126.com
First published on 13th May 2022
Abstract
CeO2–ZrO2-M2O3 (M = La, Y, Bi) mixed oxide has been prepared by a solvothermal synthesis method. The physico–chemical properties of the mixed oxide have been studied by X-ray powder diffraction (XRD), Raman spectroscopy, BET, X-ray photoelectron spectroscopy (XPS), TEM and temperature-programmed reduction (TPR), and the catalytic activity for soot oxidation has been studied by thermogravimetry (TG). La3+, Y3+ and Bi3+ exhibit positive effects on lowering the oxidation temperature of the soot. The XRD and Raman results showed formation of mixed oxides and TEM images suggested the nanosized nature of the particles. The benefit of yttrium or lanthana doping on the catalytic activity of ceria can be related to active oxygen formation provoked by the defective structure of ceria due to the presence of La3+ and Y3+. The benefit of Bi3+ doping on catalytic activity can be related to the reduction at low temperature both with Bi2O3 and ceria.
1. Introduction
Particulate matter (PM) is one of the most serious pollutants emitted from diesel engines. It causes environmental problems as well as acute health problems in human beings.1,2 In recent years, strict regulations on particulate matter emissions have been established in many countries.3–5 It is an urgent task to clean PM from the diesel exhaust before it enters the air. In diesel particulate filters (DPFs), the trapped soot is oxidized by a catalyst that is coated on the DPF. As for the oxidation catalyst for soot combustion, the intrinsic redox properties of catalysts play an important role in getting high catalytic capabilities.6 Among the various kinds of oxidation catalysts, multi-component oxides, such as perovskite oxides,7,8 supported noble metals,9 and ceria-based mixed oxides,10–16 exhibit relatively high capabilities for soot combustion because of the good redox properties, oxygen storage releasing capacity and thermal stability.It has been reported that the CeO2-based catalysts work for soot oxidation by attempting to utilize active oxygen on the surface of CeO2.17 However, CeO2 has a poor thermal stability. Zirconium oxides are sometimes added to the catalysts to increase the surface area, thermal stability, and oxygen storage capacity (OSC) of ceria, resulting in superior catalytic properties.18 So far, considerable progress has been achieved in the synthesis of CeO2–ZrO2 mixed oxide. Although these properties have been improved by the ZrO2 addition, the lowest reduction temperature and the highest degree of reducibility are not enough to meet the regulations of the automotive exhaust gases. Up to now, many reports display the effect of trivalent dopants such as yttria, lanthana and Bi2O3 on the redox behavior of the CeO2–ZrO2 materials.19–27 Bueno-Lopez et al. prepared La3+ doped CeO2 catalysts with much better catalytic activity which is due to the increase of BET surface area and enhanced redox properties.19 Chen Yaoqiang et al. showed that Y3+ added into CeO2–ZrO2 with high oxygen storage capacity and large surface area.20 K. Minami et al. prepared CeO2–ZrO2–Bi2O3 solid solution which can release and store oxygen efficiently at lower temperatures (337 °C) because of the formation of oxygen vacancies to enhance the oxide anion mobility by substituting Ce4+ site with Bi3+.21 Krishna et al. showed that Tm of Ce0.9Pr0.1Ox is 419 °C.23
In this paper, Ceria was synthesized by a solvothermal synthesis method and subjected to thermal treatments at high temperature. The goal of the current study was to evaluate the catalytic efficiency of CeO2–ZrO2–La2O3, CeO2–ZrO2–Y2O3 and CeO2–ZrO2–Bi2O3 mixed oxide regarding soot oxidation and correlate this with the surface and structural properties of the catalysts. The synthesis nano-oxides were evaluated by using X-ray diffraction (XRD), transmission electron microscopy (TEM), BET surface area, X-ray photoelectron spectroscopy (XPS), Raman spectroscopy and temperature programmed reduction (TPR) techniques. The catalytic efficiency was evaluated for soot combustion by a thermogravimetric (TG) method. The molar ratio of CeO2![[thin space (1/6-em)]](https://www.rsc.org/images/entities/char_2009.gif) :
:![[thin space (1/6-em)]](https://www.rsc.org/images/entities/char_2009.gif) ZrO2 was 60
ZrO2 was 60![[thin space (1/6-em)]](https://www.rsc.org/images/entities/char_2009.gif) :
:![[thin space (1/6-em)]](https://www.rsc.org/images/entities/char_2009.gif) 40 and the molar ratio of CeO2
40 and the molar ratio of CeO2![[thin space (1/6-em)]](https://www.rsc.org/images/entities/char_2009.gif) :
:![[thin space (1/6-em)]](https://www.rsc.org/images/entities/char_2009.gif) ZrO2
ZrO2![[thin space (1/6-em)]](https://www.rsc.org/images/entities/char_2009.gif) :
:![[thin space (1/6-em)]](https://www.rsc.org/images/entities/char_2009.gif) M2O3 (M = La, Y, Bi) was adjusted to be 60
M2O3 (M = La, Y, Bi) was adjusted to be 60![[thin space (1/6-em)]](https://www.rsc.org/images/entities/char_2009.gif) :
:![[thin space (1/6-em)]](https://www.rsc.org/images/entities/char_2009.gif) 35
35![[thin space (1/6-em)]](https://www.rsc.org/images/entities/char_2009.gif) :
:![[thin space (1/6-em)]](https://www.rsc.org/images/entities/char_2009.gif) 5.19,27
5.19,27
2. Experimental
2.1 Catalyst preparation
The CeO2–ZrO2–M2O3 (M = La, Y, Bi) samples were prepared by a solvothermal synthesis method. In these samples, the molar ratio of CeO2–ZrO2–M2O3 (M = La, Y, Bi) was adjusted to be 60![[thin space (1/6-em)]](https://www.rsc.org/images/entities/char_2009.gif) :
:![[thin space (1/6-em)]](https://www.rsc.org/images/entities/char_2009.gif) 35
35![[thin space (1/6-em)]](https://www.rsc.org/images/entities/char_2009.gif) :
:![[thin space (1/6-em)]](https://www.rsc.org/images/entities/char_2009.gif) 5. In a typical synthesis, a solution of 1 mol L−1 Ce(NO3)3, 1 mol L−1 ZrOCl2·8H2O, and 0.1 mol L−1 La(NO3)3 aqueous solution was mixed together. Aqueous NH3 solution was added drop-wise to the mixture solution under vigorous stirring until the pH reached 10.0, which produced a yellow precipitate in the solution. After aging for 4 h, the obtained precipitate was filtered off and washed with deionized water until it was free from anion impurities. A purified yellow precipitate was then obtained. The obtained cake was redispersed in ethanol solvent and ultrasonically dispersed for 0.5 h. The resulting solvothermal precursor was transferred to a Teflon autoclave lined with Teflon, 70% filled and tightly closed, and then held at 150 °C for 5 h. After the solvothermal crystallization, the prepared CeO2–ZrO2–La2O3 was filtered and washed by ethanol again, then dried at 100 °C over night, and subsequently calcined at 500 °C for 4 h in air atmosphere.
5. In a typical synthesis, a solution of 1 mol L−1 Ce(NO3)3, 1 mol L−1 ZrOCl2·8H2O, and 0.1 mol L−1 La(NO3)3 aqueous solution was mixed together. Aqueous NH3 solution was added drop-wise to the mixture solution under vigorous stirring until the pH reached 10.0, which produced a yellow precipitate in the solution. After aging for 4 h, the obtained precipitate was filtered off and washed with deionized water until it was free from anion impurities. A purified yellow precipitate was then obtained. The obtained cake was redispersed in ethanol solvent and ultrasonically dispersed for 0.5 h. The resulting solvothermal precursor was transferred to a Teflon autoclave lined with Teflon, 70% filled and tightly closed, and then held at 150 °C for 5 h. After the solvothermal crystallization, the prepared CeO2–ZrO2–La2O3 was filtered and washed by ethanol again, then dried at 100 °C over night, and subsequently calcined at 500 °C for 4 h in air atmosphere.
2.2 Catalyst characterization
The specific surface area of the powders was measured by the BET method using an Autosorb-1-MP 1530VP. The samples were dehydrated in flowing dry nitrogen at 200 °C for 5 h before the adsorption measurement.X-ray powder diffraction (XRD) patterns were obtained with a D8 Advance operation at 40 kV and 40 mA with Cu Kα radiation and a goniometer speed of 8° min−1. The lattice constants were calculated based on Bragg's law and the crystal sizes were calculated based on Scherrer's equation with the (111) plane.
d = 0.089λ/[B(2θ)cos![[thin space (1/6-em)]](https://www.rsc.org/images/entities/char_2009.gif) θ] θ]
| (1) |
Raman spectra were recorded in a Renishaw Raman imaging microscope with a 20 mW Ar laser (514 nm). Transmission electron microscope (TEM) measurements of some samples were performed in a JEM-2010FEF electron microscope to check the crystal sizes of CeO2 mixed oxides.
X-ray photoelectron spectroscopy (XPS) measurements were carried out with PE PHI-1600 system and Mg-Kα (hv = 1253.6 eV) as X-ray source. The hemispherical analyzer functioned with constant pass energy 50 eV for high-resolution spectra. The binding energies were referenced to the C1s peak at 284.6 eV.
Temperature-programmed reduction (TPR) measurement was conducted on a TPDRO 1100 apparatus supplied by Thermo-Finnigan company. Each time, 30 mg of the sample was heated from room temperature to 900 °C at a rate of 10 °C min−1. A mixture gas of H2 and N2 was used as reductant with a flow rate of 20 ml min−1. Oxygen storage capacity was measured after the TPR measurement by a pulse method at 427 °C. A given amount of O2 was pulsed at specified temperature every 2 min until O2 consumption could be detected.
2.3 Activity measurements
The catalyzed soot oxidation was studied in a thermogravimetric analyzer (Mettler Toledo, TGA/SDTA851e). Oxidation experiments consisted of heating the soot-catalyst mixtures from room temperature to 800 °C in 20 ml min−1 flow of air. The activity measurements were performed with the catalyst containing 2 wt% of soot. Before the activity measurement, the catalyst and soot was conducted in the agate mortar with a spatula for 5 min to completely mix the components. The model soot used is Printex-U provided by Degussa. In this work, the soot ignition temperature of soot (Ti, the extrapolated starting point of a TG curve), the temperature at which soot oxidation proceeded at the highest rate (Tm, the maximum of a DTA curve), the complete conversion temperature of soot (Tf, the extrapolated end point of a TG curve) and temperature window (ΔT = Tf − Ti) were used to evaluate the performance of the catalysts.3. Results and discussion
3.1 Structural properties of the catalysts
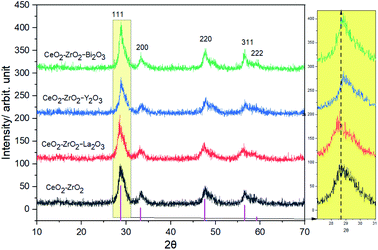
Fig. 1 collects the XRD data of the oxides which were formed after the calcination at 500 °C. The molar ratio of CeO2![[thin space (1/6-em)]](https://www.rsc.org/images/entities/char_2009.gif) :
:![[thin space (1/6-em)]](https://www.rsc.org/images/entities/char_2009.gif) ZrO2
ZrO2![[thin space (1/6-em)]](https://www.rsc.org/images/entities/char_2009.gif) :
:![[thin space (1/6-em)]](https://www.rsc.org/images/entities/char_2009.gif) M2O3 (M = La, Y, Bi) was adjusted to be 60
M2O3 (M = La, Y, Bi) was adjusted to be 60![[thin space (1/6-em)]](https://www.rsc.org/images/entities/char_2009.gif) :
:![[thin space (1/6-em)]](https://www.rsc.org/images/entities/char_2009.gif) 35
35![[thin space (1/6-em)]](https://www.rsc.org/images/entities/char_2009.gif) :
:![[thin space (1/6-em)]](https://www.rsc.org/images/entities/char_2009.gif) 5, while the molar ratio of CeO2
5, while the molar ratio of CeO2![[thin space (1/6-em)]](https://www.rsc.org/images/entities/char_2009.gif) :
:![[thin space (1/6-em)]](https://www.rsc.org/images/entities/char_2009.gif) ZrO2 was 60
ZrO2 was 60![[thin space (1/6-em)]](https://www.rsc.org/images/entities/char_2009.gif) :
:![[thin space (1/6-em)]](https://www.rsc.org/images/entities/char_2009.gif) 40. The CeO2–ZrO2 sample showed at 28.8°, 33.1°, 47.6°, 56.5° and 59.2° corresponding to the (111), (200), (220), (311) and (222) planes. These peaks are in agreement with the pattern in JCPDS No. 0038143.28 It presented the broad diffraction lines of cubic fluorite Ce0.6Zr0.4O2. Similar profiles were also obtained for the other samples. It demonstrated that all the samples form a single-phase solid solution. The diffraction lines of La2O3, Y2O3, Bi2O3 were not detected. There may be two possible reasons: (1) no phase formation for La2O3, Y2O3, Bi2O3 occurs for these catalysts, indicating that the complete formation of a homogenous tetragonal structure; (2) some La2O3, Y2O3, Bi2O3 crystallites have been formed, however they are too small or good dispersed to be detected by XRD. Papavasiliou reported that the shifting of 2θ degree is an indication of the solid solution formation.29 From Fig. 1, we can see that the XRD peaks shift to a slightly higher value with the introduction of Y3+ and Bi3+, while the diffraction peak shifts to lower value with the introduction of La3+. The substitution of Ce0.6Zr0.4O2 by a smaller ion such as Y3+, Bi3+ resulted in a contraction of the cubic cell parameter, decreasing from 0.544 nm to 0.528 and 0.527 nm, and by a larger ion such as La3+ resulted in a expansion of the cubic cell parameter, increasing from 0.532 nm to 0.535. It is due to the ionic radius of La3+ (0.116 nm) is greater than that of Ce4+ (0.097 nm), while the ionic radius of Y3+ (0.089 nm), Bi3+ (0.074 nm) is smaller than that of Ce4+ (0.097 nm). The XRD pattern features broad symmetric peaks attributed to the presence of ultrafine nanoparticles. The mean crystalline size slightly decreased from 11.6 nm of the CeO2–ZrO2 to 7.73, 7.74 nm for the CeO2–ZrO2–La2O3 and CeO2–ZrO2–Y2O3, while remaining at the same size (11.3 nm) for the CeO2–ZrO2–Bi2O3.
40. The CeO2–ZrO2 sample showed at 28.8°, 33.1°, 47.6°, 56.5° and 59.2° corresponding to the (111), (200), (220), (311) and (222) planes. These peaks are in agreement with the pattern in JCPDS No. 0038143.28 It presented the broad diffraction lines of cubic fluorite Ce0.6Zr0.4O2. Similar profiles were also obtained for the other samples. It demonstrated that all the samples form a single-phase solid solution. The diffraction lines of La2O3, Y2O3, Bi2O3 were not detected. There may be two possible reasons: (1) no phase formation for La2O3, Y2O3, Bi2O3 occurs for these catalysts, indicating that the complete formation of a homogenous tetragonal structure; (2) some La2O3, Y2O3, Bi2O3 crystallites have been formed, however they are too small or good dispersed to be detected by XRD. Papavasiliou reported that the shifting of 2θ degree is an indication of the solid solution formation.29 From Fig. 1, we can see that the XRD peaks shift to a slightly higher value with the introduction of Y3+ and Bi3+, while the diffraction peak shifts to lower value with the introduction of La3+. The substitution of Ce0.6Zr0.4O2 by a smaller ion such as Y3+, Bi3+ resulted in a contraction of the cubic cell parameter, decreasing from 0.544 nm to 0.528 and 0.527 nm, and by a larger ion such as La3+ resulted in a expansion of the cubic cell parameter, increasing from 0.532 nm to 0.535. It is due to the ionic radius of La3+ (0.116 nm) is greater than that of Ce4+ (0.097 nm), while the ionic radius of Y3+ (0.089 nm), Bi3+ (0.074 nm) is smaller than that of Ce4+ (0.097 nm). The XRD pattern features broad symmetric peaks attributed to the presence of ultrafine nanoparticles. The mean crystalline size slightly decreased from 11.6 nm of the CeO2–ZrO2 to 7.73, 7.74 nm for the CeO2–ZrO2–La2O3 and CeO2–ZrO2–Y2O3, while remaining at the same size (11.3 nm) for the CeO2–ZrO2–Bi2O3.
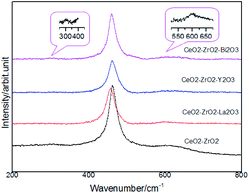
Fig. 2 shows the Raman spectra of the oxides to investigate the catalyst structure. The spectra did not present the typical ZrO2, La2O3, Y2O3, Bi2O3 band, which suggested that Zr4+, La3+, Y3+, Bi3+ was located in the CeO2 lattice. The main band of CeO2 at 460 cm−1 was the main allowed Raman mode (F2g) of fluorite-type structure. Fluorite-structure was a cubic structure (fcc) in which the cations were placed in the corners and in the centers of faces and oxygen atoms were located on the tetrahedral site. The Raman spectra for these fluorite-type oxide structures were dominated by oxygen lattice vibrations and were sensitive to crystalline symmetry.30 On the other hand, some minor peaks were additionally observed at 312 and 600 cm−1 in these four samples in addition to the main strong band around 460 cm−1. Such a spectral feature was attributed to the formation of t′′ phase, which is a kind of tetragonal structure containing oxygen displacement. It is suggested that there is more defect structure in these oxides and it helps to improve the redox property. No additional peaks were observed, suggesting that no detectable structural modification occurred and that the t′′ symmetry was conserved.
The nitrogen adsorption/desorption isotherm of the sample CeO2–ZrO2 is shown in Fig. 3, which exhibits a typical IV shape with an H2 type hysteresis loop. It can be seen that the P/P0 position of the inflection point is related to a diameter in the mesopore range and that the BJH pore size distribution is narrow, which is centered at 7.8 nm as displayed in Fig. 3. The center of the pore size distribution and the surface area are shown in Table 1. The nitrogen adsorption/desorption isotherms and the BJH pore size distributions of the other three samples CeO2–ZrO2–La2O3, CeO2–ZrO2–Y2O3 and CeO2–ZrO2–Bi2O3 are very similar to the CeO2–ZrO2. It proved that the meso-porous structure could be stabilized prepared using the same solvothermal synthesis method. In general, the specific surface areas of the mixed oxides were significantly larger. The surface area of CeO2–ZrO2 was 83.75 m2 g−1. The surface areas of the CeO2–ZrO2–La2O3 and CeO2–ZrO2–Y2O3 were 105.94 and 102.58 m2 g−1, respectively, showing an increase when the La3+ and Y3+ were doped into it. These results reveal that the doping by the La3+ and Y3+ show good resistance to thermal sintering. It is accordant with the literature report. Monte et al. had used the hydrothermal method to prepare CeO2–ZrO2-containing mixed oxides.31 After hydrothermal treatment, the textural properties of the CeO2–ZrO2 was shown as a type II isotherm and a hysteresis loop. The surface area of the Ce0.2Zr0.75La0.05O1.975 was 87 m2 g−1 after calcinated by 700 °C. The surface area of the CeO2–ZrO2–Bi2O3 was decrease to 79 m2 g−1. It is probably because of the relatively low melting point of Bi2O3 (824 °C) in comparison to those of CeO2 (2670 °C).32,33
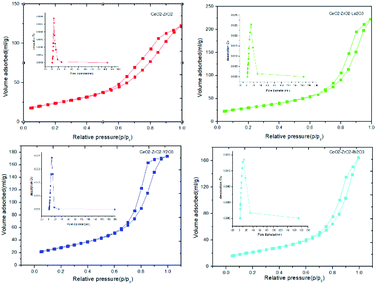 | ||
| Fig. 3 Nitrogen adsorption/desorption isotherms and pore diameter distribution (inset) of CeO2–ZrO2–M2O3. | ||
| Sample | Surface area (m2 g−1) | Centre of pore size distribution (nm) | Average particle size (nm) | OSC (μmol O2 g−1) |
|---|---|---|---|---|
| CeO2–ZrO2 | 83.75 | 7.8 | 11.61 | 493 |
| CeO2–ZrO2–La2O3 | 105.94 | 12.5 | 7.73 | 602 |
| CeO2–ZrO2–Y2O3 | 102.58 | 9.6 | 7.74 | 575 |
| CeO2–ZrO2–Bi2O3 | 78.98 | 12.5 | 11.32 | 1094 |
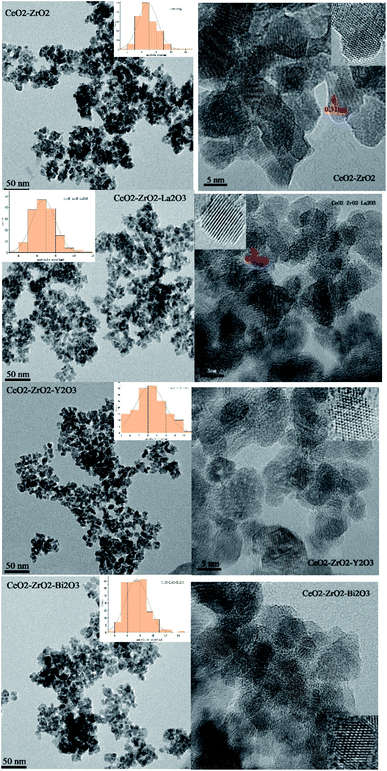
Fig. 4 shows the TEM images of the oxides. The TEM images showed discrete nanocrystals and weekly agglomerated of CeO2–ZrO2 for the four samples. A comparable size from X-ray line broadening analysis and TEM measurements of the CeO2–ZrO2 samples clearly suggest that the preparations with this method lead to a successful control of the crystal size to less than 15 nm. From the perspective of the grain size distribution of the four catalysts (counted from more than 150 crystals), the grain sizes of CeO2–ZrO2–La2O3, CeO2–ZrO2–Y2O3 are smaller than that of CeO2–ZrO2 indicating that the addition of La2O3 and Y2O3 benefit to retain small crystal size of CeO2–ZrO2. The grain size of CeO2–ZrO2–Bi2O3 is similar with CeO2–ZrO2, meaning that the incorporation of Bi into CeO2–ZrO2 has little effect on the grain size. The lattice fringes are been seen in the HRTEM images. The exposed crystal faces can be determined by the crystal plane spacing. The interplanar spacing of (111) planes are 0.31 nm. It can be seen from the Fig. 4, for the four samples, there are (111) planes exposed, which can be attributed to the (111) plane of CeO2–ZrO2. R. O. Fuentes et al.34 used a citrate complexation route to prepare nanocrystalline CeO2–ZrO2 mixed oxide. The HRTEM images showed the cubic fluorite structure. Clear lattice images were obtained which could be indexed to the fluorite structure. Chen Yaoqiang et al. prepare CeO2–ZrO2–Y2O3–La2O3 nano materials. The HRTEM images showed the cubic fluorite structure of CeO2–ZrO2–Y2O3–La2O3.28
The OSC results of various samples are shown in Table 1. The OSC of CeO2–ZrO2–La2O3 and CeO2–ZrO2–Y2O3 is higher than CeO2–ZrO2. On the one hand, after the La or Y incorporation into the ceria lattice both geometric and electronic properties (M–O distance and positive charge on the metal ion are changed.35 On the other hand, in the case of La3+ doped ceria, doping of every two La3+ creates one oxygen vacancy due to the charge neutralization.36 The defects created during the incorporation of La3+ leads to ease of formation of labile oxygen vacancies, which facilitate relatively high mobility of bulk oxygen species within the lattice cell thereby enhancement in the OSC.37 The OSC value of CeO2–ZrO2–Bi2O3 is about twice as high as that of CeO2–ZrO2. The reason for such characteristics was that Bi2O3 was reduced to metallic Bi easily and that both Ce4+ and Bi3+ were reduced simultaneously.38
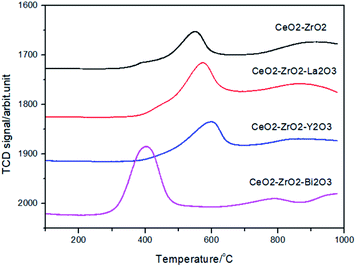
The reduction properties of Ce mixed oxides were studied by TPR technique. Fig. 5 illustrates the H2-TPR profiles of the oxides. The CeO2–ZrO2 featured a peak at 551 °C with a shoulder at 395 °C. By increasing the La3+ into the CeO2–ZrO2, the maximum of the peak shifts down to 533 °C while the contribution of the shoulder at about 395 °C became smaller. The reduction profiles of the CeO2–ZrO2–La2O3 and CeO2–ZrO2–Y2O3 were very similar. This indicated that there were at least two types of adsorbed surface oxygen species located at lower temperatures and the reduction peak centered at 530–550 °C could be assigned to the Ce4+ reduction of surface or subsurface. The easy reduction of CeO2–ZrO2–La2O3, CeO2–ZrO2–Y2O3 compared to CeO2–ZrO2 indicated that the introduction of trivalent dopants (La and Y) to the CeO2–ZrO2 mixed oxide can change the surface chemical property of mixed oxide, which increased the adsorption capacity of oxygen species on the surface of mixed oxide. Yao and Yao have found that the reduction peaks of the surface capping oxygen and the bulk oxygen of CeO2 were centered at 500 and 800 °C, respectively.39 The peak at around 400 °C was ascribed to the reduction of surface capping oxygen (O2−, O) species due to the defects of structure and electronic properties of nonstoichiometric ceria. He et al. have found that Y3+ doping into the CeO2–ZrO2 lattice can increase the concentrations of oxygen vacancies and Ce3+ ions, and the reduction peaks at 528 and 825 °C in the first TPR run were observed.40
For the CeO2–ZrO2–Bi2O3 mixed oxide, a broad reduction peak at 400 °C with one small peak at 790 °C were observed, suggesting that the reduction at the higher temperature belongs to the bulk reduction of CeO2, whereas the reduction at the lower temperature is attributable to the reduction of Bi3+ in addition to the different extent of the oxygen displacement on or near the surface of the catalyst. In CeO2–ZrO2–Bi2O3 mixed oxide, both Ce4+ and Bi3+ were reduced simultaneously, while only Ce4+ were reduced in CeO2–ZrO2–La2O3 and CeO2–ZrO2–Y2O3. As a result, the reduction temperature of CeO2–ZrO2–Bi2O3 became much lower than those of the latter.41
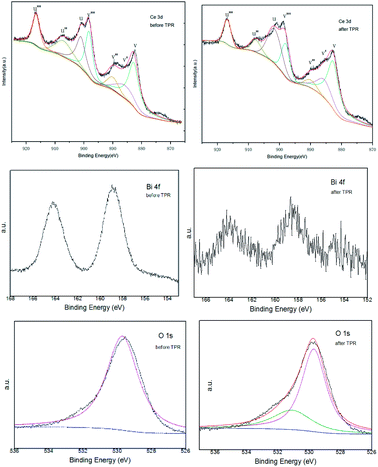
CeO2–ZrO2–Bi2O3 was measured by XPS before and after TPR to obtain a deeper insight into the role of Bi2O3. Surface atomic ratios of Ce, Zr, Bi, O elements before and after the TPR measurement are included in Table 2. The surface cerium fraction of the sample CeO2–ZrO2–Bi2O3 is higher than its nominal ratio, which implies the formation of a cerium-rich phase at the periphery of the particles and a good incorporation of zirconium into the bulk. The surface Bi fraction was accumulated on the catalyst surface. After the TPR measurement, the surface Bi fraction was almost zero.
| Sample (CeO2–ZrO2–Bi2O3) | Element content (at%) | |||
|---|---|---|---|---|
| Ce | Zr | Bi | O | |
| Before the TPR | 24.69 | 6.98 | 4.92 | 63.41 |
| After the TPR | 25.37 | 7.57 | 0.33 | 66.73 |
Fig. 6 shows the general survey spectrum of the CeO2–ZrO2–Bi2O3 before and after the TPR measurement. Fig. 6a gives the Ce 3d spectra for two samples. The series of V and U peaks are from the 3d5/2 and 3d3/2 states, respectively. The peak of v and v′′ could be assigned to a mixing configuration of 3d94f2(O2p4) and 3d94f1(O2p5) Ce4+ states, and v’’’ to the 3d94f0(O2p6) Ce4+ state. The peak of v′ is attributed to 3d94f1(O2p6) Ce3+ final state.42 The series of U structures can be explained in the same way.43 It is shown that the intensities of the peaks of Ce4+ is the main oxidations state. The proportion of Ce3+ contents in Ce are listed in Table 2, which are calculated by the ratio of the sum of peak areas of Ce3+ to the total peak areas of all Ce species. The Ce3+ concentration of CeO2–ZrO2–Bi2O3 after TPR is approximately 15.06%, which is larger than that of CeO2–ZrO2–Bi2O3 before TPR. It is known that the existence of Ce3+ species could cause a charge imbalance and facilitate the formation of oxygen vacancies and unsaturated chemical bonds, which will result in an augment of chemisorbed oxygen on the surface of the catalyst.44 The oxygen vacancies can improve the redox property because of the increase of oxygen migration.45
The Bi 4f spectrum displayed the main peaks of Bi 4f7/2 and Bi 4f5/2 at the binding energies of 158.7 and 163.9 eV, respectively. These parameters correspond to the Bi3+ surface species, indicating that Bi was at the 3+ state in the sample.46,47 While after the TPR measurement, the peaks of Bi 4f were weakened.
The O 1s peak of the oxide before the TPR present at 529.7 eV. It has been revealed that the peak in the 529.5–530.5 eV range is the O 1s peak that characterizes the O2− ions of the lattice oxygen. After the TPR, the O 1s peak can be deconvoluted into two peaks at about 529.7 and 531.1 eV, which indicated the existence of two different oxygen species. The main peak at 529.7 eV is characterized the O2− ions of the lattice oxygen. The second peak at 531.1 eV corresponds to the ionizations of weakly adsorbed species and also the ionizations of oxygen ions with particular coordinations, more specifically integrated in the subsurface, suggesting the existence, in the subsurface, of oxygen ions with lower electron density, described as O− species or excess oxygen.
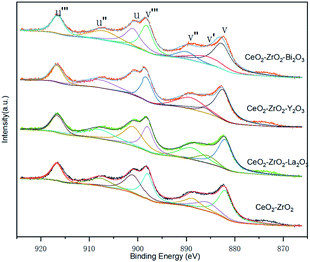
XPS investigations are used to get some information of the surface chemical compositions of catalysts. As shown in Fig. 7, some peaks are involved in Ce 3d spectra corresponding to four pairs of spin–orbit doublets. The surface elemental concentrations of catalyst which are calculated are summarized in Table 3. It can be seen that the surface elemental concentration of the four catalysts do not show much difference. This means that the elemental compositions of the four catalysts are almost the same. The surface content of Ce is higher than that nominal ration, which means that the cerium-rich phase is formed on the surface of catalyst.
| Sample (CeO2–ZrO2–M2O3) | Element content (at%) | |||
|---|---|---|---|---|
| Ce | Zr | M | O | |
| CeO2–ZrO2– | 27.47 | 10.26 | — | 62.27 |
| CeO2–ZrO2–La2O3 | 24.31 | 7.03 | 4.38 | 64.29 |
| CeO2–ZrO2–Y2O3 | 24.14 | 6.95 | 4.57 | 64.34 |
| CeO2–ZrO2–Bi2O3 | 24.69 | 6.98 | 4.92 | 63.41 |
3.2 Soot oxidation
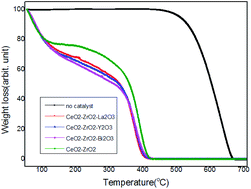
The soot conversion profiles corresponding to the catalytic tests performed with the different catalysts are included in Fig. 8. The characteristic temperature for soot oxidation are listed in Table 4. Without catalyst, the soot oxidation begins at 487 °C and the Tm is around 677 °C. The temperature values Ti, Tm, Tf and ΔT were significantly low when CeO2 was used as catalyst compared with that of the un-catalyzed soot oxidation. Tm of the CeO2–ZrO2 was 399 °C, decreasing about 266 °C as compared with the un-catalyzed reaction (Tm = 625 °C). The effect of the catalyst is also indicated by a narrowing of the temperature window. The value of ΔT of the CeO2–ZrO2 was decreased by 115 °C as compared with the un-catalyzed reaction (ΔT = 190). The influence of trivalent cation doped into the CeO2–ZrO2 on soot oxidation is compared. It can be seen that the addition of trivalent cation improved the catalytic activity for soot oxidation and the characteristic temperatures including Ti, Tf, Tm and ΔT were significantly lower than that of CeO2–ZrO2. The CeO2–ZrO2–La2O3 has the lowest soot ignition temperature. The lowest Tm and ΔT for soot combustion were obtained using CeO2–ZrO2–Bi2O3. Analogously, CeO2–ZrO2 high soot combustion activity, over which the Tm was at about 414 °C.48 N. Imanaka et al. showed that Ce0.47Pr0.21Bi0.32O1.805 catalyst had a good catalytic performance for soot oxidation, which exhibited a soot complete oxidation temperature of about 389 °C.49| Sample | Ti (°C) | Tf (°C) | ΔT (°C) | Tm (°C) |
|---|---|---|---|---|
| CeO2–ZrO2 | 357 | 432 | 75 | 399 |
| CeO2–ZrO2–La2O3 | 346 | 418 | 72 | 387 |
| CeO2–ZrO2–Y2O3 | 351 | 416 | 65 | 386 |
| CeO2–ZrO2–Bi2O3 | 348 | 413 | 65 | 384 |
| C | 487 | 677 | 190 | 625 |
Accounting from the characterization results, the La3+ and Y3+ incorporation into ceria lattice induces more lattice deformation and more oxygen vacancies. Moreover, larger ionic radius La3+ and Y3+ in the lattice can exert a lattice strain in the mixed oxide and thereby, making the more oxygen vacancies, hence these vacancies allow more amount of gaseous oxygen to be adsorbed, due to which the rate of oxygen transfer to the soot adsorbed surface is increased with subsequent improvement in the soot conversion. It is known that low temperature reduction of a catalyst favor soot oxidation at low temperatures. When Bi oxide was dissolved into the CeO2–ZrO2 lattice, it can storage and release oxygen at low temperature. The CeO2–ZrO2–Bi2O3 can release oxygen at the temperature lower than 400 °C. This behavior was not observed in the other catalyst. This can be attributed to the synergistic effect of the easy reduction Bi2O3 and Ce4+ to Ce3+, which accelerates oxide ion migration at low temperature. However, according to the results of XPS, after the TPR measurement, the content of Bi was almost zero. Therefore, we should be careful to apply Bi3+ as alternative catalyst components, especially for the catalyst work at higher temperature.
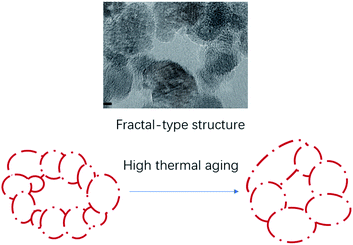
Solvothermal reactions are easy to control over crystal growth: precipitation at room temperature give smaller particles. The replacement of water as solvent by alcohols offers further control over crystal growth, particularly to allow monodisperse samples of small crystals to be formed:50 in our results, we can see that crystallites of CeO2 are less than 15 nm in dimension. The use of solvothermal conditions can allow Ostwald ripening to occur, whereby smaller crystallites first produced are consumed at the expense of growing larger crystals, then by selecting solvent or solution additive, some degree of control of crystal form can be achieved in the final product. Researchers from Rhodia showed that the bimodal-fractal type of pore distribution was useful for the thermal stability of the mixed oxides.51 We can see that the ceria oxides by the solvothermal synthesis method. The primary particles (diameter 5–15 nm) stick together to form large aggregates. Within these aggregates, the pores are very heterogeneous in size and shape. The aggregates set in a fractal type texture, with less contact points between aggregates. This texture is less temperature sensitive than a compact texture (Fig. 9).
4. Conclusions
Ceria–zirconia–lanthana, ceria–zirconia–yttria and ceria–zirconia–Bi mixed oxides were prepared successfully by a solvothermal method and characterized by XRD, Raman, TEM, XPS, BET surface area and TPR methods. The formation of mixed oxides was confirmed from both XRD and Raman results. The TEM studies confirmed that the formation of nanosized CeO2–ZrO2–M2O3 (M = La, Y, Bi) crystallites. The third element dopants can improve the reducing capacity at low temperature in the CeO2–ZrO2 mixed oxide and promote the catalytic activity, which can be gauged by the lowering of the soot oxidation temperature by more than 200 °C compared with the uncatalyzed reaction. The benefit of yttrium or lanthana doping in catalytic activity of ceria can be in terms of active oxygen formation provoked by defective structure of ceria due to the presence of La3+ and Y3+. The benefit of Bi doping in catalytic activity can be related to the reduction at low temperature both Bi2O3 and ceria.Conflicts of interest
There are no conflicts to declare.Acknowledgements
This research was funded by Significant Scientific Research Cultivation Project of Dongguan City College 2021YZDY02Z; This work has been supported by the National Nature Science Foundation of China under contract number 51106033.References
- T. Andana, M. Piumwrri, S. Bensaid, N. Russo, D. Fino and R. Pirone, Appl. Catal., B, 2016, 197, 125–137 CrossRef CAS.
- D. Fino, E. Cauda, D. Mescia, N. Russo, G. Saracco and V. Specchia, Catal. Today, 2007, 119, 257–261 CrossRef CAS.
- P. Dulgheru and J. A. Sullivan, Top. Catal., 2013, 56, 504–510 CrossRef CAS.
- B. Giechaskiel, A. Joshi, L. Ntziachristos and P. Dilara, Catalysis, 2019, 9, 586 CAS.
- A. oshi and T. V. Johnson, Emiss. Control Sci. Technol., 2018, 4, 219–239 CrossRef.
- E. Aneggi and A. Trovarelli, Catalysis, 2020, 10, 768 CAS.
- C. Moreno-Marcos, V. Torregrosa-Rivero, V. Albaladejo-Fuentes, M. S. Sánchez-Adsuar and M. J. Illán-Gómez, Top. Catal., 2018, 62, 413–418 CrossRef.
- T. R. Veronica, A. F. Vicente, S. S. Maria and J. G. Maria, RSC Adv., 2017, 7, 35228–35238 RSC.
- X. D. Wu, S. Liu and D. Weng, Catal. Sci. Technol., 2011, 1, 644–651 RSC.
- Z. Yang, N. Zhang, H. Xu, Y. Li, L. Ren, Y. Liao and Y. Chen, Combust. Flame, 2022, 235, 111700 CrossRef CAS.
- L. Katta, P. Sudarsanam, G. Thrimurthulu and B. M. Reddy, Appl. Catal., B, 2010, 101, 101–108 CrossRef CAS.
- S. Liu, X. D. Wu, J. Tang, P. Y. Cui, X. Q. Jiang, C. G. Chang, W. Liu, Y. X. Gao, M. Li and D. Weng, Catal. Today, 2017, 281, 454–459 CrossRef CAS.
- J. C. Martinez-Munuera, M. Zoccoli, J. Gimenez-Manogil and A. Garcia-Garcia, Appl. Catal., B, 2019, 245, 706–720 CrossRef CAS.
- M. Casapu, A. Bernhard, D. Peitz, M. Mehring, M. Elsener and O. Kröcher, Appl. Catal., B, 2011, 103, 79–84 CrossRef CAS.
- P. Miceli, S. Bensaid, N. Russo and D. Fino, Chem. Eng. J., 2015, 278, 190–198 CrossRef CAS.
- H. Zhao, X. X. Zhou, M. Wang, Z. Xie, H. R. Chen and J. L. Shi, RSC Adv., 2017, 7, 3233–3239 RSC.
- Q. Shen, M. F. Wu, H. Wang, C. He, Z. P. Hao, W. Wei and Y. H. Sun, Catal. Sci. Technol., 2015, 5, 1941–1952 RSC.
- R. D. Monte and J. Kaspar, J. Mater. Chem., 2005, 15, 633–648 RSC.
- A. Bueno-Lopez, K. Krishna, M. Makkee and J. A. Moulijn, J. Catal., 2005, 230, 237–248 CrossRef CAS.
- Y. Zhou, X. Q. Cheng, S. H. Li, L. Xiong, S. Yan, J. L. Wang and Y. Q. Chen, Mater. Sci. Eng. B, 2017, 225, 10–19 CrossRef CAS.
- K. Minami, T. Masui, N. Imanaka, L. Dai and B. Pacaud, J. Alloys Compd., 2006, 408–412, 1132 CrossRef CAS.
- J. Wang, M. Shen, J. Wang, J. Gao, J. Ma and S. Liu, J. Rare Earths, 2012, 30, 878–883 CrossRef CAS.
- K. Krishna, A. Bueno-López, M. Makkee and J. A. Moulijn, Appl. Catal., B, 2007, 75, 210–220 CrossRef CAS.
- I. Atribak, A. Bueno-Lopez and A. Garcia-Garcia, J. Mol. Catal. A: Chem., 2009, 300, 103–110 CrossRef CAS.
- J. Mikulova, S. Rossignol, F. Gerard, D. Mesnard, C. Kappenstein and D. Duprez, J. Solid State Chem., 2006, 179, 2511–2520 CrossRef CAS.
- L. Xiong, P. Yao, S. Liu, S. Li, J. Deng, Y. Jiao, Y. Chen and J. Wang, Mol. Catal., 2019, 467, 16–23 CrossRef CAS.
- P. Vidmar, P. Fornasiero, J. Kaspar, G. Gubitosa and M. Graziani, J. Catal., 1997, 171, 160–168 CrossRef CAS.
- M. C. Li, J. Deng, X. Y. Yin, W. Wang, Y. Zhao, H. D. Xu, J. L. Wang and Y. Q. Chen, J. Alloys Compd., 2022, 894, 162301 CrossRef CAS.
- A. Papavasiliou, A. Tsetsekou, V. Matsouka, M. Konsolakis, I. V. Yentekakis and N. Boukos, Appl. Catal., B, 2009, 90, 162–174 CrossRef CAS.
- M. Fermandez-Garcia, A. Martinez-Arias, A. Lglesias-Juez, C. Belver, A. B. Hungria, J. C. Conesa and J. Soria, J. Catal., 2000, 194, 385–392 CrossRef.
- R. D. Monte, J. Kaspar, H. Bradshaw and C. Norman, J. Rare Earths, 2008, 26, 136–140 CrossRef.
- G. Gattow and H. Schröder, Z. Anorg. Allg. Chem., 1962, 318, 176 CrossRef CAS.
- O. A. Mordovin, N. I. Timofeeva and L. N. Drozdova, Izv. Akad. Nauk SSSR, Neorg. Mater., 1967, 3, 187 CAS.
- R. O. Fuentes and R. T. Baker, J. Phys. Chem. C, 2009, 113, 914–924 CrossRef CAS.
- M. F. Garcia, A. M. Arias, J. C. Hanson and J. A. Rodrigues, Chem. Rev., 2004, 104, 4063–4104 CrossRef PubMed.
- R. Thanneeru, S. Patil, S. Deshpande and S. Seal, Acta Mater., 2007, 55, 3457–3466 CrossRef CAS.
- E. Mamontov, T. Egami, R. Brezny, M. Koranne and S. Tyagi, J. Phys. Chem. B, 2000, 104, 11110–11116 CrossRef CAS.
- K. Minami, T. Masui, N. Imanaka, L. Dai and B. Pacaud, J. Alloys Compd., 2006, 408–412, 1132 CrossRef CAS.
- H. C. Yao and Y. F. Y. Yao, J. Catal., 1984, 86, 254–265 CrossRef CAS.
- H. He, H. X. Dai, K. W. Wong and C. T. Au, Appl. Catal., A, 2003, 251, 61–74 CrossRef CAS.
- K. Minami, T. Masui, N. Imanaka, L. Dai and B. Pacaud, J. Alloys Compd., 2006, 408–412, 1132–1135 CrossRef CAS.
- P. F. Ji, J. L. Zhang, F. Chen and M. Anpo, J. Phys. Chem. C, 2008, 112, 17809–17813 CrossRef CAS.
- P. Larsson and A. Andersson, J. Catal., 1998, 179, 72–89 CrossRef CAS.
- H. Wang, X. Chen, S. Gao, Z. Wu, Y. Liu and X. Weng, Catal. Sci. Technol., 2013, 3, 715 RSC.
- Y. D. Chen, L. Wang, X. X. Guan, Y. B. Liu, M. C. Gong and Y. Q. Chen, Acta Phys.-Chim. Sin., 2013, 29, 1048 CAS.
- M. Romeo, K. Bak, J. El Fallah, F. Le Normand and L. Hilaire, Surf. Interface Anal., 1993, 20, 508–512 CrossRef CAS.
- M. Paulis, H. Peyrard and M. Montes, J. Catal., 2001, 199, 30–40 CrossRef CAS.
- M. Daturi, C. Binet, J. C. Lavalley, A. Galtayries and R. Sporken, Phys. Chem. Chem. Phys., 1999, 1, 5717–5724 RSC.
- N. Imanaka, T. Masui, T. Egawa and H. Imadzu, J. Mater. Chem, 2009, 19, 208–210 RSC.
- X. H. Wu, W. Qin and W. D. He, J. Mol. Catal. A: Chem., 2007, 261, 167–171 CrossRef CAS.
- E. Rohart, O. Larcher, S. Deutsch, C. Heduin, H. Aimin, F. Fajardie, M. Allain and P. Macaudiere, Top. Catal., 2004, 30–31, 417–423 CrossRef.
| This journal is © The Royal Society of Chemistry 2022 |

