 Open Access Article
Nanostructured micro/mesoporous graphene: removal performance of volatile organic compounds†
Thi To Nguyen Voa,
Sun Taek Limac,
Ji Hoon Kim ab,
Gyu Hyeon Shimac,
Koung Moon Kimac,
Boyeon Kweona,
Miyeon Kimd,
Chang Yeon Lee
 d and
Ho Seon Ahn
 *ace
*ace
aDepartment of Mechanical Engineering, Incheon National University, Incheon, Republic of Korea. E-mail: hsahn@inu.ac.kr
bResearch Institute of Basic Sciences, Incheon National University, Incheon, Republic of Korea
cNuclear Safety Research Institute, Incheon National University, Incheon, Republic of Korea
dDepartment of Energy and Chemical Engineering, Incheon National University, Incheon, Republic of Korea
eAHN Materials INC, Incheon, Republic of Korea
First published on 13th May 2022
Abstract
In this study, we demonstrate an integrated synthesis strategy, which is conducted by the thermochemical process, consisting of pre- and post-activation by thermal treatment and KOH activation for the reduction of graphite oxide. A large number of interconnected pore networks with a micro/mesoporous range were constructed on a framework of graphene layers with a specific surface area of up to 1261 m2 g−1. This suggests a synergistic effect of thermally exfoliated graphene oxide (TEGO) on the removal efficiency of volatile organic compounds by generating pore texture with aromatic adsorbates such as benzene, toluene, and o-xylene (denoted as BTX) from an inert gaseous stream concentration of 100 ppm. As a proof of concept, TEGO, as well as pre- and post-activated TEGO, were used as adsorbents in a self-designed BTX gas adsorption apparatus, which exhibited a high removal efficiency of up to 98 ± 2%. The distinctive structure of TEGO has a significant effect on removal performance, which will greatly facilitate the strategy of efficient VOC removal configurations.
Introduction
Poor air quality is problematic because of its destructive probability to impact human health and the ecosystem. The emitted volatile organic compounds (VOCs) such as the benzene series are harmful to human health and the environment. The emission of BTX gases into the atmospheric air leads to detrimental effects because most of them are carcinogenic and mutagenic agents and may produce reproductive adverse effects.1 The elimination of VOCs, especially BTX, is of distinct interest for improving the quality of air. Numerous VOC treatment methodologies have been introduced, such as adsorption,2,3 incineration,4 combustion,5 and catalytic oxidation,6,7 to treat VOCs. Among these, adsorption is considered as the most suitable technique for VOC removal because of its high efficiency, ease of approachability, cost-effectiveness, large-scale application, and reusability.8 A porous material with high adsorptive capacity is significant for the removal of the VOCs. Porous materials, including porous carbon,9 zeolites,10,11 metal–organic frameworks (MOFs),12,13 porous organic polymer networks,14 are attracting interest for applications, such as energy storage,15,16 catalysts,17 especially for VOCs treatment, owing to their availability, adjustable structure, variety of forms, and large specific surface area (SSA). Carbon materials, such as activated carbon fibers and carbon nanotubes, have been extensively used in adsorption because of their high stability, low density, and high SSA, which enhance the removal capacity.18 Among these, graphene has attracted extensive interest owing to its unique thermal, electrical, and mechanical properties since its discovery in 2004.19 Graphite oxide (GO) was mainly considered a precursor to graphene. GO is a highly energetic substance having a large quantity of chemical energy stored in it that may be released quickly. It has been proven that when GO is thermally reduced, disproportionation reactions occur. During these reactions, a portion of the carbon atoms is completely oxidized to CO2, while the remaining carbon atoms are reduced to the sp2 graphene network. However, this results in the formation of carbon gaps in the basal planes, resulting in the formation of a porous graphene structure.20 Thermally exfoliated graphene oxide (TEGO) is a comparatively new category of synthesized carbonaceous materials, which affects the characteristics of graphite and oxidation methods.21 Direct thermal treatment is beneficial for removing oxygen from exfoliated GO to produce graphene. Rapid heating results in the unpredictable reduction of GO with the formation of TEGO.22 A large SSA and pore volume can be achieved owing to the porous structure of graphene-based adsorbents. However, considering the complex procedures involved in the synthesis of MOFs and related materials, TEGOs turn out to be a feasible option for cost-effective and substantial environmental applications. The synthesis and properties of graphene-based adsorbents with tailored porous structures for the VOC treatment must be studied. Modification methods are developed to enhance the removal performance of VOCs adsorbents by adjusting their SSAs, chemical functional groups, and pore structure.23 Prior research has concentrated on porous materials and their modifications, whereas the effectiveness of certain other absorbents in removing VOCs has been reported. MOF/zeolite composite in particular appears to be a possible option for effective adsorption of VOCs.24 Mesoporous silica was integrated with hydrophilic adsorbents to boost their hydrophobicity, which facilitates interaction with organic pollutants.25 Numerous attempts have been made to synthesize and modulate structures using physical and chemical activation. Chemical activation by alkali compounds is widely used for obtaining activated graphene-based materials with high SSA and well-developed porosity.26 A common activating agent such as KOH is exploited to customize the pore texture in graphene-based materials. The activation of KOH produces activated graphene with higher SSA and beneficial pore structure.27,28 The comparatively complex synthesis and severe graphic aggregation remain, however, a major obstacle for its industrial applications.Here, we propose an efficient strategy for the synthesis of highly porous pre- and post-activated TEGOs that exhibit high SSA, unique structure, and exceptional BTX gases adsorption behavior, by an integrated thermochemical treatment, which consists of thermal exfoliation and KOH activation. Therefore, it is worth investigating the impact of structural changes in graphene derivatives on the removal performance of porous graphene-based adsorbents, which can have stronger interactions with the adsorbed BTX molecules. The formation of pore networks ranging from micro to mesopores, which is a significant reason for utilizing TEGO as a potential adsorbent, was investigated using a self-designed BTX gases adsorption apparatus. This is a significant step toward the practical application of TEGOs as VOC adsorbents.
Experimental
Material
Graphite (Sigma-Aldrich, 325 mesh), sulfuric acid (H2SO4, 95%, Daejung), phosphoric acid (H3PO4, 85%, Daejung), potassium permanganate (KMnO4, 99.0%, Daejung), hydrogen peroxide (H2O2, 30%, Daejung), hydrochloric acid (HCl, 35%, Daejung), and potassium hydroxide (KOH, flake, Daejung), were used for the synthesis process. These chemicals were used as received without further purification. Deionized water was used in all experiments.Preparation of GO
One of the best methods for producing an enormous amount of graphene oxide by a wet chemical method is Tour's method,29 which is an improvement of Hummer's method.30 Typically, a mixture of concentrated acid was prepared with 360 mL H2SO4 and 40 mL H3PO4 in a three-neck round-bottom flask placed on a mantle heater. Graphite (3 g) was added while ensuring adequate stirring. The ice bath was pre-prepared to prevent overheating of the mixture from exceeding 35 °C, followed by slow addition of 18 g KMnO4. The reaction mixture was heated to 50 °C and stirred for 22 h. After the completion of the reaction, the suspension became pasty with a brownish-grey color. The reaction was cooled by adding H2O2 (3 mL) and deionized water (400 mL) under vigorous stirring and temperature below 10 °C, the sludge turned bright yellow during neutralization. The residues from the as-prepared GO were removed by filtration and rinsing. The mixture was sifted with a fine test sieve (300 μm, ASTM E11), and the GO cake was collected by vacuum filtering. The multiple-wash step was alternately conducted with deionized water and a mixture of HCl and deionized water (ratio 3![[thin space (1/6-em)]](https://www.rsc.org/images/entities/char_2009.gif) :
:![[thin space (1/6-em)]](https://www.rsc.org/images/entities/char_2009.gif) 1), followed by centrifugation (4000 rpm for 30 min). The GO powder was obtained by freeze-drying for several days.
1), followed by centrifugation (4000 rpm for 30 min). The GO powder was obtained by freeze-drying for several days.
Preparation of TEGO
A porcelain boat containing 1 g GO powder was covered with an alumina sheet and placed in the center of the quartz tube furnace. It was operated at 600 °C under argon gas at a flow rate of 500 sccm for 30 min. The GO powder expanded greatly in volume and became black after heat treatment, resulting in fluffy and light materials, which are presented in Fig. S1.†Preparation of pre- and post-activated graphene by the thermochemical process
Typically, KOH activation is achieved by physical mixing. The KOH/C ratio was defined by assuming that 85% of the samples were dried.31 GO and TEGO were impregnated in a 7 M KOH solution with a KOH/C ratio of 6.5. The KOH activation was performed at 800 °C in a tube furnace under argon flow at 500 sccm. The sample was heated at a heating rate of 5 °C min−1 and held at the desired temperature for 1 h. After KOH activation, the resulting samples were intensively washed with deionized water to ensure the complete removal of KOH residue. Fig. 1 illustrates the KOH activation and thermal exfoliation scheme and the final products designated as pre-activated and post-activated TEGO corresponding to their derivations from GO and TEGO.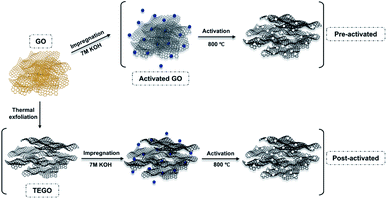 | ||
| Fig. 1 A schematic illustration for generating pore network by thermochemical: thermal treatment and KOH activation on graphene-based materials. | ||
Characterization
Scanning electron microscopy (SEM) images were obtained using a JEOL JSM-7008F microscope with various magnifications. The morphology of materials was characterized using SEI TALOS F200X transmission electron microscope (TEM) at an accelerating voltage of 200 kV. The samples were prepared using ultrasonic dispersion for 30 s, with absolute alcohol acting as the dispersing medium, and dropped onto the TEM carbon grids. The structural properties of the samples were analyzed using a Rigaku Smart Lab diffractometer with a Cu Kα target (λ = 1.5412 Å; 3 kW) operated at 45 kV and 200 mA, respectively. The 2θ measurement range from 5 to 80° was scanned at a speed of 3° min−1. The interlayer spacing between the stacked layers was determined using Bragg's law. X-Ray photoelectron spectroscopy (XPS) data were collected using a ULVAC-PHI 5000 Versa Probe II spectrometer with an Al X-ray source equipped with a monochromator. Nitrogen adsorption/desorption isotherms were used to investigate the change in SSA and pore size distribution of the absorbent material with Quantachrome Autosorb IQ-MP-C surface area analyzer. Prior to this analysis, the samples were outgassed under vacuum at 120 °C for 12 h. The Brunauer–Emmett–Teller (BET) method was used to determine the SSA. The pore volumes were calculated assuming an absolute surface penetration of nitrogen at a relative pressure (P/P0) range of 0.05–0.30. Raman spectroscopy was performed using a Raman microprobe (WITEC Alpha 300) with a 532 nm Nd:YAG laser excitation source at room temperature.BTX gases adsorption test
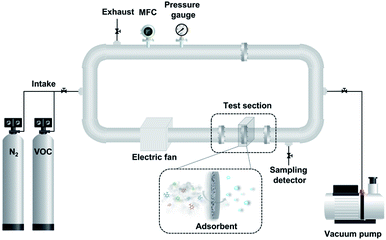
The adsorption tests of BTX on TEGOs as adsorbents were performed in an acrylic test loop under a constant stream with a flow of 2.26 m3 min−1. The BTX gases adsorption system is schematically shown in Fig. 2. Under ambient conditions, the self-designed BTX gases adsorption testing system was placed in a fume hood, which was secure for the intake and exhaust lines. Initially, the nitrogen stream was purged into the test loop in the volume of 5.57 L until the required pressure was attained. The adsorption of BTX on TEGOs was evaluated at 25 °C and the pressure was maintained at 0.1 MPa during the adsorption test. Under nitrogen gas flow, the remaining impurities and moisture in the acrylic test loop were eliminated three times. BTX gases have a specified concentration of 100 ppm in nitrogen as a carrier gas. Then, the BTX gas stream was singly passed through the pre-packed TEGOs filter with 150 mg of adsorbent for each test, where the BTX molecules interacted with TEGO adsorbents. The removed influent and effluent were evaluated using a gas detector tube system (GASTEC). During the experiment, the BTX adsorbed by the TEGO was determined using the following equation:
 | (1) |
 | (2) |
Results and discussion
Material characterization
To understand the structural and morphological characteristics of the graphene-based adsorbents, SEM images were obtained, as shown in Fig. 3. As given in Fig. 3 (a and b), the SEM results demonstrate that the stack structure of the layers was observed in both GO and a-GO, which typically preserve the parent graphite. The wrinkle-like structures were clearly observed on the surface of the GO sheets as a result of oxidative treatment.33 The arranged fluffy layers of the TEGO morphology were observed, which indicate the escape of steam and gas, such as CO, CO2, and/or H2O, between the GO sheets during thermal exfoliation under argon flow, are presented in Fig. 3(c–f).34 This is due to the thermal exfoliation results in substantial volume expansion and thorough elimination of the surface functional groups.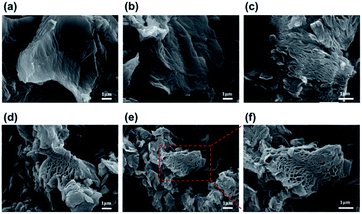 | ||
| Fig. 3 SEM images of GO (a) activated GO (b), TEGO (c), pre-activated TEGO (d), post-activated TEGO (e and f) at different magnification. | ||
Representative TEGOs are shown in Fig. 4(a–c). The intrinsic layered morphology of the TEGOs is clearly revealed in the TEM image. The fluffy texture overlapped on a layered morphology composed of interconnected TEGO layers and a well-defined multi-layered arrangement at the edge is shown in Fig. 4(d). The illustrative texture of post-activated TEGO at different visualization modes of the interactive 3D surface plot is created. This image clearly indicates that the porous morphology contains a distribution range from micro to mesopores in the red-outlined region. The pore texture of TEGOs is discussed in terms of their highly porous morphology with arbitrarily oriented and interconnected micro/mesopores. However, a statistically accurate quantitative study of the distribution of pore sizes using electron microscopy is difficult because all pores may not be visible in a given image owing to the 3D structure of these tiny pores.
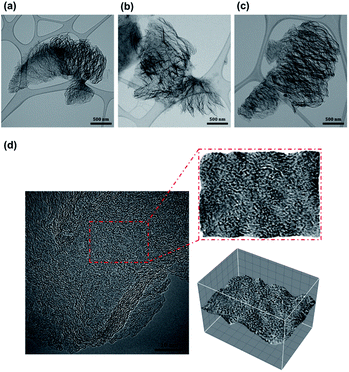 | ||
| Fig. 4 TEM images of TEGO (a), pre-activated TEGO (b), corresponding 3D reconstruction analysis of and post-activated TEGO (c and d). | ||
XRD was used to study the changes in GO structure owing to the thermal treatment and KOH activation. In Fig. 5(a), the diffraction pattern of GO shows a sharp peak at 11.28°, which corresponds to the (001) plane. The formation of GO is revealed by the increasing interlayer distance from 3.41 Å graphite stacking to 7.84 Å because of the oxygen functionalities on the graphene sheets during oxidation. The TEGO samples show a broad peak at 23.28° corresponding to the graphitic zone lattice (002), which suggests that the TEGOs were well-reduced. The interlayer spacing of TEGO was 3.82 Å, which was larger than that of graphite (3.34 Å). Fig. 5(b) demonstrates the correlation between interlayer distance, diffraction degree, and adsorbents. These changes in XRD patterns indicate a transition in the graphitic structure, which has been assigned to impregnation in KOH and are indications of the shift in interlayer spacing. We postulate that the activation process eliminates oxygen groups and activates TEGO, causing carbon atoms to reassemble, resulting in an expanded interlayer distance. No diffraction peaks were observed corresponding to the intercalation of alkali metal between the layered graphene. The XRD analysis revealed no evidence of an intercalation compound containing a periodic potassium penetration array between the formed graphene layers.35
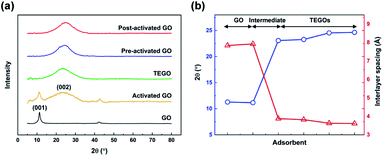 | ||
| Fig. 5 Diffractogram (a) and the corresponding between 2θ and interlayer spacing of graphene-based materials (b). | ||
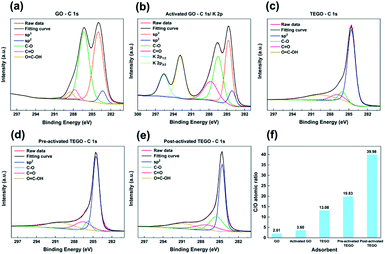
The chemical analysis and functional groups of the surfaces were analyzed using XPS. The influence of thermal treatment and activation of KOH on the chemical composition of GO, which was decomposed into oxygen functional groups followed by the rapid removal of formed gaseous products, was examined. In Fig. 6, a sharp peak at 284.6 eV corresponding to C–C bonds in a conjugated honeycomb lattice is shown in the C 1s peak of the as-prepared samples. The deconvolution of the C 1s peak revealed the presence of peaks corresponding to C–O (epoxy and hydroxyl groups) and C![[double bond, length as m-dash]](https://www.rsc.org/images/entities/char_e001.gif) O (carbonyl group) for oxygen-containing functional groups during oxidation at 286.4 and 287.8 eV, respectively, as given in Fig. 6(a). The C 1s region is shown in Fig. 6(b), with two new peaks between 292.6 and 295.9 eV in the a-GO spectra, which are identified as K 2p peaks.31 The intensity of oxygen-bound C components, particularly the peak of C–O in Fig. 6(c and e), rapidly reduced as the degree of GO reduction increased. The results indicated that the elimination of oxygen-containing functional groups by thermal exfoliation followed by KOH treatment was more effective. The C/O atomic ratio of GO was calculated from the XPS survey spectrum after reduction. Compared to GO, the corresponding C/O atomic ratio of TEGOs noticeably increased, as shown in Fig. 6(f). As the degree of GO reduction increased, the as-synthesized TEGOs were partly reconstructed by converting the dominant sp3 hybridized carbon atoms of GO to sp2 hybridized, which is present in graphitic carbons.36
O (carbonyl group) for oxygen-containing functional groups during oxidation at 286.4 and 287.8 eV, respectively, as given in Fig. 6(a). The C 1s region is shown in Fig. 6(b), with two new peaks between 292.6 and 295.9 eV in the a-GO spectra, which are identified as K 2p peaks.31 The intensity of oxygen-bound C components, particularly the peak of C–O in Fig. 6(c and e), rapidly reduced as the degree of GO reduction increased. The results indicated that the elimination of oxygen-containing functional groups by thermal exfoliation followed by KOH treatment was more effective. The C/O atomic ratio of GO was calculated from the XPS survey spectrum after reduction. Compared to GO, the corresponding C/O atomic ratio of TEGOs noticeably increased, as shown in Fig. 6(f). As the degree of GO reduction increased, the as-synthesized TEGOs were partly reconstructed by converting the dominant sp3 hybridized carbon atoms of GO to sp2 hybridized, which is present in graphitic carbons.36
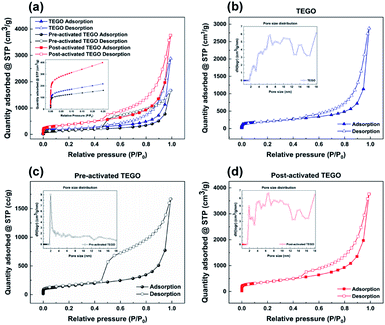
This highly porous structure, which combines various pore textures in nanocarbons, can achieve excellent efficiency with highly efficient mass transport and a large SSA from micro to mesopores, demonstrating the excellent potential for BTX removal. The analysis of N2 adsorption–desorption isotherm measured at 77 K is the most used method for determining the SSA and porosity characteristics of the samples. In the relative pressure (P/P0) range, the SSAs were determined from 0.1 to 0.3 using the Brunauer–Emmett–Teller (BET) method for the N2 adsorption/desorption isotherms of the as-synthesized samples. The N2 adsorption–desorption isotherms of TEGOs show a mix of type I and type IV characteristics according to the IUPAC classification,37 as presented in Fig. 7, with apparent hysteresis loops indicating the presence of mesopores. The inset of Fig. 7(a) shows the relative pressure P/P0 below 0.01. Pre- and post-activated TEGO exhibited a steep uptake and eventually saturated to adsorption stage, suggesting the presence of a large number of micropores. The micro/mesopores of TEGOs were revealed by the N2 adsorption–desorption isotherms and corresponding pore size distribution determined by the density functional theory, assuming a slit pore geometry, which indicates that the graphene-based adsorbents consist of well-defined micro to mesopores, as shown in Fig. 7(b–d). It is possible that the interlayer spaces are occupied with functional groups, resulting in negligible N2 uptake up to 1 bar of relative pressure, whereas thermally exfoliated GO shows an increase in N2 uptake at higher relative pressures, which could be due to a large hysteresis loop as given in Fig. S2.†38
Based on the data in Table S1,† the highly wrinkled nature of TEGOs offers large SSAs (SBET) of 692.44, 517.87, and 1261.46 m2 g−1, and total pore volumes (Vp) of 2.51, 2.60, 2.64 cm3 g−1, for TEGO as well as pre- and post-activated TEGO, respectively. After activation, the SSA and pore volume of the TEGOs prepared under the same conditions increased significantly. Pore volume in the TEGOs adsorbent was shown to correspond to the mass transfer of adsorbate into the adsorbent. It may be concluded that mass transfer leads to increased adsorption capacity, and thus, more BTX molecules can be absorbed.39 These observations prove that KOH is an effective activating agent for the development of graphene planes with a significant number of nanopores. Considering porous graphene-based adsorbents, the accessible surface areas of the BTX molecules of graphene-based adsorbents are significant owing to their high removal performance.
Reaction mechanism of KOH activation and thermal exfoliation of GO
KOH activation and thermal exfoliation of GO contributed to the formation of pre- and post-activated TEGO with enhanced SSA and porosity properties, as shown in Fig. 7. The area of interaction with BTX molecules increased with an increase in the adsorbent surface area. During this process, the graphene matrix was effectively etched, which resulted in increased of porosity.40 The intercalation of potassium into the carbon network during activation forms micro and mesopores. This is due to the formation of pores, which accelerates carbon loss as a result of metallic potassium ion intercalation into the carbon network.41 Pore formation occurs in a sequence of chemical reactions, resulting in a variety of intermediates.26,42 It is suggested that the reaction with carbon is a thermochemical process, as follows:At approximately 400 °C:| 2C + 6KOH → 2K + 2K2CO3 + 3H2 |
| K2CO3 → K2O + CO2 |
| CO2 + C → 2CO |
| K2CO3 + 2C → 2K + 3CO |
BTX removal performance
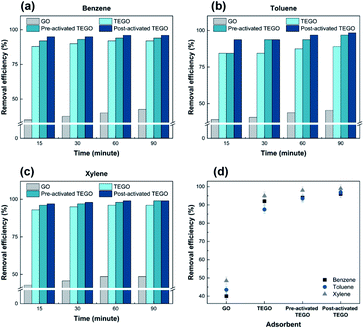
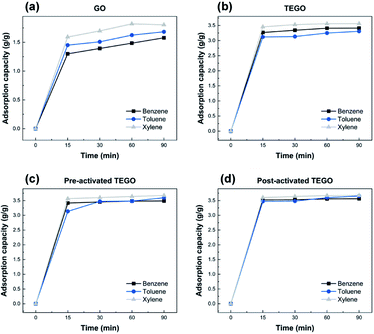
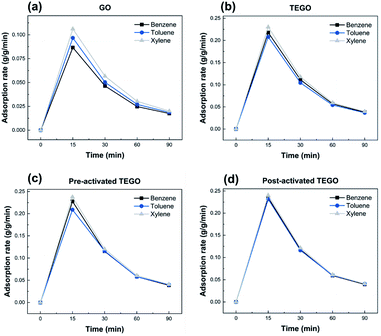
As given in Fig. 8–10, the removal behaviors of individual TEGO adsorbents with the BTX gases phase in nitrogen were recorded. The fast phase accounted for almost all BTX uptake, with the slow phase contributing to the remaining BTX before the adsorption reached equilibrium. The fast phase is where the adsorption process begins, and there were a large number of adsorption sites available to interact with the BTX molecules, as shown in Fig. 8(a–c).The adsorption rate was extremely high for the first 15 min, then it gradually reduced from 15 to 90 min before reaching equilibrium. For TEGO adsorbents, a fast adsorption rate was confirmed, in which the removal of BTX compounds was approximately 88 ± 2% within 15 min. The layered structure and pore texture of the TEGOs may explain their fast adsorption. Consequently, the maximum adsorption performance achieved by post-activated TEGO for o-xylene was approximately 98 ± 2% as clearly can be observed in Fig. 8(d), which was related to the above-mentioned adsorbent characterization. The experimental results indicated that 60 min was moderate to reach equilibrium for the concentration of the selected adsorbate. Because the accessibility of adsorption regions on graphene varied for the molecules of different sizes, the sieving effect played an important role in the removal performance.
In Fig. 9(a–d), the removal capability of BTX on TEGOs is 3.31 to 3.68 ± 0.02 g g−1, respectively. The removal of BTX by TEGOs was faster at the initial stage and gradually decreased with time until saturation. This is due to the diffusion of aromatic compounds through the internal pores of the adsorbents with high SSA and porosity. Over time, the availability of π-electron molecular assemblies decreases, resulting in a decrease in π–π stacking interactions, which extends the time to achieve equilibrium.43 Thus, the adsorption rate decreases as clearly can be observed in Fig. 10(a–d).
Inspired by the KOH activation mechanism, nanometer-sized pores in the graphene layered network were produced at a temperature of 800 °C under argon flow. The SSA of TEGOs, which determines the molecule accessible surface area of the graphene adsorbent, was significant for high removal efficiency. The intermolecular gravitation, van der Waals force, or diffusion force may be attributed to physical adsorption. Mass transfer from the gas phase into the surface of the adsorbent via convection, dispersion, and particle diffusion occurs during the external surface adsorption stage. BTX molecules enter the internal surface through pore diffusion during the internal diffusion phase. The dominating factors are the pore structure and volume of the adsorbent.23 Using toluene as a target pollutant molecule, Yang et al. have carried out an investigation on five distinct ACs with various origins and pore structures. The authors divided the whole adsorption process into three stages: surface adsorption, particle diffusion, and equilibrium phase. Surface area is a factor in external surface adsorption. Particle diffusion, on the other hand, is a process that is influenced by pore structure and volume.44 In addition, the adsorption sites provided open-layered graphitic domains with an increase in the degree of reduction and facilitated their excellent hydrophobic surface, making it a revolutionary adsorbent. The accessible graphene adsorption sites were mostly supplied by the hydrophobic surface of the π-conjugated systems on graphene.45 It has been demonstrated that π–π stacking interactions were also responsible for the strong adsorption of aromatic molecules onto the TEGO surface. Therefore, the BTX adsorption on TEGOs was a physisorption mechanism, which is consistent with the previous inference that, the contact between the BTX and TEGO surface was mainly due to the π–π stacking interaction. The graphene surface is polarizable and can attract π-acceptors to the electron-rich regions near the edges and π-donors to the electron-poor core regions.46 However, the influence of the chemical structure of aromatic compounds on the adsorption mechanism in relation to the investigated adsorbates. In addition, there is a possibility that CH⋯π interactions occur along the edge of graphene, which may be terminated by a hydrogen atom or phenyl rings aligned perpendicular to the surface of TEGOs.47 At this point, BTX molecules show a strong tendency to interact with TEGOs via π–π stacking of interactions rather than CH⋯π interactions.48 On the other hand, the capacity of adsorption was mostly driven by the ability to π–π stacking aromatic compounds. van der Waals, electrostatic interactions, and hydrogen bonding may contribute to the adsorption of aromatic compounds but are not significant role in adsorption capacity.46 The access of BTX molecules was enhanced by the porous and fluffy layered structure, which improved adsorption performance. Due to their high porosity, high SSA, and distinctive structure, TEGOs performed exceptionally well. However, given the complex procedures required in the synthesis of MOFs and related materials, TEGOs appear to be a promising option for cost-effective and large-scale environmental applications. Nanocarbon materials with superior chemical and structural stability, adjustable pore structure, and large surface area are particularly appealing in this approach. We believe that our new findings on the BTX gases removal characterization of highly porous carbon derived from activated graphene, obtained from thermally exfoliated and controlled KOH activation conditions, will fascinate significant benefit to the development of such materials from other readily available and inexpensive carbon precursors to effectively treat VOCs.
Conclusions
Pre- and post-activated TEGO were successfully synthesized using an integrated approach consisting of thermal exfoliation followed by KOH activation. The adsorbent characteristics were analyzed using SEM, TEM, XRD, XPS, and N2 adsorption–desorption isotherms. A self-designed BTX gases adsorption apparatus was developed to evaluate the removal performance of TEGOs as an effective adsorbent for BTX, the representative VOCs pollutant. The significant elimination of oxygen-containing functional groups from the GO surface facilitated the supply of more powerful π–π stacking interactions to aromatic molecules on the TEGO surface. Such a porous and fluffy layered structure facilitated the access of BTX molecules and increased the adsorption performance. Excellent performance was exhibited by TEGOs owing to the high porosity, large SSA, and unique structure. Owing to their outstanding adsorption efficiency for BTX, TEGOs are promising adsorbents for VOC treatment. It is important to clearly comprehend the relationship between the TEGO framework and resulting properties to effectively build up the TEGO content for meeting the application requirements.Author contributions
Thi To Nguyen Vo: conceptualization, experiment, writing – reviewing and editing. Sun Taek Lim: methodology, validation. Ji Hoon Kim: investigation. Gyu Hyeon Shim: visualization. Koung Moon Kim: investigation. Boyeon Kweon: resources. Miyeon Kim: resources. Chang Yeon Lee: investigation. Ho Seon Ahn: supervision.Conflicts of interest
There are no conflicts to declare.Acknowledgements
This research was supported by the Incheon Green Environment Support Center of Korea (IGEC, 2021).Notes and references
- B. Edokpolo, Q. J. Yu and D. Connell, Int. J. Environ. Res. Public Health, 2014, 11, 6354–6374 CrossRef PubMed.
- S. T. Lim, J. H. Kim, C. Y. Lee, S. Koo, D. W. Jerng, S. Wongwises and H. S. Ahn, Sci. Rep., 2019, 9, 10922 CrossRef PubMed.
- J. M. Kim, J. H. Kim, C. Y. Lee, D. W. Jerng and H. S. Ahn, J. Hazard. Mater., 2018, 344, 458–465 CrossRef CAS PubMed.
- M. A. Campesi, C. D. Luzi, G. F. Barreto and O. M. Martínez, J. Environ. Manage., 2015, 154, 216–224 CrossRef CAS PubMed.
- D. Delimaris and T. Ioannides, Appl. Catal., B, 2008, 84, 303–312 CrossRef CAS.
- C. Yang, G. Miao, Y. Pi, Q. Xia, J. Wu, Z. Li and J. Xiao, Chem. Eng. J., 2019, 370, 1128–1153 CrossRef CAS.
- H. Jiang, X. Xu, R. Zhang, Y. Zhang, J. Chen and F. Yang, RSC Adv., 2020, 10, 5116–5128 RSC.
- L. Yu, L. Wang, W. Xu, L. Chen, M. Fu, J. Wu and D. Ye, J. Environ. Sci., 2018, 67, 171–178 CrossRef CAS PubMed.
- W. Zhang, G. Li, H. Yin, K. Zhao, H. Zhao and T. An, Environ. Sci.: Nano, 2021, 9, 81–104 RSC.
- K. J. Kim and H. G. Ahn, Microporous Mesoporous Mater., 2012, 152, 78–83 CrossRef CAS.
- S. E. Lehman and S. C. Larsen, Environ. Sci.: Nano, 2014, 1, 200–213 RSC.
- F. Tian, X. Zhang and Y. Chen, RSC Adv., 2016, 6, 31214–31224 RSC.
- N. A. Khan, Z. Hasan and S. H. Jhung, J. Hazard. Mater., 2013, 244–245 Search PubMed.
- A. Chowdhury, S. K. Das, S. Mondal, S. Ruidas, D. Chakraborty, S. Chatterjee, M. K. Bhunia, D. Chandra, M. Hara and A. Bhaumik, Environ. Sci.: Nano, 2021, 8, 2641–2649 RSC.
- L. Qie, W. Chen, H. Xu, X. Xiong, Y. Jiang, F. Zou, X. Hu, Y. Xin, Z. Zhang and Y. Huang, Energy Environ. Sci., 2013, 6, 2497–2504 RSC.
- W. Wei, W. Chen, L. Mi, J. Xu and J. Zhang, J. Mater. Chem. A, 2021, 9, 23860–23872 RSC.
- C. Perego and R. Millinib, Chem. Soc. Rev., 2013, 42, 3956–3976 RSC.
- Z. Wu, L. Li, J. M. Yan and X. B. Zhang, Adv. Sci., 2017, 4, 1600382 CrossRef PubMed.
- A. K. Geim and K. S. Novoselov, Nat. Mater., 2007, 6, 183–191 CrossRef CAS PubMed.
- A. M. Dimiev and S. Eigler, Graphene Oxide: Fundamentals and Applications, 2016 Search PubMed.
- J. H. Kim, G. H. Shim, T. T. N. Vo, B. Kweon, K. M. Kim and H. S. Ahn, RSC Adv., 2021, 11, 3645–3654 RSC.
- S. You, S. M. Luzan, T. Szabó and A. V. Talyzin, Carbon, 2013, 52, 171–180 CrossRef CAS.
- L. Zhu, D. Shen and K. H. Luo, J. Hazard. Mater., 2020, 389, 122102 CrossRef CAS PubMed.
- V. K. Saini and J. Pires, J. Environ. Sci., 2017, 55, 321–330 CrossRef CAS PubMed.
- B. Dou, Q. Hu, J. Li, S. Qiao and Z. Hao, J. Hazard. Mater., 2011, 186, 1615–1624 CrossRef CAS PubMed.
- M. A. Lillo-Ródenas, D. Cazorla-Amorós and A. Linares-Solano, Carbon, 2003, 41, 267–275 CrossRef.
- S. Wu, G. Chen, N. Y. Kim, K. Ni, W. Zeng, Y. Zhao, Z. Tao, H. Ji, Z. Lee and Y. Zhu, Small, 2016, 12, 2376–2384 CrossRef CAS PubMed.
- L. L. Zhang, X. Zhao, M. D. Stoller, Y. Zhu, H. Ji, S. Murali, Y. Wu, S. Perales, B. Clevenger and R. S. Ruoff, Nano Lett., 2012, 12, 1806–1812 CrossRef CAS PubMed.
- D. C. Marcano, D. V. Kosynkin, J. M. Berlin, A. Sinitskii, Z. Sun, A. Slesarev, L. B. Alemany, W. Lu and J. M. Tour, ACS Nano, 2010, 4, 4806–4814 CrossRef CAS PubMed.
- W. S. Hummers and R. E. Offeman, J. Am. Chem. Soc., 1958, 80, 1339 CrossRef CAS.
- Y. Zhu, S. Murali, M. D. Stoller, K. J. Ganesh, W. Cai, P. J. Ferreira, A. Pirkle, R. M. Wallace, K. A. Cychosz, M. Thommes, D. Su, E. A. Stach and R. S. Ruoff, Sci. 80, 2011, 332, 1537–1541 CrossRef CAS PubMed.
- N. R. Abdul Manap, R. Shamsudin, M. N. Maghpor, M. A. Abdul Hamid and A. Jalar, J. Environ. Chem. Eng., 2018, 6, 970–983 CrossRef CAS.
- A. Fasolino, J. H. Los and M. I. Katsnelson, Nat. Mater., 2007, 6, 858–861 CrossRef CAS PubMed.
- C. Botas, P. Álvarez, C. Blanco, R. Santamaría, M. Granda, M. D. Gutiérrez, F. Rodríguez-Reinoso and R. Menéndez, Carbon, 2013, 52, 476–485 CrossRef CAS.
- R. Xue and Z. Shen, Carbon, 2003, 41, 1862–1864 CrossRef CAS.
- S. Stankovich, D. A. Dikin, R. D. Piner, K. A. Kohlhaas, A. Kleinhammes, Y. Jia, Y. Wu, S. B. T. Nguyen and R. S. Ruoff, Carbon, 2007, 45, 1558–1565 CrossRef CAS.
- M. Thommes, K. Kaneko, A. V. Neimark, J. P. Olivier, F. Rodriguez-Reinoso, J. Rouquerol and K. S. W. Sing, Pure Appl. Chem., 2015, 87, 1051–1069 CrossRef CAS.
- A. Ganesan and M. M. Shaijumon, Microporous Mesoporous Mater., 2016, 220, 21–27 CrossRef CAS.
- D. Chen, Z. Qu, Y. Sun and Y. Wang, Colloids Surf., A, 2014, 441, 433–440 CrossRef CAS.
- J. Shen, C. Yang, X. Li and G. Wang, ACS Appl. Mater. Interfaces, 2013, 5, 8467–8476 CrossRef CAS PubMed.
- T. S. Hui and M. A. A. Zaini, Carbon Lett., 2015, 16, 275–280 CrossRef.
- J. Wang and S. Kaskel, J. Mater. Chem., 2012, 22, 23710–23725 RSC.
- G. K. Ramesha, A. Vijaya Kumara, H. B. Muralidhara and S. Sampath, J. Colloid Interface Sci., 2011, 361, 270–277 CrossRef CAS PubMed.
- X. Yang, H. Yi, X. Tang, S. Zhao, Z. Yang, Y. Ma, T. Feng and X. Cui, J. Environ. Sci., 2018, 67, 104–114 CrossRef CAS PubMed.
- Z. Pei, L. Li, L. Sun, S. Zhang, X. Q. Shan, S. Yang and B. Wen, Carbon, 2013, 51, 156–163 CrossRef CAS.
- H. Tang, Y. Zhao, S. Shan, X. Yang, D. Liu, F. Cui and B. Xing, Environ. Sci. Technol., 2018, 52, 7689–7697 CrossRef CAS PubMed.
- V. Georgakilas, J. N. Tiwari, K. C. Kemp, J. A. Perman, A. B. Bourlinos, K. S. Kim and R. Zboril, Chem. Rev., 2016, 116, 5464–5519 CrossRef CAS PubMed.
- T. Kar, H. F. Bettinger, S. Scheiner and A. K. Roy, J. Phys. Chem. C, 2008, 112, 20070–20075 CrossRef CAS.
Footnote |
| † Electronic supplementary information (ESI) available. See https://doi.org/10.1039/d2ra01275h |
| This journal is © The Royal Society of Chemistry 2022 |

