 Open Access Article
Graphene nanosheet-sandwiched platinum nanoparticles deposited on a graphite pencil electrode as an ultrasensitive sensor for dopamine
Nadeem Baig b,
Abdel-Nasser Kawde
 *a,
Abdelaziz Elgamouz
 *a,
Mohamed Morsy
 c,
Ahmed Mohsen Abdelfattah
 d and
Rizafizah Othaman
 e
e
aDepartment of Chemistry, College of Sciences, University of Sharjah, P. O. Box 27272, United Arab Emirates. E-mail: akawde@sharjah.ac.ae
bInterdisciplinary Research Center for Membranes and Water Security, King Fahd University of Petroleum and Minerals, Dhahran 31261, Saudi Arabia
cChemistry Department, King Fahd University of Petroleum and Minerals, Dhahran 31261, Saudi Arabia
dDepartment of Architecture, King Fahd University of Petroleum & Minerals, Dhahran 31261, Saudi Arabia
ePolymer Research Center, Faculty of Science and Technology, Universiti Kebangsaan Malaysia, Bangi, Selangor 43600, Malaysia
First published on 12th January 2022
Abstract
An ultra-sensitive sensor of dopamine is introduced. The sensor is constructed by encapsulating platinum nanoparticles (PtNPs) between reduced graphene oxide (GR) nanosheets. The sandwiched PtNPs between GR layers acted as a spacer to prevent aggregation and provided a fine connection between the GR nanosheets to provide fast charge transfer. This specific orientation of the GR nanosheets and PtNPs on the graphite pencil electrode (GPE) substantially improved the electrocatalytic activity of the sensor. The synthesized graphene oxide and the fabricated sensor were comprehensively characterized by Fourier-transform infrared spectroscopy (FTIR), Raman spectroscopy, field emission-scanning electron microscopy (FE-SEM), electrochemical impedance spectroscopy (EIS), cyclic voltammetry (CV), and square wave voltammetry (SWV). The value of the charge transfer coefficient (α), apparent heterogeneous electron transfer rate constant (ks), and electroactive surface area for dopamine were found to be about 0.57, 8.99 s−1, and 0.81 cm2, respectively. The developed sensor is highly sensitive towards dopamine, and the detection limit is 9.0 nM. The sensor response is linear for dopamine concentration from 0.06 to 20 μM (R2 = 0.9991). The behavior of the sensor for dopamine in the presence of a high concentration of L(+) Ascorbic acid and other potential interferents was satisfactory. High recovery percentage between 90% and 105% in the human urine sample, good reproducibility, and facile fabrication of the electrode make it a good candidate for dopamine sensing.
1. Introduction
The sensing of dopamine (DA) in the human body has great importance. Dopamine is a vital neurotransmitter that belongs to the catecholamines family.1 Dopamine also contributes to the regulation of heartbeat and blood pressure.2 Dopamine is involved in the mobility, mood, and behavior of an individual.3 An abnormal dopamine level could cause severe problems in the human body like restless leg syndrome, attention deficit hyperactivity disorder, schizophrenia, senile dementia, and Parkinson's disease.4 The monitoring of catecholamines in the human urine could be used as a biomarker for renal and cardiovascular disease in patients.3 Due to the importance of dopamine, the developments of the new sensors for dopamine sensing are highly appreciated for clinical purposes.5,6Numerous methods are reported for the determination of dopamine; these are based on liquid chromatography-electrospray ionization mass spectrometry,7 capillary electrophoresis,8 HPLC-fluorescence based sensing,9 fluorescence.10,11 Although these methods are sensitive, some of them consume a lot of environmentally unfriendly chemicals, they are also costly, and multistep.8,12 Electrochemical techniques are considered simple, fast, cost-effective, less complex, and easy to handle than the other techniques. Apart from their simplicity, the sensing of dopamine by electrochemical methods is always challenging due to its close electrooxidation to ascorbic acid (AA) and uric acid (UA).10 This serious issue is addressed by electrode surface modification using various active electrochemical materials to achieve a well-resolved peak of dopamine.13,14 The modified electrodes like MgO nanobelts/GCE,15 Ag/CuO porous nanobelts,16 Ni-MOF/GCE,17 PA6/PAH-MWCNTs nanofibers/ITO,18 biomass-derived porous graphene19, and flake shaped CuO nanoparticles/MCPE20 were used for the sensing of dopamine.
The modification materials are widely used to improve selectivity, sensitivity and decrease charge transfer resistance.21 A range of advanced nanomaterials may include CNTs, noble metal nanoparticles, graphene, and their nanocomposite22 are used to improve the sensitivity of the electrodes. The graphene-based nanocomposite has gained great attraction due to its unique behavior. Graphene is a hexagonal honeycomb-like sp2 bonded two-dimensional carbon atom.23 Due to its excellent thermal and electrical conductivity, huge surface area, and mechanical strength, it is continuously studied in various fields like field emission displays, energy storage devices, conductors, and sensors fabrication. Graphene is an excellent electrode material due to its high electroactive surface area, wide potential window, and fast charge transfer.24 Many graphene-based sensors25 were successfully used like NiO–CuO/GR/GCE,26 rGO–Cu2O/GCE,27 Fe3O4–NH2@GS/GCE,28 and CoTPP-CRGO/GCE.29 On the other hand, platinum (Pt) nanocomposites display great potential for fabricating sensitive electrochemical sensors because of their excellent biocompatibility, high conductivity, electrocatalytic activity, and chemical stability.30,31
Based on Pt and graphene nanocomposite modified glassy carbon electrodes, few works have been reported to determine dopamine. A Pt/RGO/GCE for simultaneous determination of UA and DA was introduced by T. Xu et al. The electrode has displayed a perfect electrocatalytic activity in the presence of dopamine with a limit of detection (LOD) of 0.25 μM and limit of quantitation (LOQ) of 10 μM.32 The sensitivity of the Pt-based nanocomposite was further improved by J. Yan et al. using Pd–Pt nanoparticles anchored graphene sensor Pd3Pt1/PDDA-RGO/GCE. The LOQ and LOD were improved for dopamine to 4 and 0.04 μM.33 The Pt-GO hybrid film was electrodeposited on the microelectrode array and used to sense dopamine.34 In another work, the AuNPs-rGO-ITO and PtNPs-rGO-ITO were used to measure the dopamine in the presence of AA and UA.35 The casting method was used to deposit the Pt-based reduced graphene oxide nanocomposite on the GCE surface. The utilization of the Pt in the fabrication of the sensors is beneficial as it allows the sensor to withstand harsh conditions. It is well known that Pt has excellent electrical properties and superior corrosion resistance that make it highly valuable for electronic, petrochemical, and chemical applications.36 The disposable sensor is also receiving significant attention for dopamine sensing.37 Graphite pencil electrode (GPE) is famous for its facile renewable surface.38,39 Due to its unique features, the graphite pencil electrode is emerging as a powerful sensing tool.40,41
In this work, the graphite pencil electrode's sensitivity and selectivity improved by using the PtNPs based sandwich structure presented with an upper and a lower layer of reduced graphene oxide (GR). The specific arrangement of the new nanocomposite formed between PtNPs and graphene oxide on GPE has significantly improved the limit of quantitation to 6.0 × 10⁻² μM and the detection limit of dopamine to 9.0 × 10⁻³ μM, compared to the previously stated Pt-based graphene composite. Moreover, the direct electrochemical reduction of Pt2+ and graphene oxide (GO) on the surface of the electrode made the electrode fabrication fast, with no additional steps.
2. Materials and methods
2.1. Chemicals
Dopamine (C21H26N2S2·HCl, ≥98% by HPLC), L-(+)-methionine (C5H11NO2S, 99.5%), potassium chloride (KCl, 99.9%), sodium chloride (NaCl, ACS reagent, ≥99.0%), L-(+)-ascorbic acid (C6H8O6, ACS reagent, ≥99%), and D-(+)-Glucose (C6H12O6, ACS reagent, ≥99%) are obtained from Sigma-Aldrich (United States of America). Sodium dihydrogenorthophosphate monohydrate (NaH2PO4·H2O, ACS reagent, ≥98.0%) and di-potassium hydrogen orthophosphate (K2HPO4, 98%) are purchased from BDH (England). Graphite is purchased from Fischer Science Education (United States of America). L-(+)-Alanine (C3H7NO2, ≥99.0%) is purchased from Fluka (United States of America). Phosphate buffer saline (0.1 M PBS) is freshly prepared and used as the electrolyte to run all experiments. The chemicals used are of analytical grade. Double-distilled water is collected from Aquatron A 4000 D (England), a lab-based unit used in all experiments.2.2. Instrumentation and apparatus
Cyclic voltammetry (CV), square wave voltammetry (SWV), and electrochemical impedance spectroscopy (EIS), experiments are performed using Auto-Lab (Netherland). Three electrode systems is used and it consisted of Ag/AgCl as reference electrode, platinum wire as a counter electrode, and the developed GR/Pt/GR/GPE as working electrode. The GPE is used for blank experiments. The 7 mm length of the graphite pencil electrode is dipped into the relevant modifying material to obtain the modified electrode. The characteristics of the GPE were defined in detail in a previous work.42 The weight measurements of the various materials are performed by using the analytical balance GR-2000. The pH of solutions is fixed using freshly prepared buffer solutions and measured using Accumet® XL50 pH meter. TESCAN LYRA 3 instrument is used to capture the high magnification images of the newly prepared GR/Pt/GR/GPE and the bare GPE electrodes. FTIR and Raman spectra of the graphite and graphene oxide are performed at room temperature using a NICOLET 6700 FTIR spectrometer and Scientific LabRAM HR Evolution, respectively.2.3. Preparation of PtNPs sandwiched graphene layers GPE sensor
The proposed sensor is prepared by dipping the tip of the graphite pencil in 4.0 mg of graphene oxide suspended in 1.0 mL of distilled water and sonicated for 30 min; the GPE is subjected to a single cycle of CV recorded between −1.4 V and 0.3 V with a scan rate of 0.02 mV s−1, the first layer of graphene is deposited during this step. The electrode is cleaned by gently dipping it in distilled water, followed by a second CV scan between −0.05 V and 0.3 V at a scan rate of 0.01 mV s−1 in 0.1 mM (NH4)2PtCl4 solution. In this step, the Pt2+ is reduced on the GR/GPE surface. The second graphene layer used to sandwich Pt is deposited by repeating the first step. The prepared PtNPs sandwiched electrode (GR/Pt/GR/GPE) is dried in the oven at 50 °C and used to detect dopamine and interferents in aqueous solutions electrochemically.3. Results & discussions
3.1. Experimental conditions optimization
The sensitive part of the sensor is optimized by investigating the deposition sequence of graphene oxide and Pt on the GPE. The following deposition sequences were made: GPE, GPE/Pt, GPE/GR, GPE/Pt/GR, GPE/GR/Pt, GPE/GR/Pt/GR, and GPE/GR/Pt/GR/Pt. Deposition of graphene as the first layer was found to be more efficient than PtNPs. Afterward, GR/Pt/GR was found to give the maximum oxidizing current response for 0.2 mM dopamine compared to the other sequences (Fig. 1). The PtNPs were formed by the electrochemical reduction. The Pt2+ reduction window was optimized from −0.4–0.3 V to −0.05–0.3 V window; the highest response for 0.2 mM dopamine was obtained at this window scan.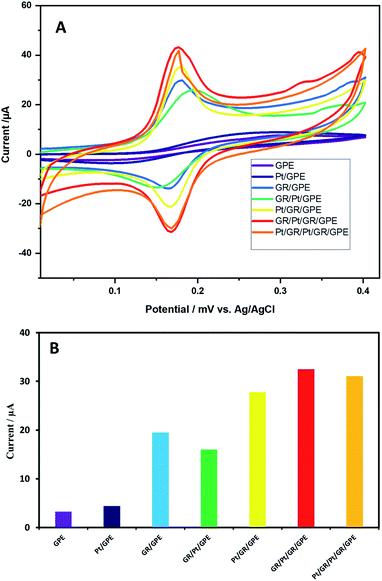 | ||
| Fig. 1 (A) Cyclic voltammograms and (B) Oxidizing peak current obtained from cyclic voltammetry scans of 0.2 mM dopamine in 0.1 M PBS (pH = 6.80) at various modified electrode surfaces. | ||
To optimize the reduction scan rate for Pt2+, scan rates are varied between 0.04 V s−1 and 0.005 V s−1; the optimum response is observed at 0.01 V s−1. Similarly, concentrations from 0.05 mM to 1.0 mM of (NH4)2PtCl4 solutions were used for the optimum electrochemical deposition of PtNPs on the GPE surface; 0.1 mM (NH4)2PtCl4 was found to be the most suitable concentration. Big-size nanoparticles and agglomeration can be produced at higher concentrations, which can affect the electrode sensitivity. All optimized conditions of the Pt2+ electrochemical reduction are applied to deposit PtNPs on the GPE surface. The graphene oxide optimized conditions were already described in detail in previous work.43
3.2. Characterization of synthesized graphene oxide and fabricated sensor
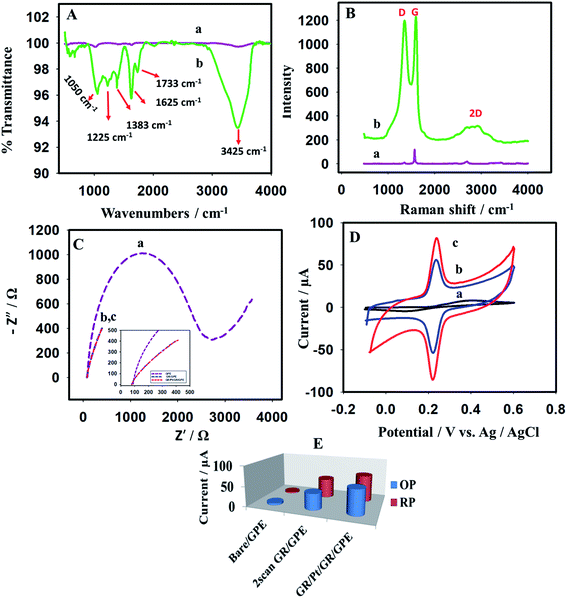
Hummers' method44 is used to synthesize the graphene oxide from graphite powder. FTIR and Raman spectra were performed to characterize the graphene oxide (Fig. 2). The characteristic FTIR and Raman spectra of the GO were obtained (Fig. 2A and B, respectively). The FTIR spectrum has shown the characteristic stretching vibrational of the GO. The peaks at 3425 cm−1, 1733 cm−1, and 1625 cm−1 are assigned to the –OH stretching vibrations, carboxylic C![[double bond, length as m-dash]](https://www.rsc.org/images/entities/char_e001.gif) O, and aromatic –C
O, and aromatic –C![[double bond, length as m-dash]](https://www.rsc.org/images/entities/char_e001.gif) C–, respectively.45 Moreover, the stretching vibrations at 1383 cm−1, 1225 cm−1, and 1050 cm−1 are assigned to the –C–O of the carboxylic acid, epoxy cycle, and alkoxy functional groups of the graphene oxide, respectively.46
C–, respectively.45 Moreover, the stretching vibrations at 1383 cm−1, 1225 cm−1, and 1050 cm−1 are assigned to the –C–O of the carboxylic acid, epoxy cycle, and alkoxy functional groups of the graphene oxide, respectively.46
The Raman spectra of the graphene oxide presented in Fig. 2B show two characteristic bands, D and G. The D band, which appeared at 1344 cm−1, is due to the defects in the structure, while the G band appeared at 1590 cm−1 is due to sp2 planner configuration.47 The ratio between the two bands was observed at 0.98. The 2D band appears at 2691 cm−1, considered an overtone of the D band. The characteristic Raman and IR spectra confirmed the successful preparation of graphene oxide from graphite.
The prepared graphene oxide is used to produce the graphene-based sensor. The interfacial behavior of the bare GPE, GR/GPE, and GR/Pt/GR/GPE is investigated by using EIS. The impedance of the bare or modified electrodes is measured in 5.0 mM K3Fe(CN)6/K4Fe(CN)6 solution. In the case of bare GPE, a large semicircle has been observed, and a high charge transfer resistance was observed at 2649 Ω (Fig. 2C, a). The charge transfer resistance (Rct) was significantly reduced in the case of GR/GPE (Fig. 2C, c) and the GR/Pt/GR/GPE (Fig. 2C, b), where no semicircles are observed. The impedance studies have revealed the reduced graphene oxide, and the PtNPs sandwiched reduced graphene oxide layered sensor have effectively improved the surface charge transfer of the graphite pencil electrode. Graphene can substantially help in overcoming the electrode charge transfer resistance.48
Similar behavior is observed when various electrodes are explored using cyclic voltammetry of 0.2 mM dopamine in 0.1 M PBS buffer (pH = 5.5). In the case of bare GPE, a broad dopamine peak appeared. The sensitivity of the bare electrode towards dopamine was poor, and it was the reason that small oxidation/reduction peak currents were observed (Fig. 2D, a). The electrochemically reduced graphene oxide on the GPE surface significantly improved the electrode's sensitivity; strong oxidation/reduction peak currents were observed for dopamine (Fig. 2D, b). Interestingly, the electrochemically formed PtNPs sandwiched between the reduced graphene oxide layers have a more beneficial impact on the sensitivity of the electrodes compared to the other arrangements of the PtNPs graphene nanocomposite. The enhancement in the current for the oxidizing and reducing peak was more prominent for GR/Pt/GR/GPE than GR/GPE and the bare GPE (Fig. 2D, c). The oxidation peak current (OP) and reduction peak current (RP) of 0.2 mM dopamine (0.1 M PBS, pH 5.5) on the surface of the different electrodes are shown in Fig. 2E. The PtNPs sandwiched between two graphene layers may have acted as a spacer, decreasing the tendency of PtNPs to agglomerate and enhancing the sensor's sensitivity. Therefore, the outer layer of PtNPs was not as effective as the inner layer (Scheme 1).
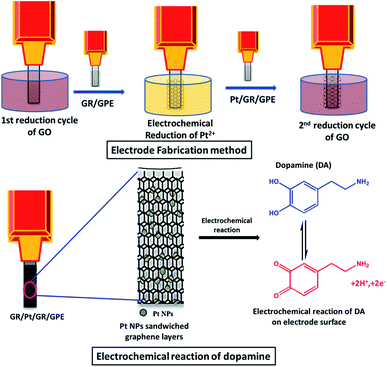 | ||
| Scheme 1 Schematic illustration of the fabrication of the PtNPs sandwiched graphene layers electrode and the electrochemical reaction of dopamine on the surface. | ||
Moreover, the morphology of the surface was analyzed by using FE-SEM. The FE-SEM images of the bare/GPE, GR/GPE, and GR/Pt/GR/GPE were recorded at a high magnification of 100 kx (Fig. 3). The FE-SEM images have shown the development of wrinkle-shaped graphene on the GPE surface (Fig. 3b), while this layer was absent in the case of bare GPE (Fig. 3a). Similarly, the sandwiched PtNPs were also formed electrochemically between two layers of graphene. PtNPs could be observed between graphene layers in SEM images (Fig. 3c). The PtNPs enhanced the sensor's sensitivity due to their small size and played the role of spacer between the graphene layers. In the SEM images, PtNPs was not much visible between the graphene layers. However, the visibility of the PtNPs was enhanced by using the backscattering electron beam (BSE), and a collected SEM image has shown the uniform distribution of the PtNPs in between the graphene layers (Fig. 4).
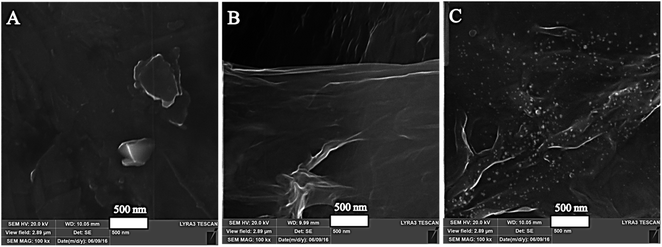 | ||
| Fig. 3 FE-SEM micrograph images at 100 kx magnification of the (A) bare/GPE, (B) GR/GPE and (C) GR/Pt/GR/GPE. | ||
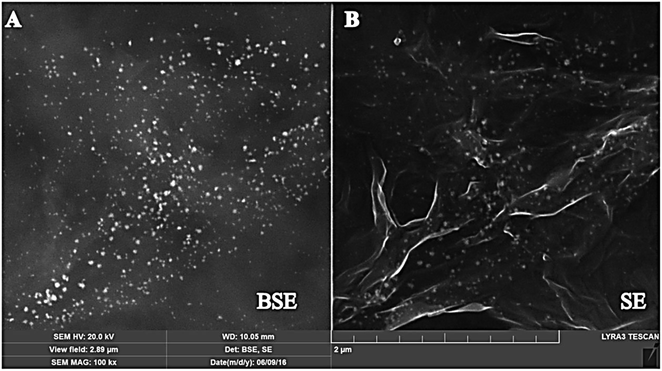 | ||
| Fig. 4 FE-SEM image of G.R./PtGR/GPE by using (A) backscattering electron beam (BSE) and (B) secondary electron beam (SE). | ||
3.3. Scan rate study
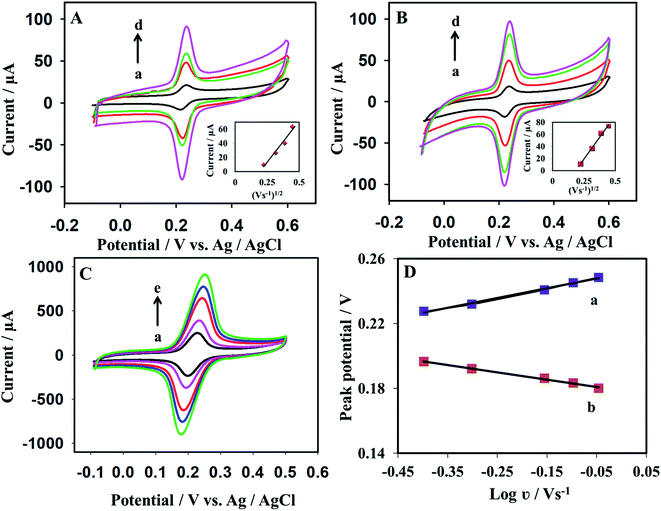
The scan rate effect on the cyclic voltammograms was investigated for the prepared sensors: GR/GPE and GR/Pt/GR/GPE. Voltammetric cycles were recorded for 0.2 mM dopamine in 0.1 M PBS buffer (pH = 5.5) at various scan rates spanning from 50 mV s−1 and 900 mV s−1. An increase in the scan rate resulted in a significant increase in the peak current of dopamine (Fig. 5A and B). The bare electrode, GR/GPE, and the GR/Pt/GR/GPE electroactive surface areas were determined at scan rates spanning between 50 to 200 mV s−1, using the Randles–Sevcik equation, represented in (1):49| Ip = 2.69 × 10⁵ν1/2n3/2CD1/2A | (1) |
In eqn (1), ν, n, C, D, and A are scan rates in V s−1, the number of electrons involved in the redox reaction, concentration in mol L−1, diffusion coefficient in cm2 s−1, electroactive surface area in cm2, respectively. Ip represents the peak current in (A). The dopamine diffusion coefficient value used was 5.40 × 10⁻⁶ cm2 s−1.50 The GR/GPE, and the GR/Pt/GR/GPE had shown the high electroactive surface area of 0.66 cm2 and 0.81 cm2, respectively, compared to the bare GPE electroactive surface area of 0.063 cm2 (data not shown). The significant enhancement of the electroactive surface area for GR/GPE is mainly due to the electrochemical grafting of graphene layers on the GPE surface. While the further enhancement of dopamine electroactive surface area for the GR/Pt/GR/GPE to 0.81 cm2 is mainly due to the sandwiched PtNPs in graphene layers, SEM micrographs indicated that PtNPs are successfully embedded in graphene layers.
At high scan rates varying between 400 mV s−1 and 900 mV s−1, the dopamine electrochemical response on the GR/Pt/GR/GPE working electrode was investigated. A linear relationship was obtained between peak potential shift and the logarithm of the scan rate (log![[thin space (1/6-em)]](https://www.rsc.org/images/entities/char_2009.gif) ν) for dopamine. In Fig. 5C, the positive and the negative peak shift could be observed for the anodic and the cathodic peak potentials. Two straight lines expressed by eqn (2) and (3) were yielded for the anodic peak and the cathodic peak potentials, respectively:
ν) for dopamine. In Fig. 5C, the positive and the negative peak shift could be observed for the anodic and the cathodic peak potentials. Two straight lines expressed by eqn (2) and (3) were yielded for the anodic peak and the cathodic peak potentials, respectively:
Epa (V) = 0.0603![[thin space (1/6-em)]](https://www.rsc.org/images/entities/char_2009.gif) log log![[thin space (1/6-em)]](https://www.rsc.org/images/entities/char_2009.gif) ν + 0.2508 (R2 = 0.9945) ν + 0.2508 (R2 = 0.9945)
| (2) |
Epc (V) = −0.0453![[thin space (1/6-em)]](https://www.rsc.org/images/entities/char_2009.gif) log log![[thin space (1/6-em)]](https://www.rsc.org/images/entities/char_2009.gif) ν + 0.1786 (R2 = 0.9957) ν + 0.1786 (R2 = 0.9957)
| (3) |
According to Laviron's theory,51 the slopes of the anodic and the cathodic peak potentials are equal to 2.3RT/(1 − α)nF and −2.3RT/αnF, respectively. Where α is the charge transfer coefficient obtained from eqn (4), a calculated value of 0.57 is found for α.
log![[thin space (1/6-em)]](https://www.rsc.org/images/entities/char_2009.gif) ka/kc = log ka/kc = log![[thin space (1/6-em)]](https://www.rsc.org/images/entities/char_2009.gif) α/1 − α α/1 − α
| (4) |
While the value of apparent heterogeneous electron transfer rate constant (ks) was obtained from a second Laviron's51 eqn (5).
log![[thin space (1/6-em)]](https://www.rsc.org/images/entities/char_2009.gif) ks = α ks = α![[thin space (1/6-em)]](https://www.rsc.org/images/entities/char_2009.gif) log log![[thin space (1/6-em)]](https://www.rsc.org/images/entities/char_2009.gif) (1 − α) + (1 − α)log (1 − α) + (1 − α)log![[thin space (1/6-em)]](https://www.rsc.org/images/entities/char_2009.gif) α − log(RT/nFν) − α(1 − α)nFΔEp/2.3RT α − log(RT/nFν) − α(1 − α)nFΔEp/2.3RT
| (5) |
In eqn (5), R, T, F, ν, n, and ΔEp represent the universal gas constant, temperature, Faraday constant, scan rate, number of electrons involved in the redox reaction, and the anodic and cathodic peak separation, respectively. The value of ks was found to be 8.99 s−1 ± 0.40. The ks value is higher than previously reported literature, such as 1.59 s−1,52 2.09 s−1,53 and 1.63 s−1.54 The higher ks values of the sandwiched PtNPs graphene layered modified GPE indicate the fast charge transfer during the electrochemical reaction.
Moreover, the surface coverage (Γ)55 was calculated for dopamine by using eqn (6) on the electrode surface of GR/GPE or G.R./Pt/GR/GPE:
| Γ = Ip4RT/n2F2Aν | (6) |
The surface coverage was calculated for 1.0 mM dopamine for GR/GPE and the GR/Pt/GR/GPE. Surface coverages of 7.107 × 10⁻¹⁰ and 8.909 × 10⁻¹⁰ mol cm−2 are found for GR/GPE and the GR/Pt/GR/GPE, respectively. The surface coverage of the bare GPE is found to be 4.721 × 10⁻¹⁴ mol cm−2. The massive increase in surface area coverage for GR/GPE compared to the bare surface is mainly due to the PtNPs sandwiched graphene layers, which might directly affect the surface area.
3.4. pH study of the electrolyte
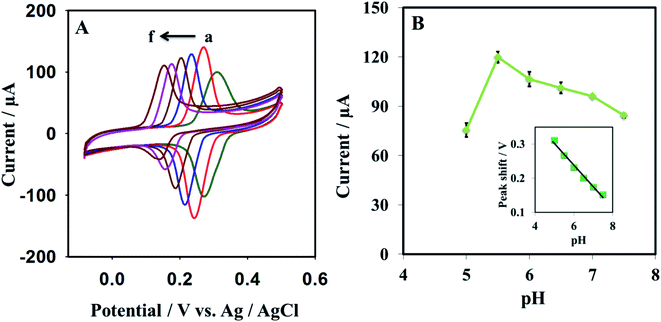
The pH effect was investigated using cyclic voltammetry; the pH of the sensing medium was varied from 5.0 to 7.5 (Fig. 6). The result was analyzed for 0.5 mM dopamine in 0.1 M PBS buffer. The oxidation/reduction current of dopamine is found to increase with pH increase from 5.0 to 5.5; on a further rise in the pH from 5.5 to 7.5, a decline in the oxidation/reduction current of dopamine is observed (Fig. 6B). The fluctuation (error bar) of the sensor against each concertation were recorded by repeating the measurement 3 times. Moreover, a negative peak shift was observed with increasing pH, which indicates protons transfer during the sensing of dopamine on the electroactive surface. It was also noted that at pH ≤5.5, the oxidation/reduction current of dopamine suddenly decreased, and peak broadness was observed. A linear relationship between pH and peak potential was found. The slope was −57.5 mV pH−1 (R2 = 0.9918) for pHs varying between 5.5 and 7.5, while a slope of −63.2 mV pH−1 was found for pHs ranging between 5.0 and 5.5 (R2 = 0.9855), at pH lower than 5.5, the peak became broad.The slope −57.5 mV pH−1 is closer to the theoretical slope of −59 mV pH−1 (eqn (7)). It is revealed that an equal number of protons and electrons are involved in the electrochemical reaction of dopamine on the surface of GR/Pt/GR/GPE.
| E vs. Ag/AgCl = 579.3–57.5 [pH] (R2 = 0.9918) | (7) |
3.5. Optimization of the sensing technique
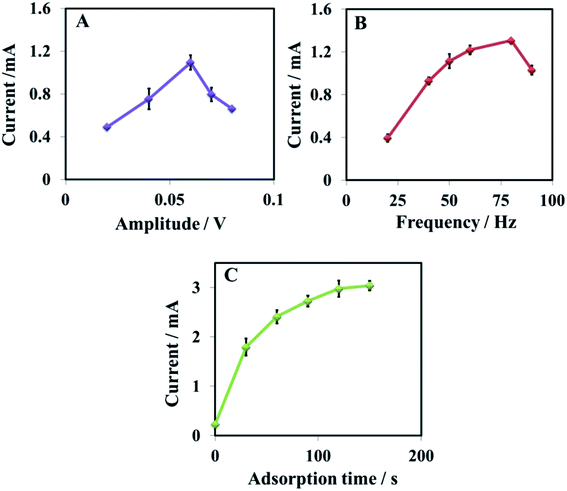
Among the voltammetric technique, the SWV was found to be more sensitive for sensing dopamine, and it was used for sensing dopamine. Attempts to enhance the sensitivity of the developed sensor have been made by optimizing different parameters of the SWV technique. First, the amplitude is optimized. By varying the voltage from 0.02 V to 0.08 V for 20 μM dopamine in PBS (0.1 M, pH = 5.5) (Fig. 7A). The amplitude has shown a significant impact on the peak current, and the maximum response was observed at 0.06 V, which decreased with a further increase in the voltage. Similarly, frequency and adsorption time are optimized using 10 μM dopamine in PBS buffer. The frequency is optimized between 20 and 90 Hz, the best response is observed at 80 Hz (Fig. 7B). The adsorption time has displayed a substantial impact on the peak current, indicating that the GR/Pt/GR/GPE has a strong ability to adsorb dopamine. The current improved sharply as the adsorption time increased and became almost constant after 120 s. The optimized parameters were used for further study.3.6. Detection of dopamine, reproducibility, and limit of detection
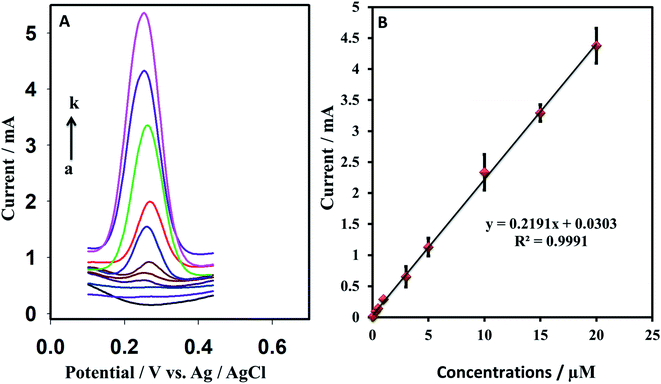
Various dopamine concentrations in 0.1 M PBS buffer at pH = 5.5 were detected using the SWV optimized conditions found previously: 0.06 V amplitude, 80 Hz frequency, and 120 s adsorption time. The developed GR/Pt/GR/GPE has shown exceptional sensitivity towards dopamine. The linear range was observed from 0.06 to 20 μM. A linear equation was yielded by the calibration curve: I (mA) = 0.2191CDA (μM) + 0.0303 with a regression coefficient R2 = 0.999. An error bar is added to the calibration curve by repeating each concentration measurement 3 times (Fig. 8). The developed sensor has shown an excellent limit of quantitation of 0.06 μM and a limit of detection of 0.009 μM. The sensitivity, LOQ, and LOD are much better or comparable to reported graphene nanocomposite modified sensors given in Table 1. The developed sensor could be a promising candidate for trace level quantitation of dopamine.| Sr# | Electrodes | Technique | Medium/pH | LOQ (μM) | LOD (μM) | Application | Ref |
|---|---|---|---|---|---|---|---|
| a GS: graphene sheets, Nf: Nafion, PIL: poly(ionic liquids), PPy: polypyrrole, GO: graphene oxide, GR: graphene, N-G: nitrogen-doped graphene nickel, NiTsPc: tetrasulfonated phthalocyanine, Trp: tryptophan, CILE: carbon ionic liquid electrode, AgNWs: silver nanowires, SPCEs: screen-printed carbon electrodes; Ta: tantalum wire, CRGO: chemically reduced graphene oxide, CoTPP: cobalt tetraphenylporphyrin, mp-GR: multi-nanopore graphene, GO-P5A: graphene oxide decorated with per-hydroxylated pillar[5]arene, PDDA: poly(diallyldimethylammonium chloride). | |||||||
| 1 | Au/Gr-AuAg | SWV | PB/6.0 | 0.3 | 0.205 | NA | 57 |
| 2 | GS@Mn3O4/Nf/GCE | Amperometry | 0.1 M PB/4.5 | 1 | 0.08 | Injection | 58 |
| 3 | PILs/PPy/GO/GCE | DPV | 0.05 M PB/4.0 | 4 | 0.0733 | NA | 59 |
| 4 | NiO–CuO/GR/GCE | SWV | 0.1 M PB/8.0 | 0.5 | 0.167 | Blood serum | 26 |
| 5 | N-G/NiTsPc/GCE | Amperometry | PB/7.4 | 0.1 | 0.1 | NA | 60 |
| 6 | rGO–Cu2O/GCE | DPV | 0.1 M PBS/7.0 | 10 | 0.05 | Human urine, blood | 27 |
| 7 | Fe3O4–NH2@GS/GCE | DPV | 0.1 M PB/7.0 | 0.2 | 0.126 | Injection | 28 |
| 8 | GR–SnO2/CILE | DPV | 0.1 M PBS/6.0 | 0.5 | 0.13 | Injection | 61 |
| 9 | Trp-GR/GCE | DPV | 0.1 M PBS/7.0 | 0.5 | 0.29 | Urine, serum, Injection | 62 |
| 10 | GR/GPE | DPV | 0.01 M PBS/7.4 | 4 | 2.64 | 63 | |
| 11 | AgNW/rGO/SPCEs | LSV | 0.1 M PB/7.4 | 40 | 0.26 | NA | 64 |
| 12 | MgO/Gr/Ta | DPV | 0.1 M PB/5.0 | 0.1 | 0.15 | Human serum | 65 |
| 13 | CoTPP-CRGO/GCE | DPV | 0.1 M PB/6.5 | 0.1 | 0.03 | Urine, serum | 29 |
| 14 | mp-GR/GCE | DPV | 0.1 M PB/6.5 | 4 | 1.5 | Human serum | 56 |
| 15 | RGO-P5A/GCE | DPV | 0.2 MHAc-NaAc/4.0 | 1 | 0.2 | NA | 66 |
| 16 | Pd3Pt1/PDDA-RGO/GCE | DPV | 0.1 M PB/7.4 | 4 | 0.04 | Human urine, serum | 33 |
| 17 | Pt/RGO/GCE | DPV | 0.1 M P/7.0 | 10 | 0.25 | NA | 32 |
| 18 | GR/Pt/GR/GPE | SWV | PBS/5.5 | 0.06 | 0.009 | Human urine | This work |
The sensor reproducibility was evaluated by preparing five GR/Pt/GR/GPE sensors under the same conditions for the sensing of dopamine. A slight current variation was observed, and the RSD of the prepared sensors was found to be 5.49%. The RSD value suggested that developed sensor reproducibility was entirely satisfactory.
3.7. Real sample analysis and the study of the interference
The GR/Pt/GR/GPE sensor was used to find dopamine in a human urine sample. Direct measurement of dopamine in the urine sample revealed its absence, and recovery measurements were made by spiking various concentrations of dopamine of 3, 5, 6, and 7 μM. Good recovery percentages were obtained in the range of 90.0 to 105% (Table 2). The dopamine response is also evaluated in the existence of a higher concentration of 0.5 mM L(+)-ascorbic acid; a slight current variation of ±3.80 was observed for 5.0 μM dopamine. Ten times higher concentration of other possible interferents like L-(+)-alanine, adenine, D-(+)-glucose, L(+)-methionine, and some ionic species such as Na+, K+, Ca2+, Co2+, and Cl− has shown current variation in the range of ±0.53 to ±9.38%. The good recoveries and small current changes in the presence of potential interferents have shown that developed electrodes can behave well in the presence of the interferences.| Sr# | Found (μM) | Added (μM) | Recovered (μM) | % recovery |
|---|---|---|---|---|
| 1 | 0 | 3 | 2.96 | 98.6 |
| 2 | 0 | 5 | 4.50 | 90.0 |
| 3 | 0 | 6 | 6.31 | 105 |
| 4 | 0 | 7 | 6.77 | 96.7 |
The comparison of the figure of merits of the GR/Pt/GR/GPE has shown that unique nanostructures produced on the surface of the GPE are highly sensitive towards dopamine (Table 1). For instance, the detection limit with a various graphene-based sensors such as NiO–CuO/GR/GCE,26 Fe3O4–NH2@GS/GCE,28 mp-GR/GCE,56 and Pt/RGO/GCE,32 was observed 0.167 μM, 0.126 μM, 1.5 μM and 0.25 μM, respectively. The LOD observed with the developed sensor was about 9 nM which has shown the significance of the sensor. This discussion demonstrated that the sandwiched structure effectively achieves improved performance while sensing dopamine.
4. Conclusion
A sensitive sensor has been fabricated based on PtNPs sandwiched graphene layered modified GPE. The fabrication of the sensor is very facile, and the inherent character of the GPE can give it a disposable character. The presence of PtNPs in the graphene layers significantly enhanced the electrocatalytic oxidation of dopamine. The fabricated sensor was found sensitive compared to other dopamine sensors, and the detection limit was achieved at 9 nM. The sensor response was linear from 0.06 to 20 μM (R2 = 0.9991). The value of α and ks was found 0.57 and 8.99 s−1, respectively. The developed sensor has shown high sensitivity, fast charge transfer response, facile fabrication, good reproducibility, and disposability. These characteristics make it a unique and promising candidate for trace level quantitation of dopamine.Conflicts of interest
There are no conflicts to declare.Acknowledgements
The authors would like to acknowledge the support from the Pure and Applied Chemistry Research Group, the Research Institute of Sciences and Engineering (RISE), University of Sharjah.References
- Y. Wang, Y. Zhang, C. Hou and M. Liu, Microchim. Acta, 2016, 183, 1145–1152 CrossRef CAS
.
- H.-X. Zhao, H. Mu, Y.-H. Bai, H. Yu and Y.-M. Hu, J. Pharm. Anal., 2011, 1, 208–212 CrossRef CAS PubMed
.
- A. Hammami, R. Sahli and N. Raouafi, Microchim. Acta, 2016, 183, 1137–1144 CrossRef CAS
.
- Z. Guo, M.-L. Seol, M.-S. Kim, J.-H. Ahn, Y.-K. Choi, J.-H. Liu and X.-J. Huang, Analyst, 2013, 138, 2683–2690 RSC
.
- M. Wang, L. Bai, L. Zhang, G. Sun, X. Zhang and S. Dong, Analyst, 2016, 141, 2447–2453 RSC
.
- J. X. Liu and S. N. Ding, J. Electroanal. Chem., 2016, 781, 395–400 CrossRef CAS
.
- H. R. Kim, T.-H. Kim, S.-H. Hong and H.-G. Kim, Biochem. Biophys. Res. Commun., 2012, 419, 632–637 CrossRef CAS PubMed
.
- Y. Li, H. Song, L. Zhang, P. Zuo, B. ce Ye, J. Yao and W. Chen, Biosens. Bioelectron., 2016, 78, 308–314 CrossRef CAS PubMed
.
- H.-X. Zhao, H. Mu, Y.-H. Bai, H. Yu and Y.-M. Hu, J. Pharm. Anal., 2011, 1, 208–212 CrossRef CAS PubMed
.
- S. Pruneanu, A. R. Biris, F. Pogacean, C. Socaci, M. Coros, M. C. Rosu, F. Watanabe and A. S. Biris, Electrochim. Acta, 2015, 154, 197–204 CrossRef CAS
.
- A. Yildirim and M. Bayindir, Anal. Chem., 2014, 86, 5508–5512 CrossRef CAS PubMed
.
- P. Kanyong, S. Rawlinson and J. Davis, Anal. Bioanal. Chem., 2016, 1–9 Search PubMed
.
- N. Baig and A.-N. Kawde, RSC Adv., 2016, 6, 80756–80765 RSC
.
- J. X. Liu and S. N. Ding, Sens. Actuators, B, 2017, 251, 200–207 CrossRef CAS
.
- M. Li, W. Guo, H. Li, W. Dai and B. Yang, Sens. Actuators, B, 2014, 204, 629–636 CrossRef CAS
.
- Y. Y. Li, P. Kang, S. Q. Wang, Z. G. Liu, Y. X. Li and Z. Guo, Sens. Actuators, B, 2021, 327, 128878 CrossRef CAS
.
- Z. Huang, L. Zhang, P. Cao, N. Wang and M. Lin, Ionics, 2021, 27, 1339–1345 CrossRef CAS
.
- L. A. Mercante, A. Pavinatto, L. E. O. Iwaki, V. P. Scagion, V. Zucolotto, O. N. Oliveira, L. H. C. Mattoso and D. S. Correa, ACS Appl. Mater. Interfaces, 2015, 7, 4784–4790 CrossRef CAS PubMed
.
- F. Mahmood, Y. Sun and C. Wan, RSC Adv., 2021, 11, 15410–15415 RSC
.
- S. Reddy, B. E. Kumara Swamy and H. Jayadevappa, Electrochim. Acta, 2012, 61, 78–86 CrossRef CAS
.
- A. N. Kawde, N. Baig and M. Sajid, RSC Adv., 2016, 6, 91325–91340 RSC
.
- N. Baig, I. Kammakakam, W. Falath and I. Kammakakam, Mater. Adv., 2021, 2, 1821–1871 RSC
.
- X. Huang, Z. Yin, S. Wu, X. Qi, Q. He, Q. Zhang, Q. Yan, F. Boey and H. Zhang, Small, 2011, 7, 1876–1902 CrossRef CAS PubMed
.
- S. Wu, Q. He, C. Tan, Y. Wang and H. Zhang, Small, 2013, 9, 1160–1172 CrossRef CAS PubMed
.
- M. M. Rahman and J. J. Lee, J. Electrochem. Sci. Technol., 2019, 10, 185–195 CAS
.
- B. Liu, X. Ouyang, Y. Ding, L. Luo, D. Xu and Y. Ning, Talanta, 2016, 146, 114–121 CrossRef CAS PubMed
.
- R. Sivasubramanian and P. Biji, J. Mater. Sci. Eng. B, 2016, 210, 10–18 CrossRef CAS
.
- D. Wu, Y. Li, Y. Zhang, P. Wang, Q. Wei and B. Du, Electrochim. Acta, 2014, 116, 244–249 CrossRef CAS
.
- K. Deng, J. Zhou and X. Li, Electrochim. Acta, 2013, 114, 341–346 CrossRef CAS
.
- A.-N. Kawde, M. Aziz, N. Baig and Y. Temerk, J. Electroanal. Chem., 2015, 740, 68–74 CrossRef CAS
.
- D. Zhao, G. Yu, K. Tian and C. Xu, Biosens. Bioelectron., 2016, 82, 119–126 CrossRef CAS PubMed
.
- T.-Q. Xu, Q.-L. Zhang, J.-N. Zheng, Z.-Y. Lv, J. Wei, A.-J. Wang and J.-J. Feng, Electrochim. Acta, 2014, 115, 109–115 CrossRef CAS
.
- J. Yan, S. Liu, Z. Zhang, G. He, P. Zhou, H. Liang, L. Tian, X. Zhou and H. Jiang, Colloids Surf., B, 2013, 111, 392–397 CrossRef CAS PubMed
.
- L. Yang, Y. Song, S. Zhang, G. Xiao, Z. Li, F. Gao, Y. Zhang, H. Xu and X. Cai, International IEEE/EMBS Conference on Neural Engineering, NER, 2017, pp. 227–230 Search PubMed
.
- B. Patella, A. Sortino, F. Mazzara, G. Aiello, G. Drago, C. Torino, A. Vilasi, A. O'Riordan and R. Inguanta, Anal. Chim. Acta, 2021, 1187, 339124 CrossRef CAS PubMed
.
- Y. Xu and B. Zhang, Chem. Soc. Rev., 2014, 43, 2439–2450 RSC
.
- E. A. Kumar, T. W. Chen, S. M. Chen, T. J. Wang, A. J. Anthuvan, S. Y. AlOmar, N. Ahmad and Y. H. Chang, New J. Chem., 2021, 45, 11644–11651 RSC
.
- B. Dalkiran and C. M. A. Brett, Anal. Bioanal. Chem., 2021, 413, 1149–1157 CrossRef CAS PubMed
.
- N. Baig, A. N. Kawde and M. Ibrahim, Mater. Adv., 2020, 1, 783–793 RSC
.
- R. Rejithamol, R. G. Krishnan and S. Beena, Mater. Chem. Phys., 2021, 258, 123857 CrossRef CAS
.
- G. F. Alves, T. P. Lisboa, L. V. de Faria, D. M. de Farias, M. A. C. Matos and R. C. Matos, Electroanalysis, 2021, 33, 543–549 CrossRef CAS
.
- A.-N. Kawde, Md. A. Aziz, M. El-Zohri, N. Baig and N. Odewunmi, Electroanalysis, 2017, 29, 1214–1221 CrossRef CAS
.
- N. Baig and A.-N. Kawde, Anal. Methods, 2015, 7, 9535–9541 RSC
.
- W. S. Hummers and R. E. Offeman, J. Am. Chem. Soc., 2002, 80, 1339 CrossRef
.
- Sudesh, N. Kumar, S. Das, C. Bernhard and G. D. Varma, Supercond. Sci. Technol., 2013, 26, 095008 CrossRef CAS
.
- W. Chen, Z. Wang, S. Gu, J. Wang, Y. Wang and Z. Wei, Sens. Actuators, B, 2020, 306, 127579 CrossRef CAS
.
- X. Zhang, G. Li, Q. Li, M. S. Shaikh and Z. Li, Results Phys., 2021, 26, 104407 CrossRef
.
- S. Qi, B. Zhao, H. Tang and X. Jiang, Electrochim. Acta, 2015, 161, 395–402 CrossRef CAS
.
- P. Rattanarat, A. Suea-Ngam, N. Ruecha, W. Siangproh, C. S. Henry, M. Srisa-Art and O. Chailapakul, Anal. Chim. Acta, 2016, 925, 51–60 CrossRef CAS PubMed
.
- E. Colín, S. C. Avendaño, M. T. Ramírez, M. Romero-Romo and M. Palomar-Pardave, Int. J. Electrochem. Sci., 2012, 7, 6097–6105 Search PubMed
.
- W. Zhu, T. Chen, X. Ma, H. Ma and S. Chen, Colloids Surf., B, 2013, 111, 321–326 CrossRef CAS PubMed
.
- F. Gao, X. Cai, X. Wang, C. Gao, S. Liu, F. Gao and Q. Wang, Sens. Actuators, B, 2013, 186, 380–387 CrossRef CAS
.
- T. Peik-See, A. Pandikumar, H. Nay-Ming, L. Hong-Ngee and Y. Sulaiman, Sensors, 2014, 14, 15227–15243 CrossRef PubMed
.
- W. Wang, Y. Cheng, L. Yan, H. Zhu, G. Li, J. Li and W. Sun, Anal. Methods, 2015, 7, 1878–1883 RSC
.
- G. Hernández-Cancel, D. Suazo-Dávila, J. Medina-Guzmán, M. Rosado-González, L. M. Díaz-Vázquez and K. Griebenow, Anal. Chim. Acta, 2015, 854, 129–139 CrossRef PubMed
.
- X. Zhu, Y. Liang, X. Zuo, R. Hu, X. Xiao and J. Nan, Electrochim. Acta, 2014, 143, 366–373 CrossRef CAS
.
- S. Pruneanu, A. R. Biris, F. Pogacean, C. Socaci, M. Coros, M. C. Rosu, F. Watanabe and A. S. Biris, Electrochim. Acta, 2015, 154, 197–204 CrossRef CAS
.
- G. He, D. Wu and G. Xiao, Int. J. Electrochem. Sci., 2015, 10, 10093–10103 CAS
.
- H. Mao, J. Liang, H. Zhang, Q. Pei, D. Liu, S. Wu, Y. Zhang and X.-M. Song, Biosens. Bioelectron., 2015, 70, 289–298 CrossRef CAS PubMed
.
- H. Xu, J. Xiao, L. Yan, L. Zhu and B. Liu, J. Electroanal. Chem., 2016, 779, 92–98 CrossRef CAS
.
- W. Sun, X. Wang, Y. Wang, X. Ju, L. Xu, G. Li and Z. Sun, Electrochim. Acta, 2013, 87, 317–322 CrossRef CAS
.
- Q. Lian, Z. He, Q. He, A. Luo, K. Yan, D. Zhang, X. Lu and X. Zhou, Anal. Chim. Acta, 2014, 823, 32–39 CrossRef CAS PubMed
.
- Y. R. Kim, S. Bong, Y. J. Kang, Y. Yang, R. K. Mahajan, J. S. Kim and H. Kim, Biosens. Bioelectron., 2010, 25, 2366–2369 CrossRef CAS PubMed
.
- S.-M. Li, Y.-S. Wang, S.-T. Hsiao, W.-H. Liao, C.-W. Lin, S.-Y. Yang, H.-W. Tien, C.-C. M. Ma and C.-C. Hu, J. Mater. Chem. C, 2015, 3, 9444–9453 RSC
.
- L. Zhao, H. Li, S. Gao, M. Li, S. Xu, C. Li, W. Guo, C. Qu and B. Yang, Electrochim. Acta, 2015, 168, 191–198 CrossRef CAS
.
- X. Liu, W. Wang, X. Li, C. Li, L. Qin, J. Sun and S.-Z. Kang, Electrochim. Acta, 2016, 210, 720–728 CrossRef CAS
.
| This journal is © The Royal Society of Chemistry 2022 |

