 Open Access Article
A highly accurate flexible sensor system for human blood pressure and heart rate monitoring based on graphene/sponge
Fan Zhang,
Kun Yang,
Zhen Pei,
Yuguang Wu,
Shengbo Sang *,
Qiang Zhang and
Huameng Jiao
MicroNano System Research Center, College of Information Engineering, Taiyuan University of Technology, Taiyuan 030024, China. E-mail: sunboa-sang@tyut.edu.cn
First published on 17th January 2022
Abstract
The development of wearable devices has shown tremendous dynamism, which places greater demands on the accuracy and consistency of sensors. This work reports a flexible sensing system for human health monitoring of parameters such as human pulse waveform, blood pressure and heart rate. The signal acquisition part is a vertically structured piezoresistive micro-pressure flexible sensor. To ensure accuracy, the sensors are filled with melamine sponge covered by graphene nanoconductive materials as the conductive layer, and ecoflex material acts as the flexible substrate. The flexible sensors fabricated under the 3D printing mold-assisted method exhibited high accuracy, good repeatability and remarkable response to micro-pressure. However, when used for human pulse signal measurement, the sensors are affected by unavoidable interference. In order to collect human health data accurately, signal acquisition and processing systems were constructed. The system allows for the accurate acquisition of human pulse signals, accompanied by the function of non-invasive, real-time and continuous detection of human blood pressure heart rate parameters. By comparing with an Omron blood pressure monitor, the blood pressure heart rate index error of the flexible sensing system does not exceed 3%.
1. Introduction
Wearable devices play a vital role in the realization of personalized medicine.1–4 They can continuously collect data from the human body and capture meaningful changes in health status in time for preventive intervention. The key to the wearable device is the efficient and accurate collection of human health data which places greater demands on the accuracy of sensors. Signal acquisition can be achieved by a variety of pressure sensors such as piezoresistive,5–10 capacitive11–13 piezoelectric,14,15 frictional pressure sensors16 and transistor sensors.17–20 Among them, piezoresistive sensors have received widespread attention because of their simple structure, high accuracy, and convenient signal processing. These characteristics also make them easy to design and develop applications, which give them great potential for applications in biological,21 medical devices22,23 and robotics.24To achieve accurate acquisition of human signals, on one hand, the sensors are required to have high accuracy and short response time, so that they can quickly respond to tiny human signals. In order to achieve the high sensitivity characteristics of sensors, a promising strategy is to build a special 3D porous conductive structure.25 Different pressures cause different changes in the three-dimensional structure, such that various conductive paths are formed inside the structure, which makes the sensor more sensitive to the perception of pressure signals than the sensor without the 3D structure. Dai S.-W.26 constructs conductive polydimethylsiloxane foam with hierarchical pore structure. Xia X. et al. and Chen S. et al.27,28 proposed the use of sugar and ammonium bicarbonate to construct the porous structure of the sensor respectively. The results show that the sensitivity of the sensor has been improved significantly. However, owing to the relatively cumbersome fabrication steps, a large number of accurate sensors cannot be made at the same time. As a material readily available in nature, sponges have a regular skeleton. The sensing unit made of sponge material can guarantee high accuracy and uniformity among batches. On the other hand, the implementation of sensor applications has placed higher demands on the uniformity and industrial production of sensors. The advent of 3D printing has made it possible.31 With the support of 3D printed molds, the uniformity and accuracy of the sensors can be better ensured.
However, the accuracy of the signal that the sensor can process is limited, so the development of a corresponding data processing system becomes extremely meaningful. Bei Li et al.32 prepared a flexible conductive polymer nanofiber composite for full-range detection of whole-body motion. W. Gao and his colleagues33 realized an intelligent prosthetic electronic skin that can sense temperature, humidity and various forms of strain simultaneously, and is equipped with a heater to regulate body temperature. Javey et al.34 provided a mechanically flexible, fully integrated sensor array for multi-channel analysis of sweat. The array can also selectively measure glucose and lactate metabolites, sodium and potassium electrolytes, and skin temperature. However, because of the high accuracy of flexible micro piezoresistive sensors, they are susceptible to external interference, resulting in poor stability and accuracy of the sensors for continuous data acquisition. Therefore, the use of flexible sensing systems for human health monitoring is a challenge, and there are few relevant reports. From Table 1, it can be seen that graphene/melamine sponge is more commonly used in oil treatment and human signal detection. In order to perform more accurate measurement signals, the corresponding complete signal processing system still deserves further exploration.
| Material | Sensitivity & range | Applications | System | References |
|---|---|---|---|---|
| Graphene/PU | N/A | Oil treatment | ✗ | 29 |
| Graphene/melamine | N/A | Oil treatment | ✗ | 30 |
| Carbon black/CNC/PU | 0.07 kPa−1 < 2.2 kPa | Wearable devices | ✗ | 35 |
| MXene/chitosan/PU | 0.01 kPa−1 < 5 kPa | Arterial monitoring | ✗ | 36 |
| RGO-CNT/melamine | 0.22 kPa−1 < 5 kPa | Human signal detection | ✗ | 37 |
| Graphene/melamine | 0.186 kPa−1 < 5 kPa | Human health monitoring | ✓ | Our work |
Here, a flexible piezoresistive sensor with high accuracy, fast response and good repeatability was fabricated. The sensitive unit was produced by graphene nanomaterials being attached to a sponge substrate material, and the flexible substrate of ecoflex material was prepared with the help of a 3D printed fabrication mold. This piezoresistive sensor performs well over a wide range of pressures and has high accuracy in small range pressure measurements. The human pulse wave signal was measured by the sensor through contact with the wrist at the radial artery. For more accurate signal acquisition and processing, a flexible sensing system for human health monitoring was proposed. In detail, the system performed the acquisition of human pulse wave physiological signals at first. Then, the characteristic parameters were extracted from the measured pulse wave signals and used to calculate the human heart rate and blood pressure parameters. The calculated results were compared with an Omron blood pressure monitor, and the results proved that the errors of the heart rate and blood pressure parameters did not exceed 3%.
2. Experimental section
2.1 Material preparation
Graphene (number of layers: 1–3, purity: 98%) was purchased from Shenzhen National Technology Co., Ltd. Conductive silver glue was purchased from Shenzhen Sinwe New Material Co., Ltd. Silicone resin (Ecoflex 00-20, part A and B) was purchased from Germany BASF Co., Ltd. Waterproof PU film was purchased from Qingdao Beta Industry and Trade Co., Ltd.2.2 Fabrication of sensing unit
Firstly, 0.2 mg graphene and 20 ml absolute ethanol were put into the reagent bottle and mixed vigorously to form a suspension. The reagent bottle was then placed in the cell pulverizer, graphene and alcohol mixture was processed under the ultrasonic dispersion operation for 40 min to obtain a graphene dispersion.Next, the melamine sponge was cleaned by deionized water and alcohol for 3 times, and then was put into the drying box to dry at 70 °C for 3 hours. The dried sponge was cut into 1 × 1 × 0.4 cm3 cubes for later use.
One of the cut sponges was placed in a beaker containing the prepared graphene dispersion. After the whole sponge block was sufficient soaked in the graphene dispersion, it was placed in the oven to dry for 1 hour. The next step was to take out the sponge block and repeat the above steps two to four times until the entire sponge block appears black. The sensing material was prepared.
2.3 3D print sensor template
The strain sensor molds were made by a fused deposition modeling (FDM) 3D printer. The hot bed temperature and nozzle temperature were set to 40 °C and 210 °C respectively. The printing material polylactic acid (PLA) was ejected from the 400 μm printer nozzle at a speed of 30 mm s−1. The thickness of each layer was set to 100 μm, and the support type was full support. After the mold had printed and solidified, it was taken off for subsequent use.2.4 Fabrication of the pressure sensor
The ecoflex glue a and b glue were thoroughly mixed in a ratio of 1![[thin space (1/6-em)]](https://www.rsc.org/images/entities/char_2009.gif) :
:![[thin space (1/6-em)]](https://www.rsc.org/images/entities/char_2009.gif) 1 and poured into the previously prepared mold. After defoaming with a vacuum drying oven, the mold coated with ecoflex was placed on a heating table at 50 °C for one hour. Then the ecoflex was demolded, so that the flexible substrate was produced. The conductive silver tape was cut into two 1 cm × 1 cm squares and a 6.5 cm × 0.1 cm rectangular composite “spade” shape as electrodes using light shears. After coating the missile silver paste on the square surfaces where the two electrodes were in contact with the conductive unit, the flexible substrate, the electrode, the conductive unit, and the electrode were combined from the bottom up. Finally, a waterproof PU film was used to wrap the sensor head, and at the same time, ecoflex was used to seal the body part of the sensor.
1 and poured into the previously prepared mold. After defoaming with a vacuum drying oven, the mold coated with ecoflex was placed on a heating table at 50 °C for one hour. Then the ecoflex was demolded, so that the flexible substrate was produced. The conductive silver tape was cut into two 1 cm × 1 cm squares and a 6.5 cm × 0.1 cm rectangular composite “spade” shape as electrodes using light shears. After coating the missile silver paste on the square surfaces where the two electrodes were in contact with the conductive unit, the flexible substrate, the electrode, the conductive unit, and the electrode were combined from the bottom up. Finally, a waterproof PU film was used to wrap the sensor head, and at the same time, ecoflex was used to seal the body part of the sensor.
2.5 Characterization
The sensor unit was observed under an optical microscope (Olympus DSX10-TF). The microstructure was observed by scanning electron microscope (JEOL-7100F). SEM observation was carried out under 10 kV voltage. The electrical performance of the device and its pressing resistance change were measured by a source meter (Keithley 2400) and a manual translation stage (Zolix Instruments Co., Ltd).3. Results and discussion
3D printing was used in the production of strain sensor molds, which made the production of sensors more rapid and consistent, and enabled the sensors to be flexibly changed and expanded according to needs. The strip of PLA chosen as the mold material was heated to 210 °C in the 3D printer and extruded through a 400 μm nozzle under the control of a digital code generated based on the designed model. As shown in Fig. 1b, the sensor mold was designed in the shape of a spoon. The head and body of the “spoon” were hollowed out rectangular parallelepipeds of 1.4 cm × 1.4 cm × 0.5 cm and 6.5 cm × 0.8 cm × 0.5 cm respectively. A 1.2 cm × 1.2 cm × 0.3 cm rectangular parallelepiped protruding from the head was reserved for the sensitive unit, and there was a 0.1 cm cube on both sides to ensure the smooth pressing of the sensor. The flexible substrate obtained by ecoflex demolding is shown in Fig. 1c. Since the sensor was made with a 3D printing mold, the shape of the produced sensor had a high degree of consistency. Subsequently, the digital model of the 3D printed mold was modified and extended according to the requirements, and the flexible sensor array was quickly fabricated for more applications.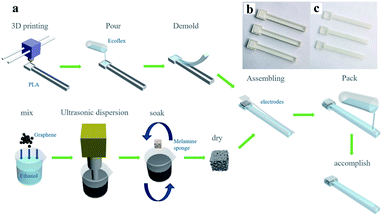 | ||
| Fig. 1 (a) The schematic diagram of the sensor manufacturing process, (b) 3D printing mold, demolding to get (c) the sensor substrate. | ||
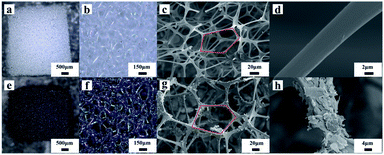
Graphene is a single atomic layer thickness crystal formed by sp2 hybridized carbon atoms, with high specific surface area and unique two-dimensional porous structure. It is the unsaturation caused by the lack of adjacent atoms around the surface atoms of graphene that makes graphene easy to combine with other atoms and stabilize, so graphene has strong adsorption properties. It is easy to be adsorbed on organic matter through ion exchange, electrostatic interaction and π–π bonding. To ensure the accuracy of the sensors, only graphene is used to build the sensing network. One of the reasons is that graphene has the property of adsorbing organic materials, which is helpful for the construction of stable sensing units. The introduction of other sensing materials tends to make the sensing pathway uncontrollable and the complex pathway will be detrimental to the accuracy of the sensor. The melamine sponge has a larger surface area and porosity, which provides more space for the conductive material to adsorb. More conductive materials firmly adsorbed on the sponge skeleton means that it is easier to form conductive pathways in the sponge, enhancing the sensitivity of the sensor at low pressure. Observed under an optical microscope (Fig. 2a, b, e and f), the melamine sponge changed its color from white to black by repeated infiltration in the prepared graphene ethanol dispersion, indicated that the graphene particles were coated on the melamine sponge skeleton. The internal microstructures of the pure melamine sponge and the conductive sponge were observed by scanning electron microscopy with different magnifications, as shown in Fig. 2c. It can be seen that the skeleton structure of pure melamine sponge was moderately thick and stable in state. It was composed of a large number of uniformly distributed pentagonal vertices connected, so that the skeleton structure would have a regular deformation when pressure was applied. After the sponge was soaked in the graphene alcohol dispersion, the graphene flakes stuck to the sponge skeleton (Fig. 2g). Comparative plots of individual melamine sponge walls shown that the graphene flakes adhered to the walls uniformly (Fig. 2d and h). Compression tests on the sponge revealed that it could achieve a compression ratio of more than 80%, proving that the flexibility of the sponge block would not change significantly after the addition of graphene. The graphene melamine sponge can fully meet the requirements of flexible pressure sensors.
The principle of resistance changes of melamine sponge covered graphene piezoresistive flexible pressure sensor is shown in Fig. 3. After the sponge is soaked in the graphene ethanol dispersion, the graphene flakes are adhered to the sponge skeleton. The resistance values of two adjacent graphene sheets can be considered as fixed-value resistors model R1 and R3 while a varistor R2 with infinite initial resistance is deemed to exist between them. When loading, as the gap between the sponge skeletons gradually becomes smaller, the graphene flakes are in close or even direct contact with each other. Because of the “tunneling effect”, the adjacent graphene flakes gradually form a conductive path, leading to a decrease in the resistance value of the varistor R2. It can be seen from Fig. 4a that as the pressure increases, the sensor resistance will continue to decrease. The main reason for the significant resistance changes in the pressure range of 0–5 kPa is that the skeleton of the compressed sponge changes obviously under a tiny amount of pressure. Until the sponge compression reaches the maximum, the sensor resistance changes slow down. At this point, the skeleton of the sponge would no longer experience large changes, the mechanism acting on the resistance change is due to the compression between the graphene flakes. The high elasticity and structural stability of the sponge skeleton can support precision in recovery. The sponge gradually returns to its original shape as the pressure decreases during the unloading process. The increase in the gap between the sponge skeletons leads to a decrease in the conductive path, which results in an increase in the sensor resistance until it recovered. What is worth mentioning is that the number of times the sponge is coated with conductive material affects the sensitivity of the sensor. The thickness of the sponge can also have an impact on the sensitivity of the sensor, with a thicker sponge having a higher sensitivity than a thinner sponge.38 Additionally, the shape of the electrode and the sponge surface in contact can also have an influence on the sensitivity of the sensor.39 The sensitivity of the sensor is adjusted by adjusting the contact resistance through the effective area with the sensitive unit.
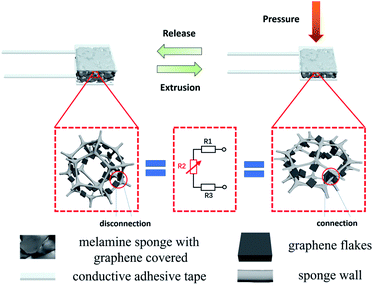 | ||
| Fig. 3 Melamine sponge with graphene covered piezoresistive flexible pressure sensor sensing principle diagram. | ||
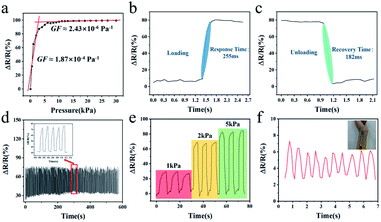
Fig. 4a shows the variation curve of sensor resistance under pressure. Two straight lines were fitted according to the piezoresistance curve of the sensor, and the GF of the fitted curve reached 1.87 × 10⁻⁴ Pa−1 within the pressure of 0–5 kPa. In the given pressure range of 5–30 kPa, the GF of the curve was about 2.43 × 10⁻⁶ Pa−1. It was seen that the fabricated sensor could recognize large pressures and had a high resolution in the small pressure range. In addition, the fast response time is also a key parameter for the actual application of the sensor, and the response and recovery time occupies a vital part of the sensor performance. The response time of the prepared sensor resistance signal along with strain loading was recorded (Fig. 4b). The outcome would indicate that the sensor can sense strain stimuli in 255 ms and can respond quickly to stress. In the meantime, the recovery time of the prepared sensor was evaluated. Due to the high elasticity of the conductive sponge, the sensor recovered quickly with a recovery time of only 182 ms (Fig. 4c). The strong adsorption of graphene to organic materials ensures the structural stability of the graphene coating. The digital display push–pull pressure gauge was used to perform 300 load–unload fatigue tests on the prepared sensor. The experimental parameters were set to speed 5 mm s−1 and pressure 20 kPa. The results after the high-strength fatigue test demonstrated that the resistance change of the sensor gradually stabilized within a certain range as the number of applied pressures increased (Fig. 4d), which proved the structural reliability of the graphene coating and the good stability of the sensor. The sensor had good pressure discrimination, when the pressure of 1, 2 and 5 kPa was repeatedly applied, the sensor responded correctly (Fig. 4e). Finally, the sensor was glued to the pulse of the wrist, and the sensor was tested with a slight pressure (Fig. 4f). The resistance of the sensor could respond to the pulse signal of the measurer. As can be seen from the graph, the pulse of the measurer beat about 10 times in 7 seconds, and thus his heart rate could be approximately calculated to 86 bpm.
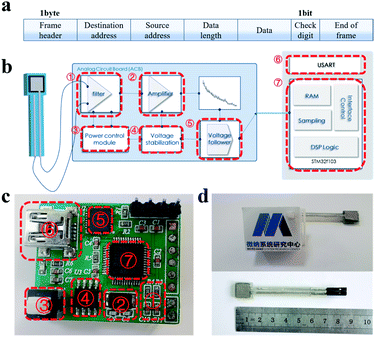
Inevitable interference occurs when sensors are used as wearable devices. Once the body performs a large mechanical movement, multiple signals will act on the sensor at the same time. Taking the pulse signal measurement at the wrist as an example, because of the high sensitivity of the sensor, the shaking arm and bending wrist will cause a change in the resistance value of sensor in various degrees. When all effects are combined on the sensor, the baseline drift of the pulse wave will be observed in the sensor resistance variation curve. In contrast to the pulse signal, the mechanical movement of the human body will cause resistance changes with low frequency and high amplitude. Therefore, the low frequency signal needs to be filtered out in the frequency domain. In order to accurately extract the desired physiological signals from multiple interferences, flexible sensing systems are created. The sensing system was constructed for the follow-up of the flexible sensor to collect the physiological signal of human pulse. The sensing system was constructed in two aspects. The lower computer was mainly responsible for signal conversion, encapsulation and transmission functions, while the upper computer was primarily concerned with signal reception, processing, calculation and display functions. They were transmitted to each other in the form of data packets. The protocol is shown in Fig. 5 and 7a. The packet of the lower unit consisted of a 1 byte frame header, destination address, source address, data length information, data bits and end of frame. Among them, there was a 1 bit parity bit between the data bit and the end of the frame to ensure the correctness of the transmitted data. The main purpose of the uplink data transmission was for the responding lower computer to execute the data acquisition command. The frame header, destination address and frame tail made up the upper computer data packet.
In the process of circuit construction, the STM32F103C8T6 chip was chosen as the lower computer control core. It is a 32 bit microcontroller based on the ARM Cortex-M3 core, with a RISC core operating at 72 MHz and built-in high-speed memory (up to 64 kbytes of flash memory and 20 kbytes of memory). This chip also has function modules such as adc, timer and watchdog, and is typically used in low-power and low-cost autonomous systems. The power management part adopted 5 V/0.5 A USB power supply, and reached the main power supply branch after the current-limiting and anti-reverse circuit. Ultimately, the voltage was passed through the TPS7333Q low dropout linear regulator to achieve a 3.3 V operating voltage for the microcontroller. The framework of the main functional structure of the circuit is shown in Fig. 5b. First, the sensor was connected to the voltage divider circuit. The resistance change of the sensor caused by the human pulse micro-pressure signal would be converted into a processable voltage signal. Since the human body pulse signal frequency is about 0.5–20 Hz, a second-order active low-pass filter with a cutoff frequency of 40 Hz was used for filtering. The filtered pulse signal was then transmitted to the amplifier and voltage follower for signal amplification and buffering. The processed signal was transferred through the GPIO port of the microcontroller to the A/D conversion rule channel for sampling, quantizing, holding and coding operations. The final data was stored in a random buffer, encapsulated and packaged, and then transmitted to the host computer via the serial port. The actual functional circuit is shown in Fig. 5c. The lower computer electronics were integrated on a 2.4 cm × 3 cm PCB board and the flexible sensor size was only 1 cm × 8.5 cm × 0.5 cm. A 2.8 cm × 3.8 cm × 1.8 cm (Fig. 5d) outer shell was designed to contain the system hardware part. The acquisition system was easy to carry due to its small size and flexible detachability.
The programming logic of the software can be represented by the flowchart (Fig. 6a and b). After initializing the modules, the lower computer launches the external trigger interrupt and keeps waiting until the upper computer transmits the acquisition command. The lower computer compares the target address in the packet transmitted by the upper computer, and triggers the A/D conversion after the address is matched correctly. The data is saved and encapsulated when the A/D conversion is completed. In the end, the CP2102 chip transmits data to the upper computer by virtualizing the USB port of the PC as a COM port through the driver. For the upper computer, it initializes the system to ensure that all parts are working properly, after that it starts broadcasting data packets requesting connection. The corresponding lower computer starts returning data after receiving the acquisition command, meanwhile, the upper computer processes and calculates the data after comparing the received data packets with the protocol. During transmission, the process of displaying, collecting and processing data is synchronized until the end of the measurement process.
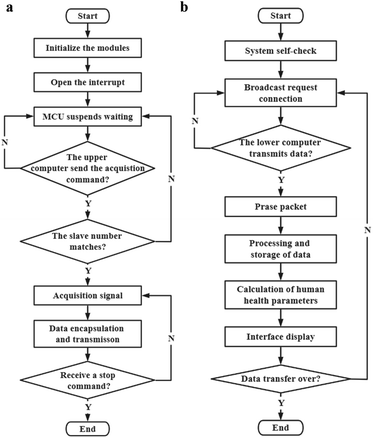 | ||
| Fig. 6 Flexible sensing system (a) slave computer logic flow design block diagram, (b) host computer logic flow design block diagram. | ||
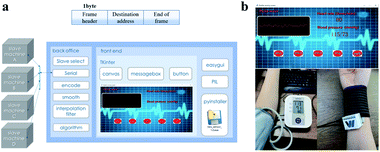
The upper computer part is divided into the front-end and the back-end building process. It is written by python language (Fig. 7a). The main work of the back-end is to receive data through the serial control and perform data decoding, smoothing and interpolation filtering. The pulse wave contains meaningful physiological signals, and the human heart rate can be calculated by extracting the relationship between the wave crest and the time interval. An early study by Moens–Korteweg40 proposed a blood pressure model. The elastic modulus, characteristic covariates, and blood density of the vessels in the model are constant for a period of time. Neglecting the effects of arterial vessel internal diameter and vessel wall thickness when blood pressure is changed, a linear correlation between human blood pressure values and pulse wave conduction time can be obtained. A blood pressure function is fitted by combining the MIMIC database with the computational model. In this way the upper computer is given the ability to calculate blood pressure values from pulse wave transmission time. The front-end, supported by the tkinter control, uses the canvas component to plot the pulse wave data transmitted by the acquisition circuit and display the human health parameters calculated by the algorithm. The upper computer uses messagebox control and easygui library to implement human–machine interaction, such as slave selection, serial port switching, background data logging display and other functions. The program is finally packaged as an application via Pyinstaller package.
The upper computer calculated and displayed the transmitted data, including the drawing of the pulse wave waveform, the real-time display of heart rate and blood pressure signals. In a further way, the upper computer had the functions of slave selection, serial port selection, and history viewing. In addition, the sensor was attached to the radial artery outside the wrist to monitor under the pressure of a bandage. Results were presented in Fig. 7b. The heart rate value was 80 and the blood pressure value was 115/73 mmHg. At the same time, Omron sphygmomanometer was used for measurement, and the heart rate and blood pressure of the tester were 80 and 115/73 mmHg respectively. Additional comparison experiments were used to test the accuracy of the system, and the results (Table 2) shown that average difference in heart rate and blood pressure parameters between the flexible sensing system and Omron sphygmomanometer is less than 3%. The system has unimaginable application prospects in traditional Chinese medicine pulse conditions, wearable devices and personalized detection.
| Measurer | Systolic blood pressure | Diastolic blood pressure | Heart rate | ||||||
|---|---|---|---|---|---|---|---|---|---|
| Measurements (mmHg) | Contrast value (mmHg) | Relative error (%) | Measurements (mmHg) | Contrast value (mmHg) | Relative error (%) | Measurements (bpm) | Contrast value (bpm) | Relative error (%) | |
| 1 | 133 | 133 | 0 | 87 | 84 | 3.57 | 83 | 80 | 3.75 |
| 2 | 119 | 118 | 0.85 | 68 | 69 | −1.45 | 80 | 80 | 0 |
| 3 | 113 | 112 | 0.89 | 63 | 61 | 3.28 | 76 | 77 | −1.3 |
| 4 | 114 | 115 | −0.87 | 74 | 75 | −1.33 | 84 | 80 | 5.00 |
| 5 | 118 | 119 | −0.84 | 77 | 78 | −1.28 | 77 | 78 | −1.28 |
| 6 | 121 | 123 | −1.63 | 79 | 81 | −2.47 | 76 | 77 | −1.30 |
| 7 | 120 | 119 | 0.84 | 76 | 76 | 0 | 80 | 80 | 0 |
| 8 | 115 | 113 | 1.77 | 73 | 71 | 2.82 | 81 | 81 | 0 |
4. Conclusions
In summary, we fabricated a highly accurate flexible sensing system, which enabled human health monitoring by collecting pulse signals. Among them, a highly sensitive melamine sponge-wrapped graphene flexible stress sensor was fabricated, while the flexible substrate and sensing unit of the sensor were fabricated by 3D printing mold assistance and ultrasonic-assisted dip coating method, respectively. The sensor was characterized by high accuracy, good repeatability and fast response, and was capable of identifying small stresses. The performance of the sensor was basically consistent from batch to batch, which is helpful for mass production of wearable devices. After that, in order to accurately capture the human signal, we created a subsequent signal acquisition circuit to eliminate the interference generated by other signals. A computer host display platform was also built to display human pulse images and heart rate information in real time. According to the blood pressure calculation method proposed by Moens–Korteweg, the non-invasive continuous detection of blood pressure parameters was realized. The system is portable and easy to detect, and the monitoring of human inevitable interference parameters can be performed by placing the sensor at the pulse for ten seconds. The comparison of the results with Omron sphygmomanometer showed that the error rate between blood pressure 60/100–90/135 mmHg did not exceed 3%. It is hoped that this work can provide a way of thinking for the large-scale and low-cost production of personalized and accurate medical devices.Author contributions
Fan Zhang: writing – original draft, investigation, data curation. Kun Yang: writing – review & editing, funding acquisition. Zhen Pei: resources. Yuguang Wu: validation. Shengbo Sang: conceptualization, funding acquisition. Qiang Zhang: formal analysis. Huameng Jiao: methodology.Conflicts of interest
There are no conflicts to declare.Acknowledgements
This study is supported by National Natural Science Foundation of China (No. 51975400, No. 62031022, No. 62003232), Key Programs for Science and Technology Development of Shanxi (2020XM06), STIP of Higher Education Institutions in Shanxi (No. 2020L0072).References
- W. Gao, H. Ota, D. Kiriya, K. Takei and A. Javey, Flexible Electronics toward Wearable Sensing, Acc. Chem. Res., 2019, 52(3), 523–533 CrossRef CAS PubMed.
- D.-H. Kim, N. Lu, R. Ma, Y.-S. Kim, R.-H. Kim, S. Wang, J. Wu, S. M. Won, H. Tao, A. Islam, K. J. Yu, T.-i. Kim, R. Chowdhury, M. Ying, L. Xu, M. Li, H.-J. Chung, H. Keum, M. McCormick, P. Liu, Y.-W. Zhang, F. G. Omenetto, Y. Huang, T. Coleman and J. A. Rogers, Epidermal Electronics, Science, 2011, 333, 838–843 CrossRef CAS PubMed.
- S. S. Yao, P. Swetha and Y. Zhu, Nanomaterial-Enabled Wearable Sensors for Healthcare, Adv. Healthcare Mater., 2017, 7(1), 1700889 CrossRef PubMed.
- M. Ha, S. Lim and H. Ko, Wearable and flexible sensors for user-interactive healthmonitoring devices, J. Mater. Chem B, 2018, 6(24), 4043–4064 RSC.
- S. Riyajuddin, S. Kumar, S. P. Gaur, A. Sud, T. Maruyama, M. E. Ali and K. Ghosh, Linear Piezoresistive Strain Sensor based on Graphene/g-C3N4/PDMS Heterostructure, Nanotechnology, 2020, 31(29), 295501 CrossRef CAS PubMed.
- H. Li, K. Wu, Z. Xu, Z. Wang, Y. Meng and L. Li, Ultrahigh-Sensitivity Piezoresistive Pressure Sensors for Detection of Tiny Pressure, ACS Appl. Mater. Interfaces, 2018, 10(24), 20826–20834 CrossRef CAS PubMed.
- Y. Pang, K. Zhang, Z. Yang, S. Jiang, Z. Ju, Y. Li, X. Wang, D. Wang, M. Jian, Y. Zhang, R. Liang, H. Tian, Y. Yang and T.-L. Ren, Epidermis Microstructure Inspired Graphene Pressure Sensor with Random Distributed Spinosum for High Sensitivity and Large Linearity, ACS Nano, 2018, 12(3), 2346–2354 CrossRef CAS PubMed.
- Y. Pang, H. Tian, L. Tao, Y. Li, X. Wang, N. Deng, Y. Yang and T.-L. Ren, Flexible, Highly Sensitive, and Wearable Pressure and Strain Sensors with Graphene Porous Network Structure, ACS Appl. Mater. Interfaces, 2016, 8(40), 26458–26462 CrossRef CAS PubMed.
- C. L. Choong, M. B. Shim, B. S. Lee, S. Jeon, D. S. Ko, T. H. Kang, J. Bae, S. H. Lee, K. E. Byun, J. Im, Y. J. Jeong, C. E. Park and J. J. Park, Highly Stretchable Resistive Pressure Sensors Using a Conductive Elastomeric Composite on a Micropyramid Array, Adv. Mater., 2014, 26(21), 3451–3458 CrossRef CAS PubMed.
- S.-N. Li, Z.-R. Yu, B.-F. Guo, K.-Y. Guo, Y. Li, L.-X. Gong, L. Zhao, J. Bae and L.-C. Tang, Environmentally stable, mechanically flexible, self-adhesive, and electrically conductive Ti3C2TX MXene hydrogels for wide-temperature strain sensing, Nano Energy, 2021, 90, 106502 CrossRef CAS.
- Y. Wan, Z. Qiu, J. Huang, J. Yang, Q. Wang, P. Lu, J. Yang, J. Zhang, S. Huang, Z. Wu and C. F. Guo, Natural Plant Materials as Dielectric Layer for Highly Sensitive Flexible Electronic Skin, Small, 2018, 14(35), e1801657 CrossRef PubMed.
- J. O. Kim, S. Y. Kwon, Y. Kim, H. B. Choi, J. C. Yang, J. Oh, H. S. Lee, J. Y. Sim, S. Ryu and S. Park, Highly Ordered 3D Microstructure-Based Electronic Skin Capable of Differentiating Pressure, Temperature, and Proximity, ACS Appl. Mater. Interfaces, 2019, 11(1), 1503–1511 CrossRef CAS PubMed.
- J. C. Yang, J. O. Kim, J. Oh, S. Y. Kwon, J. Y. Sim, D. W. Kim, H. B. Choi and S. Park, Microstructured Porous Pyramid-Based Ultrahigh Sensitive Pressure Sensor Insensitive to Strain and Temperature, ACS Appl. Mater. Interfaces, 2019, 11(21), 19472–19480 CrossRef CAS PubMed.
- F. Zhang, Y. Zang, D. Huang, C. A. Di and D. Zhu, Flexible and self-powered temperature–pressure dual-parameter sensors using microstructure-framesupported organic thermoelectric materials, Nat. Commun., 2015, 6(1), 8356 CrossRef CAS PubMed.
- Z. Chen, Z. Wang, X. Li, Y. Lin, N. Luo, M. Long, N. Zhao and J.-B. Xu, Flexible Piezoelectric-Induced Pressure Sensors for Static Measurements Based on Nanowires/Graphene Heterostructures, ACS Nano, 2017, 11(5), 4507–4513 CrossRef CAS PubMed.
- Y.-C. Lai, J. Deng, R. Liu, Y.-C. Hsiao, S. L. Zhang, W. Peng, H.-M. Wu and X. Wang, Z. Actively Perceiving and Responsive Soft Robots Enabled by Self-Powered, Highly Extensible, and Highly Sensitive Triboelectric Proximity- and Pressure-Sensing Skins, Adv. Mater., 2018, 30(28), 1801114 CrossRef PubMed.
- T. Someya, T. Sekitani, S. Iba, Y. Kato, H. Kawaguchi and T. Sakurai, A large-area, flexible pressure sensor matrix with organic field-effect transistors for artificial skin applications, Proc. Natl. Acad. Sci. U. S. A., 2004, 101(27), 9966–9970 CrossRef CAS PubMed.
- K. Takei, T. Takahashi, J. C. Ho, H. Ko, A. G. Gillies, P. W. Leu, R. S. Fearing and A. Javey, Nanowire active-matrix circuitry for low-voltage macroscale artificial skin, Nat. Mater., 2010, 9(10), 821–826 CrossRef CAS PubMed.
- M. Madsen, K. Takei, R. Kapadia, H. Fang, H. Ko, T. Takahashi, A. C. Ford, M. H. Lee and A. Javey, Nanoscale semiconductor “x” on substrate “y” – processes, devices, and applications, Adv. Mater., 2011, 23, 3115–3127 CrossRef CAS PubMed.
- N. T. Tien, S. Jeon, D. I. Kim, T. Q. Trung, M. Jang, B. U. Hwang, K. E. Byun, J. Bae, E. Lee, J. B. Tok, Z. Bao, N. E. Lee and J. J. Park, A flexible bimodal sensor array for simultaneous sensing of pressure and temperature, Adv. Mater., 2014, 26(5), 796–804 CrossRef PubMed.
- J. Park, Y. Lee, J. Hong, M. Ha, Y.-D. Jung, H. Lim, S. Y. Kim and H. Ko, Giant tunneling piezoresistance of composite elastomers with interlocked microdome arrays for ultrasensitive and multimodal electronic skins, ACS Nano, 2014, 8, 4373–4395 Search PubMed.
- Y. Khan, A. E. Ostfeld, C. M. Lochner, A. Pierre and A. C. Arias, Monitoring of vital signs with flexible and wearable medical devices, Adv. Mater., 2016, 28, 4373–4395 CrossRef CAS PubMed.
- Y. Zang, F. Zhang, C.-A. Di and D. Zhu, Advances of flexible pressure sensors toward artificial intelligence and health care applications, Mater. Horiz., 2015, 2, 140–156 RSC.
- Z. Zhan, R. Lin, V.-T. Tran, J. An, Y. Wei, H. Du, T. Tran and W. Lu, Paper/carbon nanotube-based wearable pressure sensor for physiological signal acquisition and soft robotic skin, ACS Appl. Mater. Interfaces, 2017, 9, 37921–37928 CrossRef CAS PubMed.
- L. Zhao, F. Qiang, S. W. Dai, S. C. Shen, Y. Z. Huang, N. J. Huang, G. D. Zhang, L. Z. Guan, J. F. Gao, Y. H. Song and L. C. Tang, Construction of sandwich-like porous structure of graphene-coated foam composites for ultrasensitive and flexible pressure sensors, Nanoscale, 2019, 11(21), 10229–10238 RSC.
- S.-W. Dai, Y.-L. Gu, L. Zhao, W. Zhang, C.-H. Gao, Y.-X. Wu and L.-C. Tang, Bamboo-inspired mechanically flexible and electrically conductive polydimethylsiloxane foam materials with designed hierarchical pore structures for ultra-sensitive and reliable piezoresistive pressure sensor, Composites, Part B, 2021, 225, 109243 CrossRef.
- X. Xia, J. Chen, H. Guo, G. Liu, D. Wei, Y. Xi, X. Wang and C. Hu, Embedding variable micro-capacitors in polydimethylsiloxane for enhancing output power of triboelectric nanogenerator, Nano Res., 2017, 10(1), 320–330 CrossRef CAS.
- S. Chen, B. Zhuo and X. Guo, Large Area One-Step Facile Processing of Microstructured Elastomeric Dielectric Film for High Sensitivity and Durable Sensing over Wide Pressure Range, ACS Appl. Mater. Interfaces, 2016, 8(31), 20364–20370 CrossRef CAS PubMed.
- T. Liu, G. Zhao and W. Zhang, et al., The preparation of superhydrophobic graphene/melamine composite sponge applied in treatment of oil pollution, J. Porous Mater., 2015, 22, 1573–1580 CrossRef CAS.
- F. Qiang, L.-L. Hu, L.-X. Gong, L. Zhao, S.-N. Li and L.-C. Tang, Facile synthesis of super-hydrophobic, electrically conductive and mechanically flexible functionalized graphene nanoribbons/polyurethane sponge for efficient oil/water separation at static and dynamic states, Chem. Eng. J., 2018, 334, 2154–2166 CrossRef CAS.
- Y. Ni, R. Ji, K. Long, T. Bu, K. Chen and S. Zhuang, A review of 3D-printed sensors, Appl. Spectrosc. Rev., 2017, 1–30 Search PubMed.
- B. Li, J. Luo, X. Huang, L. Lin, L. Wang, M. Hu, L. Tang, H. Xue, J. Gao and Y.-W. Mai, A highly stretchable, super-hydrophobic strain sensor based on polydopamine and graphene reinforced nanofiber composite for human motion monitoring, Composites, Part B, 2019, 107580 Search PubMed.
- W. Gao, S. Emaminejad, H. Y. Y. Nyein, K. Chen, A. Peck, H. M. Fahad, H. Ota, H. Shiraki, D. Kiriya, D.-H. Lien, G. A. Brooks, R. W. Davis and A. Javey, Fully integrated wearable sensor arrays for multiplexed in situ perspiration analysis, Nature, 2016, 529(7587), 509–514 CrossRef CAS PubMed.
- C. Yeom, K. Chen, D. Kiriya, Z. Yu, G. Cho and A. Javey, Large-area compliant tactile sensors using printed carbon nanotube active-matrix backplanes, Adv. Mater., 2015, 27(9), 1561–1566 CrossRef CAS PubMed.
- X. Yin, T. P. Vinod and R. Jelinek, A flexible high-sensitivity piezoresistive sensor comprising a Au nanoribbon-coated polymer sponge, J. Mater. Chem. C, 2015, 3, 9247–9252 RSC.
- Z. Chen, Y. Hu, H. Zhuo, L. Liu, S. Jing, L. Zhong, X. Peng and R.-c. Sun, Compressible, elastic, and pressure-sensitive carbon aerogel derived from 2D titanium carbide nanosheets and bacterial cellulose for wearable sensors, Chem. Mater., 2019, 31(9), 3301–3312 CrossRef CAS.
- B. B. Bhatt, L. Kumar, A. Kushwaha and D. Gupta, An ultra-compressible piezoresistive strain and pressure sensor based on RGO-CNT-Melamine foam composite for biomedical sensing, Sens. Actuators, A, 2021, 331, 112875 CrossRef CAS.
- H. Chen, Z. Su, Y. Song, X. Cheng, X. Chen, B. Meng, Z. Song, D. Chen and H. Zhang, Omnidirectional Bending and Pressure Sensor Based on Stretchable CNT-PU Sponge, Adv. Funct. Mater., 2017, 27(3), 1604434 CrossRef.
- T. Yu, D. Zhang, Y. Wu, S. Guo, F. Lei, Y. Li and J. Yang, Graphene foam pressure sensor based on fractal electrode with high sensitivity and wide linear range, Carbon, 2021, 182, 497–505 CrossRef CAS.
- R. Mukkamala, J. O. Hahn and O. T. Inan, et al., Toward Ubiquitous Blood Pressure Monitoring via Pulse Transit Time: Theory and Practice, IEEE Trans. Biomed. Eng., 2015, 62(8), 1879–1901 Search PubMed.
| This journal is © The Royal Society of Chemistry 2022 |

