 Open Access Article
Efficient and ecofriendly cellulose-supported MIL-100(Fe) for wastewater treatment†
Seyed Dariush Taherzade,
Mehrnaz Abbasichaleshtori and
Janet Soleimannejad *
*
School of Chemistry, College of Science, University of Tehran, P. O. Box 14155-6455, Tehran, Iran. E-mail: janet_soleimannejad@khayam.ut.ac.ir
First published on 22nd March 2022
Abstract
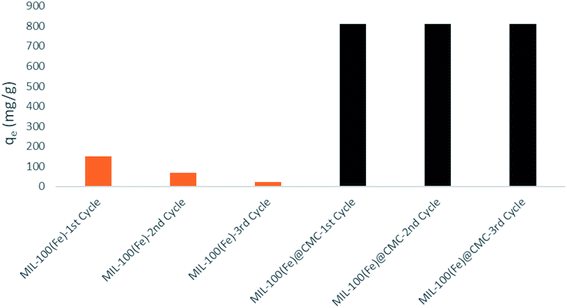
Due to their efficiency and accessibility, benzodiazepines are widely manufactured and consumed and as a result, they can be found in almost all wastewaters. Among the materials that were used for the removal of drug contaminants from wastewater, metal–organic frameworks (MOFs) demonstrated unique properties. In this regard, a composite of carboxymethylated cellulose (CMC) and MIL-100(Fe) was prepared via a sonochemical method and used for the removal of lorazepam from wastewater in various conditions. A maximum capacity of 811 mg g−1 was achieved which is considered a great improvement compared to bare MIL-100(Fe) (150 mg g−1) and other previously reported adsorbents. It is noteworthy that the efficiency of the adsorbent did not reduce in the second and third cycle of adsorption/desorption. Moreover, the effect of pH, dose of adsorbent, isotherms and the kinetics of this process were studied using UV-vis and HPLC analyses and the adsorbents were fully characterized with PXRD, TGA, BET, SEM, ZP and FT-IR techniques. Our findings demonstrate that this composite is clearly a green, recyclable and efficient adsorbent for the removal of lorazepam and opens our way to further potential applications in the removal of other active pharmaceutical ingredients.
1. Introduction
The recent COVID-19 pandemic has caused mental health issues especially in people with a history of panic attacks and insomnia.1,2 It is not the first time that an outbreak has severely affected the mental health of people. In 2009, the outbreak of H1N1 (swine flu), led to elevated levels of anxiety among people. In 2012, not only did MERS survivors have to deal with critical health issues, but also high levels of anxiety and panic disorders were observed among both patients and healthcare staff.3 Benzodiazepines are one of the most prescribed psychoactive drugs to cope with the mental health issues.4 It is noteworthy that in spite of the higher risk of using benzodiazepines as sedatives for patients with severe lung diseases, benzodiazepines like midazolam and lorazepam are utilized more frequently due to the shortage of appropriate sedatives in the COVID-19 pandemic.5,6 For example, it is estimated that more than 25 tons of lorazepam are produced yearly, and the annual consumption of this short-acting benzodiazepine derivative has increased by 15.18% in Spain.7However, the increasing demand for these compounds has led to serious environmental issues.8 Previous studies have revealed that various processes such as photosynthesis and reproduction in aquatic creatures are disrupted due to the presence of psychoactive drugs in waters. Although the treatment methods are now far better than a decade ago, yet they are surprisingly inefficient in eliminating so many pharmaceutical and personal care products (PPCPs) especially benzodiazepines.9,10 Therefore, it is essential to develop better systems for removing these drugs from water to reduce their negative impact on the environment.11
Among various methods for removing contaminants from water, such as chemical degradation, biodegradation, and physical adsorption,12–14 the latter has advantages such as being economical, bio-friendly and effective, which has now become one of the most feasible methods for water treatment.15 On the other hand, adsorptive removal by metal–organic frameworks (MOFs) represents a relatively low-cost and efficient alternative.16 MOFs, are made by self-assembly of metal ions or clusters and organic ligands with multiple binding sites (N or O atoms). Some of the most prominent advantages of MOFs over other materials such as zeolites are ultrahigh surface area, large pore volume, adjustable surface properties (unsaturated metal sites) and tunability.17 Recently, MOFs have attracted widespread attention in the treatment of pollutants in wastewater beside other important applications such as drug delivery,18 sensing19 and separation.20 There are various pathways for adsorptive removal of contaminants such as: (1) adsorption onto a coordinatively unsaturated site, (2) adsorption via acid–base interaction, (3) adsorption via π-complex formation, (4) adsorption via hydrogen bonding, (5) adsorption via electrostatic interaction.16 MIL-100‡(Fe), made from Fe3+ and trimesate, has demonstrated desirable chemical stability in aqueous medium (Table S1†).21 However, the fragile nature of MOFs (in this case MIL-100(Fe)) is still a challenge for commercial use.22–24 Previous studies have suggested that carboxymethylated cellulose (CMC) improves the immobility and dispersibility of anchoring MOFs and facilitates the adsorption of contaminants from water.25,26 In addition, the performance of cellulose-MOF composite is better than other adsorbents for adsorptive removal of contaminants, which is mainly due to hydrophilicity and modifiable nature of cellulose fibers.21,27,28 There are –OH and –COOH functional groups in the skeleton of cellulose fibers which facilitate the immobilization of other materials29 (Fig. S1†).
In this study, particles of MIL-100(Fe) were grown onto a carboxymethylated cellulose filter paper at room temperature under sonochemical condition, which to the best of our knowledge is an unprecedented technique for preparing a composite from CMC and MIL-100(Fe), namely MIL-100(Fe)@CMC. Ultrasonic synthesis is a simple, efficient, low cost and environmentally friendly approach to the preparation of various materials, especially coordination compounds in comparison with traditional synthetic techniques.30 Meanwhile, lorazepam was chosen as an important and widely used candidate of benzodiazepines' family and its removal from wastewater was studied using MIL-100(Fe)@CMC. Some of the important chemical properties of lorazepam are presented in Table S2.† So far, the application of MIL-100(Fe)@CMC for lorazepam removal was not studied in detail to the best of our knowledge. There are various reports regarding the presence of lorazepam in wastewaters around the world. According to the previous studies, surveying the ground waters in specific zone in Spain, indicated that the drug with the highest concentration registered among benzodiazepine compounds was lorazepam (89![[thin space (1/6-em)]](https://www.rsc.org/images/entities/char_2009.gif) 900 ng L−1).31 However, based on the later studies performed by Cunha et al., no results on ecotoxicological assays were found for lorazepam, and the only data obtained was derived from ECOSAR§ values for freshwater fish, daphnids, and green microalgae, which were 107, 3283, and 1878 μg L−1, respectively. They also reported that PNEC¶ECOSAR for lorazepam was estimated as 10.7 μg L−1.32 In addition, previous investigations also reported RQ|| values greater than one for the lorazepam in aqueous matrix. In a study conducted in Portugal, RQ > 1 was found for lorazepam by using a modified estimation of PEC values. However, there are not enough information about the environmental concentrations of lorazepam as well as ecotoxicity data, which indicates that every effort regarding the detection and removal of lorazepam from wastewaters should be noted.
900 ng L−1).31 However, based on the later studies performed by Cunha et al., no results on ecotoxicological assays were found for lorazepam, and the only data obtained was derived from ECOSAR§ values for freshwater fish, daphnids, and green microalgae, which were 107, 3283, and 1878 μg L−1, respectively. They also reported that PNEC¶ECOSAR for lorazepam was estimated as 10.7 μg L−1.32 In addition, previous investigations also reported RQ|| values greater than one for the lorazepam in aqueous matrix. In a study conducted in Portugal, RQ > 1 was found for lorazepam by using a modified estimation of PEC values. However, there are not enough information about the environmental concentrations of lorazepam as well as ecotoxicity data, which indicates that every effort regarding the detection and removal of lorazepam from wastewaters should be noted.
The effects of adsorption parameters such as the pH of the solution, the dosage of the adsorbent, and reusability of the adsorbent were investigated. Besides, adsorption kinetics and isotherms were also studied to develop an appropriate model for adsorptive removal of lorazepam from wastewater.
2. Experimental
2.1 Reagents and materials
Pure powder of lorazepam, was a kind gift of the Dr Abidi Pharmaceuticals (Tehran, Iran). Trimesic acid was purchased from TCI Chemicals (Shanghai, China). Iron(III) chloride hexahydrate, 97% was purchased from Alfa-Aesar (Shanghai, China). NaCl powder (purity >99.5%) was purchased from Sigma-Aldrich (Shanghai, China). Sodium hydroxide granulated EMPLURA® was purchased from Merck (Shanghai, China). Sodium chloroacetate, 98% was purchased from Alfa-Aesar (Shanghai, China). Whatman® qualitative filter paper, Grade 4 was purchased from Merck (Munich, Germany) and used as the source of cellulose. Acid-water washed coal base activated carbon was purchased from Lenntech DMCC (Dubai – UAE). All HPLC solvents were purchased from Lobachemie (New Delhi, India). Transmission spectra were obtained with an UV-vis spectrophotometer (Lambda 850, PerkinElmer). All experiments were carried at room temperature (25 °C). Ultrasonic syntheses were carried out on a SONIC 3MX, (maximum 160 W at 37 kHz). Nonspecific transmittance was recorded from 200–400 nm in 1 nm increments.2.2 Preparation of [Fe3O(H2O)2OH(C9H3O6)2]·nH2O (MIL-100)
Ethyl ester 1,3,5-benzenetricarboxylic (1.94 g, 6.6 mmol) and FeCl3·6H2O (2.70 g, 10 mmol) were poured into a Teflon-lined autoclave (125 mL) with 50 mL of dH2O. The autoclave was heated at 130 °C for 72 h. After cooling to RT, the obtained solid was recovered by filtration. A total of 1 g of the obtained solid was refluxed first in bi-distilled water (Milli-Q water, 150 mL, 3 h) and then in absolute ethanol (150 mL, 3 h). The solid was then suspended in a KF solution (0.1 M, 50 mL, 3 h, 70 °C) and hot filtered. Finally, it was suspended in 150 mL of Milli-Q water (2 h, RT) and recovered by filtration.2.3 Preparation of carboxymethylated cellulose (CMC)
Carboxymethylation of cellulose was performed by immersing Whatman® qualitative filter paper, Grade 4 in 100 mL of sodium hydroxide 15% solution of water and ethanol (2![[thin space (1/6-em)]](https://www.rsc.org/images/entities/char_2009.gif) :
:![[thin space (1/6-em)]](https://www.rsc.org/images/entities/char_2009.gif) 1) according to a typical method.33 Sodium chloroacetate (11.6 g, 0.1 mol) was added to the above solution and then stirred for 90 minutes. The treated paper then immersed in distilled water and was rinsed with 100 mL of distilled water and ethanol. The final product was transferred to the oven and was dried at 60 °C under vacuum for 4 hours.
1) according to a typical method.33 Sodium chloroacetate (11.6 g, 0.1 mol) was added to the above solution and then stirred for 90 minutes. The treated paper then immersed in distilled water and was rinsed with 100 mL of distilled water and ethanol. The final product was transferred to the oven and was dried at 60 °C under vacuum for 4 hours.
2.4 Preparation of MIL-100(Fe)@CMC
The first solution was made by adding ethyl ester 1,3,5-benzenetricarboxylic (1.94 g, 6.6 mmol) to 25 mL of water. Meanwhile, FeCl3·6H2O (2.70 g, 10 mmol) was poured into another beaker containing 98 mL of water. Swatches of CMC were added to this beaker and was stirred for 30 minutes at ambient temperature. After that, the first solution was added dropwise to the beaker in an ultrasonic bath for 2 hours, operating at 37 kHz with a maximum power output of 160 W and was stirred for 24 hours. Then it was rinsed with water and ethanol for multiple times. The final product was dried in oven at 60 °C for 72 hours.2.5 Characterization of adsorbents (MIL-100(Fe), MIL-100(Fe)@CMC)
The powder X-ray diffraction (XRD) patterns of the adsorbents were recorded using a Bruker D8 Advance X-ray diffractometer (Cu Kα radiation 1.5418 Å) for evaluating the crystalline structure and composition. Fourier-transform infrared (FT-IR) spectra were acquired with a Nicolet NEXUS 670 spectrophotometer. The morphology of the products was observed using a scanning electron microscope (SEM). The thermal stability of the adsorbents was determined by simultaneous Q600 thermogravimetric analysis (TGA)/differential scanning calorimetry (DSC; TA Instruments, DE, USA) at a heating rate of 10 °C min−1. BET surface areas of the as obtained products were measured on a Micromeritics ASAP 2460 Sorptometer using nitrogen at −196 °C. Zeta potential measurements were performed on SZ-100z Dynamic Light Scattering & Zeta potential analyzer (Horiba Scientific, China).2.6 Adsorption studies
Before adsorption, adsorbents were dried in a vacuum oven at 100 °C for 3 h. The adsorption capacity of adsorbents towards the lorazepam were determined by UV-vis spectrophotometry. Typically, 1, 2, 3, 4 and 5 mg of adsorbents were added into 10 mL of stock solution of lorazepam at 80 mg L−1. The concentrations were determined using an UV-spectrophotometer at 320 nm respectively. The calibration curves were obtained from the spectra of standard solutions of lorazepam, which were used to determine the residual concentrations in solutions. At different times (1, 2, 5, and 10 minutes), the solution was centrifuged and the concentration of free lorazepam in the solution was determined using the spectrophotometer.The amount of adsorption is determined by the equation;
 | (1) |
2.7 Effect of pH
To evaluate the impact of the pH value on the adsorption performances of the as-synthesized adsorbents, 0.1 M HCl and 0.1 M NaOH solutions were used to modulate the pH value of the initial solution.2.8 Regeneration
To investigate the percentage of regenerating the adsorbents, lorazepam loaded adsorbents were recovered by centrifugation, washed with methanol and acetone extensively for 15 minutes. The regenerated adsorbents were dried prior and used for the next cycle of adsorption.3. Results and discussion
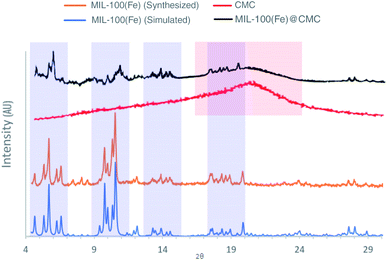
3.1 Characterization of MIL-100(Fe) and MIL-100(FE)@CMC
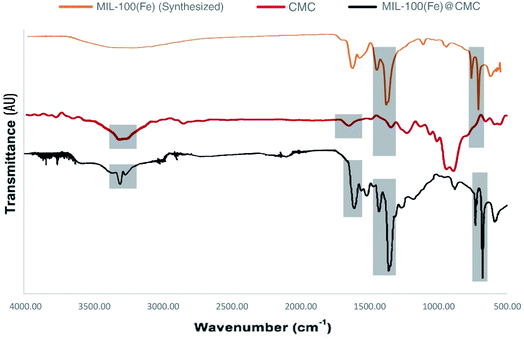
![[double bond, length as m-dash]](https://www.rsc.org/images/entities/char_e001.gif) C vibration of benzene ring in MIL-100(Fe). The peaks at 715 cm−1 and 770 cm−1 are assigned to the Fe–OH bond, which appeared in MIL-100(Fe). The spectrum bands observed at 710 cm−1 and 750 cm−1 in MIL-100(Fe)@CMC are attributed to Fe–O bonds, indicating successful deposition of MIL-100(Fe) on the paper surface.39 It should be noted that the absorption bands of O–C
C vibration of benzene ring in MIL-100(Fe). The peaks at 715 cm−1 and 770 cm−1 are assigned to the Fe–OH bond, which appeared in MIL-100(Fe). The spectrum bands observed at 710 cm−1 and 750 cm−1 in MIL-100(Fe)@CMC are attributed to Fe–O bonds, indicating successful deposition of MIL-100(Fe) on the paper surface.39 It should be noted that the absorption bands of O–C![[double bond, length as m-dash]](https://www.rsc.org/images/entities/char_e001.gif) O stretching and C–H bending respectively appeared at 1591 cm−1 and 1159 cm−1. Overall, the FT-IR result of MIL-100(Fe)@CMC shows that absorption peaks refer to successful coordination of Fe3+ to –COO− groups located on CMC.
O stretching and C–H bending respectively appeared at 1591 cm−1 and 1159 cm−1. Overall, the FT-IR result of MIL-100(Fe)@CMC shows that absorption peaks refer to successful coordination of Fe3+ to –COO− groups located on CMC.
| Sample | MIL-100(Fe) | CMC | MIL-100(Fe)@CMC |
|---|---|---|---|
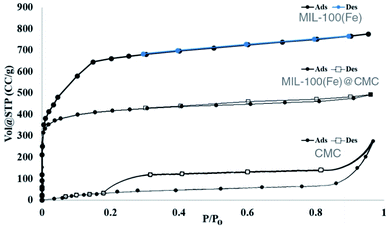
| BET surface area (m2 g−1) | 2.000 × 10³ | 78.50 | 977.0 |
3.2 Effect of adsorbents on adsorption performance
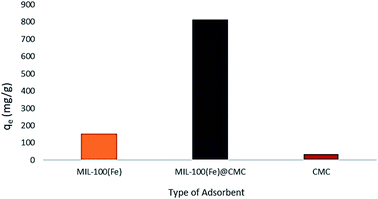
The performance of MIL-100(Fe), CMC and MIL-100(Fe)@CMC on the removal of lorazepam are compared in Fig. 6. It can be seen that the adsorption of lorazepam on MIL-100(Fe)@CMC has been significantly improved comparing to MIL-100(Fe) and bare CMC. The improvised chemical stability of MIL-100(Fe)@CMC in the aqueous media has led to an observable elevation in the capacity of adsorbent due to the fact that almost no trimesate was detected by HPLC, which will be discussed in section 3.7. This data is supported by the UV-vis spectra (Fig. 7). In these spectra, the amount of lorazepam in the solution was measured at 320 nm. As it can be seen, after 10 minutes, a lot of noises are present in the 200–280 nm which are predominantly belong to trimesate ion. This is in regard with the fact that MIL-100(Fe) does not demonstrate mechanical stability in the aqueous medium with harsh conditions.43 As it can be seen, the bare CMC did not provide an observable adsorption and the MIL-100(Fe) demonstrated higher adsorption comparing to CMC, yet still a great peak is observable due to the presence of lorazepam after 10 minutes (it should be noted that 10 minutes has chosen as the equilibrium time which means that after this time, the concentration of lorazepam remains intact). The CMC fibers act as the structural component supporting the functional MIL-100(Fe) in 3D armored material. Literature review indicated that the adsorption capacity of pure MOFs and bare cellulosic fibers are lower than the hybrid material.44 This elevated performance is possibly resulted from the hierarchical porous structure where the combination of facile accessibility through macropores and the capillary effect of mesopores, allow for fast water uptake and contact between the MIL-100(Fe) micropores and the contaminant. | ||
| Fig. 7 The UV-vis spectra of lorazepam after 10 minutes (at equilibrium) using (a) MIL-100(Fe)@CMC, (b) MIL-100(Fe), and (c) CMC. | ||
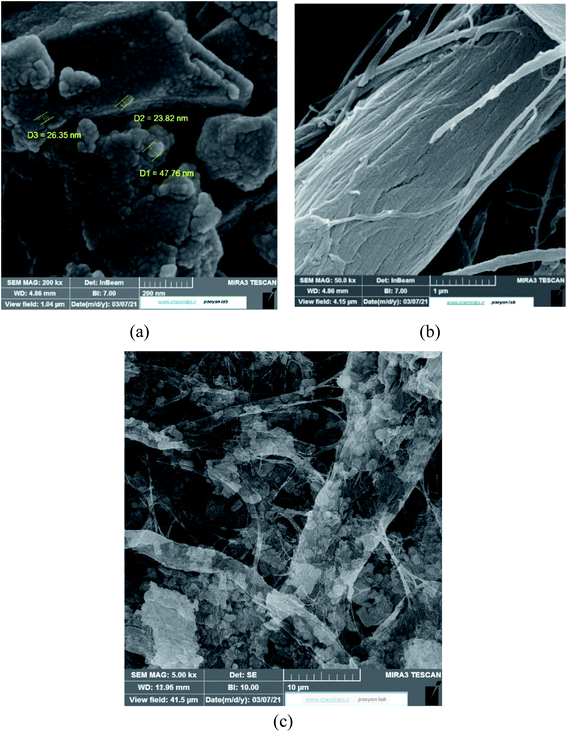
However, the presence of CMC provided a great mechanical stability in the harsh conditions. In order to support this statement, bare CMC was put in aqueous batch under acidic conditions and was stirred harshly for 48 hours. Then it was collected and the process was performed again. After 96 hours of treatment, the fibers of CMC still hold their integrity, although some bonds are broken. Meanwhile the integrity of composite was checked and the final images of the composite reveals that it is well preserved after treatment (Fig. 8b). As it can be seen in Fig. 8c, the mechanical corrosion is occurred in the particles of MIL-100(Fe) and the previously well shaped particles are now abrased and the fractures are emerged. Improving mechanical stability and resistance to corrosion was previously studied and it was suggested that making composites is an effective way to overcome this issue.45 Finally, the images of MIL-100(Fe)@CMC were checked after 3 cycles and it is clear that the composite has preserved its structure (Fig. 8d).
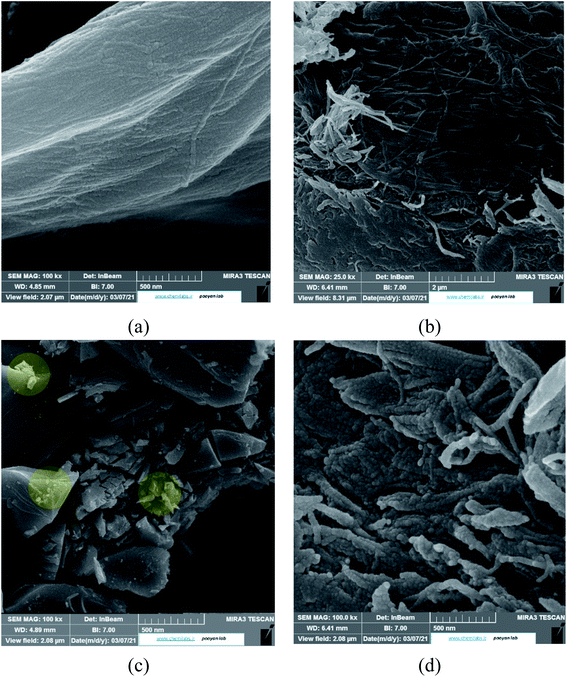 | ||
| Fig. 8 The SEM images of (a) CMC before treatment, (b) CMC after treatment, (c) MIL-100(Fe) after treatment, and (d) MIL-100(Fe)@CMC after treatment. | ||
3.3 Adsorption kinetics
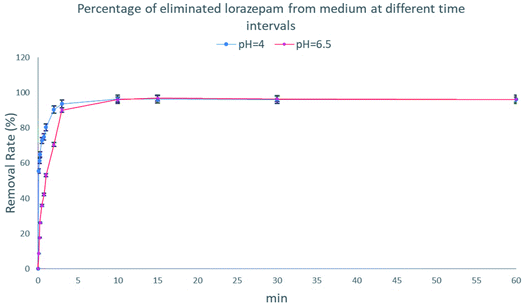
The effect of time on the adsorption of MIL-100(Fe)@CMC was investigated. As shown in Fig. 9, the adsorption capacity increases rapidly before 10 minutes due to the specific surface area and a large number of active adsorption sites which were gradually occupied and the adsorption rate slows down finally reaching the equilibrium. However, the adsorption rate is slightly faster in acidic medium due to the interactions of composite and lorazepam which will be discussed in section 3.5.Both pseudo-first-order kinetic model and the pseudo-second-order are reported for adsorption based on composites.46–48 The linear form of pseudo-first-order is represented in eqn (2).
 | (2) |
The kinetics were further analyzed using pseudo-second-order model which is expressed as eqn (3).
 | (3) |
| Model | Parameter | Adsorbent |
|---|---|---|
| Pseudo-first-order | K1 | 0.0128 |
| R2 | 0.9997 | |
| Pseudo-second-order | K2 | 0.00473 |
| R2 | 0.9869 |
3.4 Adsorption isotherm
The adsorption isotherms of MIL-100(Fe)@CMC for the adsorption of lorazepam is shown in Fig. 10. The experimental data were fitted using the Langmuir and Freundlich adsorption isotherm equations. The Langmuir adsorption isotherm model is given as eqn (4).
 | (4) |
 | ||
| Fig. 10 Isotherm of lorazepam adsorption onto MIL-100(Fe)@CMC based on Langmuir (left) and Freundlich models (right). | ||
The Freundlich adsorption isotherm model is represented as eqn (5).
 | (5) |
The fitting results are shown in Fig. 10. The higher linear correlation coefficient (R2) of the Langmuir adsorption indicates that the adsorption follows the Langmuir adsorption model mostly. It could be concluded that although a monolayer adsorption takes place mostly, agglomerated areas of composite tend to demonstrate multilayer adsorption too.
3.5 Effect of pH values on adsorption performance
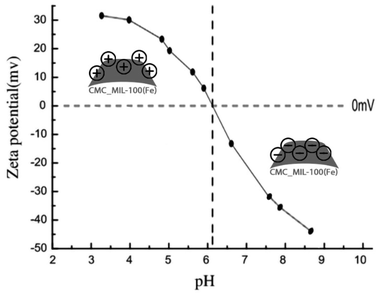
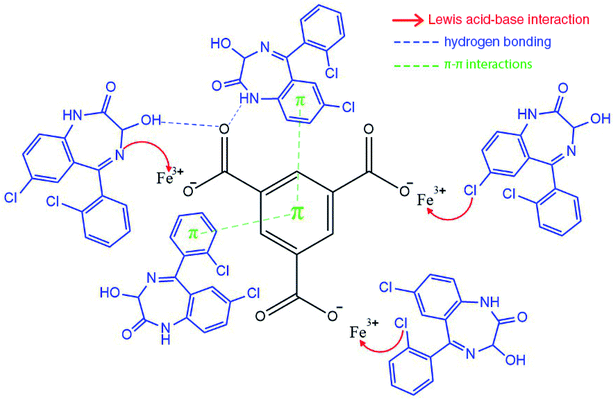
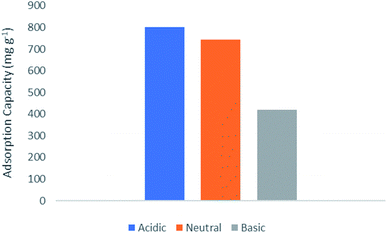
The effect of pH values on the adsorption of lorazepam onto MIL-100(Fe)@CMC is shown in Fig. 11. The point of zero charge (pHzc) for MIL-100(Fe)@CMC was calculated to be 6.1. Therefore, when pH < pHzc, the surface of the adsorbent acquires positive charge. When pH > pHzc, the surface of the MIL-100(Fe)@CMC acquires negative charge through hydrogen bonding. The adsorption under faintly acidic conditions is better due to the positive charge on the surface of adsorbent. Although pH = 6.5 does not manipulate the amount of adsorbed lorazepam, the rate decreased slightly. This is mainly due to the reason that lorazepam has two pka (pk1 = 1.3 and pk2 = 11.5).51 As the pH value increases, OH− in the solution increases and competes with lorazepam so it decreases the rate of adsorption. The abovementioned findings are not only in accordance with the lower amount of lorazepam loading onto MIL-100(Fe) in current study, they are also compatible with the previous findings which the pHzc for MIL-100(Fe) was calculated to be 3.2 which implies the reason of the inefficiency of bare MIL-100(Fe) confronting MIL-100(Fe)@CMC.52–54 The adsorption capacity of the composite for lorazepam is improved through electrostatic attractions between the positive charge on the surface of composite and the negative charge of the lorazepam. The carboxyl and hydroxyl groups on the surface of CMC or the carboxyl groups of terephthalic acid interacts with lorazepam by hydrogen bonding. Other interactions such as π–π stacking are probably responsible for the adsorption according to the literature review.55,56 Possible adsorption mechanism for lorazepam onto MIL-100(Fe)@CMC at the optimized adsorption level are proposed in Fig. 12.Based on the previous understanding of the electrostatic mechanism of adsorption, the adsorption of lorazepam onto MIL-100(Fe)@CMC was measured in various mediums with different initial pH (4, 6/5, 9). As it was expected, the amount of adsorbed lorazepam was decreased by increasing the pH which indicates the validity of the data acquired from ZP (Fig. 13). The removal efficiency however decreased more significantly. The removal efficiency in acidic medium is 95% which indicates that almost all of the lorazepam in solution is adsorbed. As a result of increasing the pH, the efficiency decreases to 75% in neutral medium and 35% in alkaline medium.
3.6 Effect of the adsorbent dosage
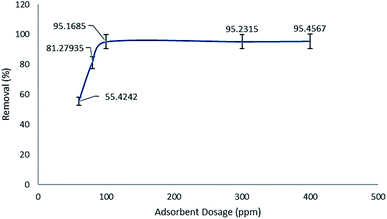
As it was previously discussed, MIL-100(Fe)@CMC was utilized in various amounts comparing to the maximum dissolved lorazepam concentration. As it is shown in Fig. 14, 100 ppm of composite is considered as the optimized amount. The capacity of 80 and 60 ppm declines drastically and after 100 ppm, almost no meaningful alteration is observed. It should be noted that the standard error in the whole experiment is set to 5%.3.7 Effect of ionic compounds on the removal efficiency
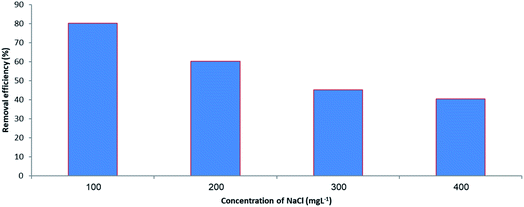
In order to evaluate the effect of ionic compounds on the adsorptive capacity of MIL-100(Fe)@CMC, various concentrations of NaCl were added to the initial solution. The data reveals that by increasing the concentration of NaCl from 100 mg L−1 to 400 mg L−1, the removal efficiency decreases drastically. Our findings and comparing the data to the other studies, suggests that by increasing the concentration of ions in the medium, the chlorine ions will compete with lorazepam and they will occupy the empty sites of metal so the amount of free lorazepam would be increased by increasing the amount of NaCl in the medium (Fig. 15).3.8 Reusability of the adsorbent
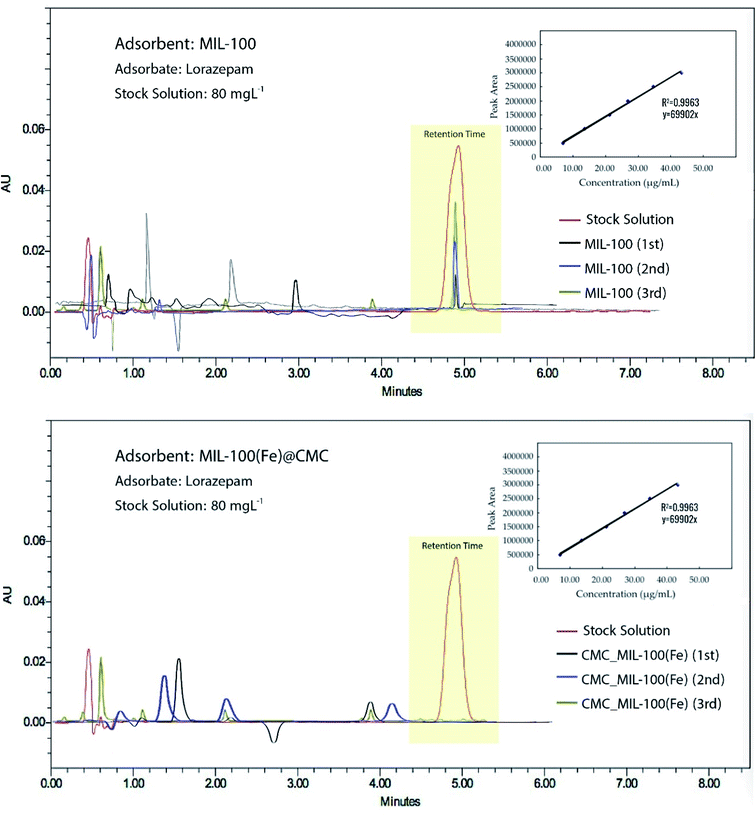
After the adsorption process, the MIL-100(Fe)@CMC was collected from the solution and then added into 100 mL of ethanol and stirred for 30 min and the same process was repeated with acetone. The adsorbent was washed repeatedly by deionized water, dried in an oven at 70 °C, and finally activated in a vacuum drier at 150 °C for 10 h for the next experiment. The recovered material was again used as adsorbent for the adsorption of lorazepam. The results of are shown in Fig. 16.HPLC was used to check the presence of trimesate in the medium after each cycle and as it is shown in chromatogram of Fig. 17a, there is no evidence of ligand leaching into the medium. As it is depicted in Fig. 17b, the peak at RT = 5 min is shortened after the first cycle of using MIL-100(Fe) as the adsorbent. After the second and third cycle, the peaks are grown again which indicates that the adsorbent has lost its efficiency. On the other hand, from the chromatograms of Fig. 18, it is concluded that not only there are no observable peaks for lorazepam after the first cycle of using MIL-100(Fe)@CMC as the adsorbent, after regeneration, the efficiency is not decreased and the composite works smoothly. However, after the third cycle, some noises are observed in the RT = 5 min, which indicates that the efficiency of the adsorbent starts to decrease but yet it is not in the limit of detection area. It is quite possible that after some more cycles, the efficiency decreases, slowly or drastically.
 | ||
| Fig. 17 Chromatograms of released BTC (RT = 15 min); after 3 cycles of adsorption/desorption using (a) MIL-100(Fe) and (b) MIL-100(Fe)@CMC. | ||
In order to shed some light on our results, previous studies regarding the removal of lorazepam from wastewaters are summarized and compared in Table 3. It is clear that the adsorbents in this study, especially the composite, demonstrate outstanding results.
| Type of adsorbent | wt% (adsorbed lorazepam/total lorazepam) − capacity (mg g−1) | Ref. | |
|---|---|---|---|
| 1 | Magnetic zinc adeninate framework | Removal: 85% − 48.45 mg g−1 | 57 |
| Removal: 80% − 45.6 mg g−1 | |||
| 2 | Activated carbon | Removal: 42% − 84 mg g−1 (pH = 5.5–6) | 58 |
| Removal: 62% − 124 mg g−1 (pH = 7.6) | |||
| Removal: 72% − 144 mg g−1 | |||
| 3 | Activated carbon functionalized with amine | Removal: 26% − 52 mg g−1 (pH = 5.5–6) | |
| Removal: 20% − 40 mg g−1 (pH = 7.6) | |||
| 4 | Activated carbon functionalized with 3-amino-triethoxysilane | Removal: 27% − 54 mg g−1 (pH = 5.5–6) | |
| Removal: 20% − 40 mg g−1 (pH = 7.6) | |||
| 5 | Activated carbon functionalized with 3-mercaptopropyl-trimethoxysilane | Removal: 22% − 44 mg g−1 (pH = 5.5–6) | |
| 6 | Activated carbon functionalized with melamine | Removal: 30% − 60 mg g−1 (pH = 5.5–6) | |
| Removal: 18% − 36 mg g−1 (pH = 7.6) | |||
| 7 | Magnetite red mud nanoparticles | Removal: 80% − 90.5 mg g−1 (pH = 6.5–7) | 59 |
| 8 | Powdered activated carbon | Removal: 68% − 120 mg g−1 (pH = 7.8–8) | 60 |
| 9 | MIL-100(Fe) | Removal: ∼80% − 150 mg g−1 | This study |
| 10 | MIL-100(Fe)@CMC | Removal: ∼95% − 811 mg g−1 | This study |
4. Conclusion
In summary, the current study focuses on improving previously well-known MIL-100(Fe) with cellulose for removal of lorazepam from wastewaters. In this regard, MIL-100(Fe)@CMC was prepared in situ based on previously reported methods with minor yet effective modifications and it was engineered for wastewater treatment. Accordingly, various ratios of the adsorbent were tested and the results demonstrated that 100 ppm of MIL-100(Fe)@CMC is much more effective than 400 ppm of MIL-100(Fe) in the adsorption process. The adsorption of lorazepam was further analyzed with the pseudo-first-order and the pseudo-second-order mathematical kinetic models. As far as the data suggests, both models are suitable for describing the kinetics of adsorption but pseudo-first-order model fits better with the data. Also, the adsorption isotherms were analyzed with the Freundlich and Langmuir models, which both monolayer homogenous adsorption and multilayer heterogenous adsorption were acquired, which was expected due to the partially agglomeration which was seen in some regions of the composite. The results show that both MIL-100(Fe) and MIL-100(Fe)@CMC are effective materials for removing lorazepam meanwhile the composite demonstrates magnificent mechanical and chemical stability versus the bare MIL-100(Fe) and also the capacity of removal elevated from 150 mg g−1 in the case of MIL-100(Fe) to 811 mg g−1 for MIL-100(Fe)@CMC. Further studies revealed that the composite is recyclable and reliable for at least three cycles of reuse both in acidic and neutral aquatic medium. Finally, it is noteworthy to mention that both ingredients of this composite, MIL-100(Fe) and CMC, are economical, biocompatible and eco-friendly which turns this composite to a great candidate for large scale production and applications.Conflicts of interest
There are no conflicts to declare.Acknowledgements
This work has been supported by the Center for International Scientific Studies & Collaboration (CISSC), Ministry of Science Research and Technology of Iran.References
- B. Pfefferbaum and C. S. North, N. Engl. J. Med., 2020, 383, 510–512 CrossRef CAS PubMed.
- H. Yao, J.-H. Chen and Y.-F. Xu, Lancet Psychiatr., 2020, 7, e21 CrossRef.
- W. Cullen, G. Gulati and B. Kelly, QJM: An International Journal of Medicine, 2020, 113, 311–312 CrossRef CAS PubMed.
- F. Torres-Bondia, J. de Batlle, L. Galván, M. Buti, F. Barbé and G. Piñol-Ripoll, BMC Public Health, 2020, 20, 1–9 CrossRef PubMed.
- O. I. Piatek, J. C.-m. Ning and D. R. Touchette, Am. J. Health-Syst. Pharm., 2020, 77, 1778–1785 CrossRef PubMed.
- N. M. Farrell, B. D. Hayes and J. A. Linden, Am. J. Emerg. Med., 2021, 40, 202–203 CrossRef PubMed.
- M. Sánchez Díaz, M. L. Martín-Calvo and R. Mateos-Campos, Int. J. Environ. Res. Public Health, 2021, 18, 5944 CrossRef PubMed.
- B. Subedi, S. Lee, H.-B. Moon and K. Kannan, Environ. Sci. Technol., 2013, 47, 13321–13329 CrossRef CAS PubMed.
- S. Yuan, X. Jiang, X. Xia, H. Zhang and S. Zheng, Chemosphere, 2013, 90, 2520–2525 CrossRef CAS PubMed.
- B. Subedi and K. Kannan, Sci. Total Environ., 2015, 514, 273–280 CrossRef CAS PubMed.
- M. Sousa, C. Gonçalves, E. Cunha, J. Hajšlová and M. Alpendurada, Anal. Bioanal. Chem., 2011, 399, 807–822 CrossRef CAS PubMed.
- I. A. Saleh, N. Zouari and M. A. Al-Ghouti, Environ. Technol. Innovat., 2020, 101026 CrossRef.
- Y. Zhang, S. Cao, Y. Wang, G. Wang and T. Sun, 2021.
- J. Hu, Z. Li, A. Zhang, S. Mao, I. R. Jenkinson and W. Tao, Environ. Res., 2020, 109764 CrossRef CAS PubMed.
- D. Zaman, M. K. Tiwari and S. Mishra, in Measurement, Analysis and Remediation of Environmental Pollutants, Springer, 2020, pp. 397–421 Search PubMed.
- N. A. Khan, Z. Hasan and S. H. Jhung, J. Hazard. Mater., 2013, 244–245, 444–456 CrossRef CAS PubMed.
- H. Furukawa, K. E. Cordova, M. O'Keeffe and O. M. Yaghi, Science, 2013, 341 Search PubMed.
- S. D. Taherzade, S. Rojas, J. Soleimannejad and P. Horcajada, Nanomaterials, 2020, 10, 2296 CrossRef CAS PubMed.
- F. Moghzi, J. Soleimannejad, E. C. Sañudo and J. Janczak, ACS Appl. Mater. Interfaces, 2020, 12, 44499–44507 CrossRef CAS PubMed.
- F. Moghzi, J. Soleimannejad, E. C. Sanudo and J. Janczak, Mater. Res. Bull., 2020, 122, 110683 CrossRef CAS.
- E. Bellido, M. Guillevic, T. Hidalgo, M. J. Santander-Ortega, C. Serre and P. Horcajada, Langmuir, 2014, 30, 5911–5920 CrossRef CAS PubMed.
- M. Bosch, M. Zhang and H.-C. Zhou, Adv. Chem., 2014, 2014, 1155 Search PubMed.
- N. C. Burtch, H. Jasuja and K. S. Walton, Chem. Rev., 2014, 114, 10575–10612 CrossRef CAS PubMed.
- D. Yang, Y. Chen, Z. Su, X. Zhang, W. Zhang and K. Srinivas, Coord. Chem. Rev., 2021, 428, 213619 CrossRef CAS.
- S. Ma, M. Zhang, J. Nie, J. Tan, S. Song and Y. Luo, Carbohydr. Polym., 2019, 208, 328–335 CrossRef CAS PubMed.
- Ş. Yılmaz, A. Zengin and T. Şahan, Environ. Technol. Innovat., 2021, 24, 101799 CrossRef.
- J. J. Richardson, B. L. Tardy, J. Guo, K. Liang, O. J. Rojas and H. Ejima, ACS Sustainable Chem. Eng., 2019, 7, 6287–6294 CrossRef CAS.
- J. Nie, H. Xie, M. Zhang, J. Liang, S. Nie and W. Han, Carbohydr. Polym., 2020, 250, 116955 CrossRef CAS PubMed.
- M. Thakur, A. Sharma, V. Ahlawat, M. Bhattacharya and S. Goswami, Mater. Sci. Energy Technol., 2020, 3, 328–334 CAS.
- D. Taherzade and J. Soleimannejad, Ultrason. Sonochem., 2016, 32, 277–283 CrossRef CAS PubMed.
- D. L. Cunha, F. G. de Araujo and M. Marques, Environ. Sci. Pollut. Res., 2017, 24, 24076–24091 CrossRef CAS PubMed.
- A. M. P. T. Pereira, L. J. G. Silva, C. M. Lino, L. M. Meisel and A. Pena, Sci. Total Environ., 2017, 603–604, 226–236 CrossRef CAS PubMed.
- Y. Wang, P. Zhou, D. Xiao, Y. Zhu, Y. Zhong, J. Zhang, X. Sui, X. Feng, H. Xu and Z. Mao, Carbohydr. Polym., 2019, 221, 202–208 CrossRef CAS PubMed.
- C. Duan, C. Liu, X. Meng, W. Lu and Y. Ni, Appl. Organomet. Chem., 2019, 33, e4865 CrossRef.
- Q. Xie, Y. Li, Z. Lv, H. Zhou, X. Yang, J. Chen and H. Guo, Sci. Rep., 2017, 7, 3316 CrossRef PubMed.
- Y. Akbulut and A. Zengin, Sens. Actuators, B, 2020, 304, 127276 CrossRef CAS.
- W. Wei, S. Kim, M.-H. Song, J. K. Bediako and Y.-S. Yun, J. Taiwan Inst. Chem. Eng., 2015, 57, 104–110 CrossRef CAS.
- M. Sanchez-Sanchez, I. de Asua, D. Ruano and K. Diaz, Cryst. Growth Des., 2015, 15, 4498–4506 CrossRef CAS.
- S.-W. Lv, J.-M. Liu, C.-Y. Li, N. Zhao, Z.-H. Wang and S. Wang, Chem. Eng. J., 2019, 375, 122111 CrossRef CAS.
- N. U. Qadir, S. A. Said, R. B. Mansour, K. Mezghani and A. Ul-Hamid, Dalton Trans., 2016, 45, 15621–15633 RSC.
- S. Ullah, M. A. Bustam, A. G. Al-Sehemi, M. A. Assiri, F. A. Abdul Kareem, A. Mukhtar, M. Ayoub and G. Gonfa, Microporous Mesoporous Mater., 2020, 296, 110002 CrossRef CAS.
- X. Yan, S. Komarneni, Z. Zhang and Z. Yan, Microporous Mesoporous Mater., 2014, 183, 69–73 CrossRef CAS.
- A. J. Howarth, Y. Liu, P. Li, Z. Li, T. C. Wang, J. T. Hupp and O. K. Farha, Nat. Rev. Mater., 2016, 1, 15018 CrossRef CAS.
- H. Zhu, X. Yang, E. D. Cranston and S. Zhu, Adv. Mater., 2016, 28, 7652–7657 CrossRef CAS PubMed.
- H. Chen, F. Wang, H. Fan, R. Hong and W. Li, Chem. Eng. J., 2021, 408, 127343 CrossRef CAS.
- Y. Liu, D. W. Blowes and C. J. Ptacek, Data Brief, 2019, 27, 104569 CrossRef PubMed.
- Q. Ren, F. Wei, H. Chen, D. Chen and B. Ding, Green Process. Synth., 2021, 10, 125–133 CrossRef CAS.
- T. Shahwan, Chem. Eng. Res. Des., 2015, 96, 172–176 CrossRef CAS.
- Y.-S. Ho, J. Hazard. Mater., 2006, 136, 681–689 CrossRef CAS PubMed.
- N. Bakhtiari and S. Azizian, J. Mol. Liq., 2015, 206, 114–118 CrossRef CAS.
- J. G. Rutgers and C. M. Shearer, in Analytical profiles of drug substances, Elsevier, 1981, vol. 9, pp. 397–426 Search PubMed.
- P. W. Seo, B. N. Bhadra, I. Ahmed, N. A. Khan and S. H. Jhung, Sci. Rep., 2016, 6, 1–11 CrossRef PubMed.
- G. Chaturvedi, A. Kaur, A. Umar, M. A. Khan, H. Algarni and S. K. Kansal, J. Solid State Chem., 2020, 281, 121029 CrossRef CAS.
- Y. Wang, R. Zhou, C. Wang, G. Zhou, C. Hua, Y. Cao and Z. Song, J. Alloys Compd., 2020, 817, 153286 CrossRef CAS.
- S. Luo, X. Xu, G. Zhou, C. Liu, Y. Tang and Y. Liu, J. Hazard. Mater., 2014, 274, 145–155 CrossRef CAS PubMed.
- J. Tian, S. Wu, X. Yin and W. Wu, Appl. Surf. Sci., 2019, 496, 143696 CrossRef CAS.
- S. Zhang, W. Yao, D. Fu, C. Zhang and H. Zhao, J. Sep. Sci., 2018, 41, 1864–1870 CrossRef CAS PubMed.
- G. Jaria, M. A. Lourenco, C. P. Silva, P. Ferreira, M. Otero, V. Calisto and V. I. Esteves, J. Mol. Liq., 2020, 299, 112098 CrossRef CAS.
- S. Aydın, F. Bedük, A. Ulvi and M. E. Aydın, Sci. Total Environ., 2021, 784, 147174 CrossRef PubMed.
- R. Guillossou, J. Le Roux, R. Mailler, C. S. Pereira-Derome, G. Varrault, A. Bressy, E. Vulliet, C. Morlay, F. Nauleau, V. Rocher and J. Gasperi, Water Res., 2020, 172, 115487 CrossRef CAS PubMed.
Footnotes |
| † Electronic supplementary information (ESI) available. See DOI: 10.1039/d1ra08949h |
| ‡ Materials Institute Lavoisier. |
| § Ecological structure activity relationships class program. |
| ¶ Predicted no effect concentration. |
| || Risk quotient. |
| This journal is © The Royal Society of Chemistry 2022 |

