 Open Access Article
An innovative study on the “on–off–on” detection of sulfur ions based on a TSPP–riboflavin fluorescent probe
Huan Wang *a,
Wencheng Mua,
Yuanyuan Liub,
Yongchang Lu
 a,
Yuang Qiua and
Qin Ma*a
aModern Tibetan Medicine Creation Engineering Technology Research Center of Qinghai Province, College of Pharmacy, Qinghai Nationalities University, China. E-mail: qhmuwh1028@126.com
bYinchuan City Center for Disease Control and Prevention, Ningxia, China
First published on 16th February 2022
Abstract
In this paper, 5,10,15,20-(4-sulphonatophenyl) porphyrin (TSPP) was synthesized by a facile route and used as a fluorescent probe to construct a sensor system based on the high water solubility and high quantum yield. It was found that when riboflavin (RF) was introduced into the TSPP solution, the fluorescence intensity of TSPP decreased for the peaks at 645 nm and 700 nm based on the principle of the electrostatic attractions and hydrophobic interactions between TSPP and riboflavin. When the fluorescence emission peak of riboflavin appeared at 550 nm, the fluorescence sensor system changed from the “on” state to the “off” state. When sulfur ions (S2−) were further introduced into the TSPP–riboflavin system, the fluorescence intensity of riboflavin was further decreased based on the specific reaction between S2− and riboflavin. However, the fluorescence signal of TSPP was restored and the fluorescence sensing system changed from the “off” state to the “on” state. Therefore, TSPP was used as a fluorescent probe to construct an “on–off–on” fluorescent sensing system, the linear range of S2− detected by this system is 5.0 × 10⁻⁹ to 3.6 × 10⁻⁵ M, and the detection limit (LOD) is 1.1 × 10⁻⁹ M. The sensing system has higher accuracy and sensitivity, and it can be successfully used in the sensing of S2− in real samples.
Introduction
The sulfur ion (S2−) is an extremely toxic pollutant,1 which widely exists in natural water, domestic sewage, industrial waste water and biological systems. S2− also causes a series of health problems owing to it having close association with living organisms in a variety of way.2,3 Doing research about the detection of S2− has become an important part of environment, human health and food safety for sustainable development.4 Relevant medical research shows that free S2− in biological systems is easily transformed into harmful hydrogen sulfide at physiological pH value. Also, it is well known that low concentrations of sulfur ions can cause dizziness, and high concentrations of S2− can irritate the mucus in the cell membrane to cause suffocation,5 cardiac arrest, diabetes6 and other diseases. Therefore, it is urgent and necessary to find a simple, sensitive and fast method for S2− detection.Riboflavin, also known as vitamin B2 (VB2), is one of good water solubility in vitamin family, which plays an important role in living organisms.7 In the organisms, the main physiological function of VB2 is a coenzyme that can promote energy metabolism and biological oxidation–reduction processes, such as the metabolism of fat, carbohydrate and protein.8 Adding RF into supplemental intake or adequate dietary will have biological protective effects in terms of anti-aging,9 anti-inflammatory,10 antioxidant,11 and anticancer properties.12 Generally speaking, excess or lack of RF is harmful to the normal metabolism of the organism. In addition to playing an important role in living organisms, RF is also a good fluorescent emitter, which is often used to construct various luminescent sensing systems based on good fluorescence properties.13,14
In recent years, porphyrins have been used as probes for fluorescent analysis in many fields of detection, such as anions, cations, neutral molecules, DNA, RNA, proteins, cells and viruses detection, etc. In 1990, Sessler first reported the method of anions detection based on porphyrins.15 Lemon synthesized palladium porphyrins that was modified by quantum dot (QD), which improved the sensitivity of oxygen detected in organic solvents.16 Fry detected mercury ions by mean of the spectroscopic method based on associating the porphyrin with a solid support.17 Bu group have designed an on–off fluorescence sensor with high selectivity for cadmium(II).18 Lu group constructed various sensors based on porphyrin derivatives.19,20 Beyene constructed a novel on–off colorimetric and fluorescent sensor of Cu2+, Sn2+ and Zn2+ by water-soluble porphyrin.21 In these porphyrin derivatives, sulfonated porphyrins have been widely used in molecular recognition, fluorescence analysis,22 electrochemistry,23 drug therapy,24,25 electrochemiluminescence (ECL),26 photoelectrochemical sensor27 and other fields because of their excellent water-soluble, physical and chemical properties. However, up to now, the fluorescence detection method of S2− based on 5,10,15,20-sulfonic acid phenyl porphyrin–riboflavin (TSPP–VB2) fluorescence probe has not been reported.
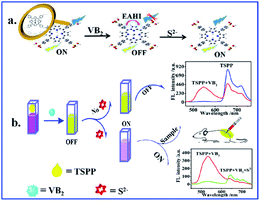
In this study, the physical characteristics of VB2 exhibit strong yellow green fluorescence under ultraviolet radiation, and its chemical characteristics can react with S2− specifically. The “on–off–on” fluorescence probe of TSPP–VB2 system is successfully constructed in this experimental environment, and its working principle is as shown in Fig. 1. TSPP at 645 nm has strong fluorescence under 460 nm excitation wavelength, which can be explained that the fluorescence signal of the fluorescence sensing system is the “on” state. When different concentrations of VB2 are introduced into TSPP solution, the fluorescence intensity of TSPP is gradually quenched due to the electrostatic attractions and hydrophobic interactions between VB2 and TSPP. With the increase of VB2 concentration, the fluorescence intensity of VB2 becomes progressively stronger especially at 550 nm, and the fluorescence intensity of TSPP in the sensing system changes from “on” to “off”. When a certain concentration of S2− is continually introduced into the TSPP–VB2 system, the fluorescence intensity of VB2 is gradually weakened owing to the specific reaction between VB2 and S2−. While the fluorescence signal of TSPP is restored, the fluorescence sensing system is restored to the “on” state.
Experimental
Reagents
NaHCO3 and Tris used in this experiment were all purchased from Yantai Shuangshuang Chemical Co., Ltd. Concentrated sulfuric acid (H2SO4, 98%) purchased from Baishi Reagent Company. Pyrrole, benzaldehyde, methanol, chloroform and propionic acid were purchased from Energy Chemical Reagent Company. The deionized water (18.25 m Ω) used in the experiment was prepared by ultra pure water mechanism in the laboratory. The other reagents were pure for analysis and were not further purified before their use, and all experiments were conducted at room temperature.Instrument
The fluorescence spectra were obtained through Cary Eclipse Fluorescence Analyzer (Agilent Technologies, USA). Ultraviolet-visible absorption spectra were collected in a TU-1901 spectrophotometer (Beijing's General Instrument Limited Company, Beijing, China); Fourier transform infrared spectra (FT-IR) spectra were recorded on an IR Prestige 21 (Shimadzu, Tokyo, Japan). The concentrated samples were collected through a rotary evaporator (BUCHI Labortechnik AG, Switzerland). Vacuum drying of samples were used for a DZF-6020 vacuum drying oven (Yuhua Instrument Co., Ltd., China). The pH of the samples were tested on a pHS-3B pH meter (Shanghai Precision Instrument Science Co., China).Synthesis of 5,10,15,20-tetraphenyl porphyrin (TPP) and 5,10,15,20-(4-sulfonic acid) tetraphenyl porphyrin (TSPP)
![[thin space (1/6-em)]](https://www.rsc.org/images/entities/char_2009.gif) :
:![[thin space (1/6-em)]](https://www.rsc.org/images/entities/char_2009.gif) 1 of the dichloromethane and petroleum ether. The final product was obtained about 4 g, and the 58% product was gotten by steaming and drying.
1 of the dichloromethane and petroleum ether. The final product was obtained about 4 g, and the 58% product was gotten by steaming and drying.Preparation of solutions
Fluorescence detection of sulfur ions (S2−)
At room temperature, the process of fluorescence detection of S2− based on TSPP–VB2 fluorescent probe is as the following: 30 μL (0.5 μM) TSPP stock solution and 1 mL (0.10 M, pH = 8) Tris–HCl buffer solution were taken into the 2 mL sample tube, and 50 μL (1 mM) VB2 solution is added into the above solution. Then, fresh S2− solution with different concentrations were separately mixed into the TSPP–VB2 system. Finally, 2 mL sample tube is fixed to the scale by the deionized water, and then shaking up it well. After incubating for about 5 min, the changes of fluorescence intensity of TSPP–VB2 solution were detected under the condition of the excitation wavelength of 460 nm and slit width of 5 × 5 nm.Real sample preparation
1 mL of blood was obtained from the ear of a rabbit, and it was placed in a centrifuge tube at room temperature for 4 h and refrigerated for 12 h. The upper layer of serum was removed in an ultraclean hood, centrifuged at 4000 rpm for 15 min. After the process of preparation above, the serum was collected. It was processed by the aseptic method, and then refrigerated until analysis.4 g milk was accurately weighed and putted into a 10 mL colorimetric tube, and then acetonitrile was also fixed to the scale above. After 15 min of ultrasonic extraction, the sample was placed in a refrigerator at 4 °C for 10 min to precipitate the protein, and centrifuged at 8000 rpm for 20 min. Next, 1 mL supernatant was blow-dried with nitrogen at 60 °C, and placed in a 10 mL colorimetric tube that is fixed to the scale with ultra-pure water. The diluted solution was filtered through the 0.22 μm organic filter membrane and degreaser column. After the processing above, the filtrate were obtained and used as the stock solution for the analysis of real sample.
5 mL beverage solution was centrifuged at 5000 rpm for 10 min, and the supernatant was filled with ultrapure water to 50 mL colorimetric tube. The diluent above was passed through SPE-C18 solid phase extraction column. The first 1 mL of the liquid was discarded and 5 mL of the filtrate from the back was collected. The filtrate was passed through nylon 0.22 μm microporous membrane, and the filtrate was used as the stock solution for the analysis.
Results and discussion
UV-vis absorption and fluorescence emission spectra
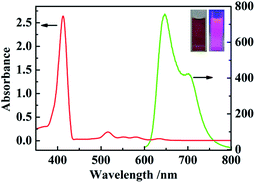
The optical properties of the synthesized TSPP were detected by UV-vis absorption and fluorescence emission spectra in Fig. 2. It can be seen from the UV-vis absorption spectra (red line in Fig. 2) that there are 5 absorption peaks in total, among which the peak with the larger absorbance value at 415 nm is the B absorption band, also which is known as Soret band and is the characteristic absorption peak of porphyrins. The other four absorption peaks with relatively small absorbance values are Q absorption bands with absorption wavelengths of 514 nm, 551 nm, 579 nm and 631 nm, respectively. As the fluorescence emission spectra (green line in Fig. 2) showed that the TSPP solution presented two obvious fluorescence emission peaks at 645 nm and 700 nm under the excitation wavelength of 460 nm. The inner illustration shows the photograph information of TSPP solution under sunlight lamp (left) and red fluorescence was irradiated with the UV lamp at 365 nm (right).FT-IR spectrum analysis
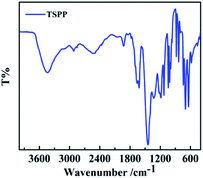
The Fourier transform infrared spectra (FT-IR) of synthetic TSPP is as shown in Fig. 3, 1445 cm−1 is the stretching vibration absorption peak of C![[double bond, length as m-dash]](https://www.rsc.org/images/entities/char_e001.gif) C on the benzene ring and porphyrin ring; the absorption peak at 2580–2940 cm−1 is the C–H stretching vibration absorption peak on the typical aromatic ring; 1609 cm−1 and 1667 cm−1 are the stretching vibration absorption peaks of N
C on the benzene ring and porphyrin ring; the absorption peak at 2580–2940 cm−1 is the C–H stretching vibration absorption peak on the typical aromatic ring; 1609 cm−1 and 1667 cm−1 are the stretching vibration absorption peaks of N![[double bond, length as m-dash]](https://www.rsc.org/images/entities/char_e001.gif) C on the benzene ring and porphyrin ring; and 1650 cm−1 is the stretching vibration of C–O. In addition, the characteristic absorption peaks of sulfonic acid groups are 1179 cm−1, 1129 cm−1 and 638 cm−1, respectively.
C on the benzene ring and porphyrin ring; and 1650 cm−1 is the stretching vibration of C–O. In addition, the characteristic absorption peaks of sulfonic acid groups are 1179 cm−1, 1129 cm−1 and 638 cm−1, respectively.
1 H NMR spectrum analysis
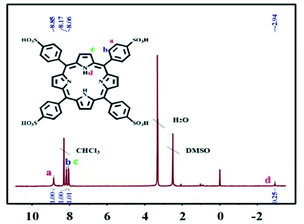
The TSPP powder of vacuum drying was accurately weighed, which is dissolved by DMSO solvent, and then the mixture is added into the nuclear magnetic tube. The experiment of 1H NMR was carried out by using tetramethylsilane (TMS) as internal standard. The chemical displacement values of the compound measured in the experiment are as shown in Fig. 4. The details of the 1H NMR obtained are as follows: 1H NMR (400 MHz, DMSO-d6) δ, ppm: 8.85(s, 8H), 8.17(d, 8H, J = 4.0 Hz), 8.06(d, 8H, J = 8.0 Hz), −2.94(s, 2H).Effect of VB2 concentration on fluorescence intensity of TSPP solution
The relationship between VB2 concentration and fluorescence intensity of TSPP is as shown in Fig. 5. The fluorescence intensity of TSPP solution gradually decreased with the addition of VB2 solution. When the concentration of VB2 increased to 2.5 × 10⁻⁵ M, the fluorescence intensity of TSPP solution decreased to the lowest level. The fluorescence intensity of TSPP solution did not decrease significantly when the concentration of VB2 continued to increase. Therefore, the fluorescent probe is constructed with 25 μM VB2 solution in this experiment.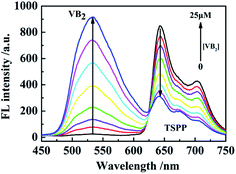 | ||
| Fig. 5 The fluorescence intensity of TSPP varies with the concentration of VB2 (from bottom to top, the concentrations of VB2 were 0 to 25 μM). | ||
Selection of experimental conditions
It is well known that both the reaction time and the pH value of buffer solution have a certain effect on the fluorescence intensity of fluorophore. Therefore, in this study, the effect of different pH values in Tris–HCl buffer solution and the reaction time between TSPP–VB2 and S2− on the fluorescence signal at 550 nm were investigated by using the fluorescence signal peak of VB2 as a reference. The relationship between the pH of 0.1 M Tris–HCl buffer solution and the fluorescence intensity of TSPP–VB2 system is as shown in Fig. 6A. With the increase of pH value, the fluorescence intensity of TSPP–VB2 system changes constantly. When the pH value is 8, the maximum fluorescence intensity of the system is about 650 a.u., so the optimal pH value of Tris–HCl buffer solution is 8. When a certain concentration of S2− solution was added into the mixed system, the change of fluorescence intensity of TSPP–VB2 system with the time changing is as shown in Fig. 6B. With the extension of reaction time, the fluorescence intensity of the system decreases continuously, but when it reaches 5 min, it almost no longer decreases as the extension of reaction time. Therefore, 5 min was selected as the optimal response time of the system in this experiment.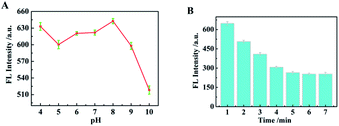 | ||
| Fig. 6 (A) Fluorescence intensity of TSPP–VB2 system at different pH values; (B). Relationship between fluorescence intensity and incubation time of TSPP–VB2–S2−. | ||
Fluorescence detection S2−
Fig. 7 shows the relationship between the fluorescence intensity of TSPP–VB2 solution and S2− concentration. As is illustrated in Fig. 7A, with the increase of S2− concentration, the fluorescence intensity of VB2 decreases gradually at 550 nm, and the fluorescence intensity of TSPP increases gradually at 645 nm. The recovery rate of fluorescence intensity of TSPP at 645 nm is relatively weak, while the degree of decrease of fluorescence intensity of VB2 at 550 nm is relatively obvious. Therefore, the fluorescence signal peak of VB2 at 550 nm is used as a reference peak to fit the linear relationship in this sensor research. As is shown in Fig. 7B, it can be seen that the fluorescence intensity of TSPP–VB2 solution has a linear relationship with the increase of S2− concentration. The linear fitting curve equation is: Y = −182.4![[thin space (1/6-em)]](https://www.rsc.org/images/entities/char_2009.gif) log[S2−] + 310.4 (R2 = 0.9975), the linear range of S2− detection is 5.0 × 10⁻⁹ to 3.6 × 10⁻⁵ M, and the detection limit (LOD) is calculated to be 1.10 × 10−9 M by 3δ/k (where δ was the blank standard deviation; k was the slope of the linear fitting curve equation). Compared with other detection systems (Table 1), the fluorescence sensing system constructed in this experiment has higher accuracy and sensitivity.
log[S2−] + 310.4 (R2 = 0.9975), the linear range of S2− detection is 5.0 × 10⁻⁹ to 3.6 × 10⁻⁵ M, and the detection limit (LOD) is calculated to be 1.10 × 10−9 M by 3δ/k (where δ was the blank standard deviation; k was the slope of the linear fitting curve equation). Compared with other detection systems (Table 1), the fluorescence sensing system constructed in this experiment has higher accuracy and sensitivity.
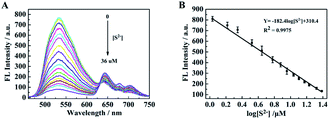 | ||
| Fig. 7 (A) Fluorescence emission spectra of TSPP–VB2 system with increasing concentration of S2−. (B) Relationship between fluorescence intensity of TSPP and the concentration of VB2. | ||
| Fluorescent probes | Detection limit (μM) | Linear range (μM) | Ref. |
|---|---|---|---|
| g-CNQDs–ZnMOF | 15 × 10−3 | 0.005–1.0 | 29 |
| L–Cu2+ | 0.14 | 0.5–10 | 30 |
| CdS QDs | 1.6 | 7–125 | 31 |
| Tyloxapol/MnO4− | 0.039 | 130–200 | 32 |
| g-C3N4–Ag+ | 3.5 × 10⁻³ | 0–0.03 | 33 |
| Papain-directed AuNCs | 80 | 0.2–20 | 34 |
| CDs/PEI/NB | 0.06 | 0.1–8 | 35 |
| Fe3O4@SiO2 | 0.12 | 0–12 | 36 |
| TSPP–VB2 | 1.10 × 10⁻³ | 0–36 | This work |
Selective test of S2− by TSPP–VB2 fluorescence
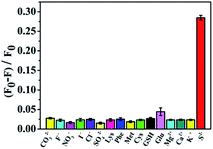
The selectivity of the sensor directly determines whether the system can be applied in practice. Therefore, the selectivity for the determination of S2− was characterized. When other interfering substances are added into TSPP–VB2 solution, the change of fluorescence intensity of TSPP–VB2 solution is as shown in Fig. 8, where F0 and F are the fluorescence intensities of VB2 in the absence and presence of S2−. The interferents selected in this experiment were CO32−, F−, NO3−, I−, Cl−, SO42−, lysine, phenylalanine, methionine, cysteine, GSH, Mg2+ and Ca2+(the concentration of the interfering substances is about 1000 times than the concentration of S2−). The fluorescence intensity of TSPP–VB2 changed when a certain concentration of interfering substances were added, but the fluorescence intensity did not decrease significantly. Consequently, the TSPP–VB2 fluorescent probe molecule constructed in this experiment has a good selectivity for the detection of S2−.Detection of S2− content in actual samples
In order to further prove that the TSPP–VB2 fluorescent probe constructed in this research can be successfully applied to the detection of S2− in actual samples, the content of S2− in the actual samples (rabbit serum, milk and beverage) was determined by the method of adding standard. The experimental results are as shown in Table 2. The recovery rate and relative standard deviation (RSD) of S2− in the actual samples were between the range of 94.75–104.57% and 2.73–6.70%, respectively. It can be clearly seen that this method can be well applied to the detection of S2− content in the actual samples.| Sample | Added (10−7 M) | Found (10−7 M) | Recovery (%) | RSD (%, n = 3) |
|---|---|---|---|---|
| Serum | 0.25 | 0.24 | 97.33 | 6.28 |
| 3.50 | 3.55 | 101.52 | 5.69 | |
| 65.00 | 65.25 | 100.38 | 6.70 | |
| Milk | 0.25 | 0.26 | 102.67 | 5.95 |
| 3.50 | 3.36 | 96.00 | 2.73 | |
| 65.00 | 63.42 | 97.56 | 5.39 | |
| Beverage | 0.25 | 0.24 | 97.47 | 6.23 |
| 3.50 | 3.66 | 104.57 | 6.40 | |
| 65.00 | 61.59 | 94.75 | 4.23 |
Discussion the detection mechanism
In this “on–off–on” fluorescence sensing research, TSPP acts as a fluorescent emitter. When VB2 is introduced into TSPP solution, it produces its own fluorescence at 550 nm, and the fluorescence intensity of TSPP was weakened at 645 nm owing to that VB2 is also a special fluorescent luminescent group. The interaction between TSPP solution and VB2 is as shown in Fig. 9. As can be seen from the experimental results in Fig. 9, sulfur ions have almost no effect on the fluorescence intensity of TSPP without VB2. Sulfur ions can weaken the fluorescence intensity of VB2 based on the specific interaction between VB2 and S2− in the absence of TSPP. Thereof, TSPP and VB2 may exists the interacting relationship conducted in this study based on the principle of the electrostatic attractions and hydrophobic interactions from TSPP to riboflavin.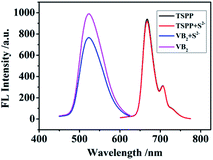 | ||
| Fig. 9 Fluorescence emission spectra of TSPP, VB2, the mixture of TSPP and S2−, the mixture of VB2 and S2−. | ||
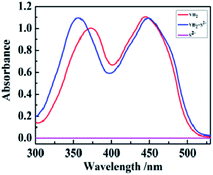
It was found that when S2− was further introduced into the TSPP–VB2 system, the fluorescence signal of VB2 decreased linearly. On the contrary, the fluorescence intensity of TSPP gradually recovered, which indicated that there was a specific reaction between S2− and VB2. According to previous reports, sulfur ions mainly exist in the form of HS− in buffer solutions with pH = 8.37 In this experiment, the decrease of fluorescence intensity of VB2 maybe the results of the reaction between the triplet state of riboflavin  and HS−.38 In order to further study the interaction mechanism between them above, the UV-vis absorption spectra of S2−, VB2 and mixtures of S2−–VB2 are seriously studied in this paper, as is shown in Fig. 10. It can be seen from the research results that when S2− and VB2 are mixed together, the blue shift of UV-vis absorption peak at 370 nm can be observed obviously. This could be due to that the main S2− and the molecular structure of the VB2 amide groups have a special interaction. This interaction can make S2− destroy the ring structure in VB2 molecular structure, which results in the decrease of unsaturation of molecular structure. Also, it causes that the UV-vis absorption peak at 370 nm moves towards the short wave direction. Based on this mechanism, the “on–off–on” fluorescent probe was constructed to study the sensing of S2− in the real samples.
Conclusion
First and foremost of all, the synthesis method of TSPP reported was successfully improved in this study, which makes the synthesis of TSPP greener, and the yield was increased by about 10%. Also, TSPP was further characterized by various spectra. What's more, the detection of S2− of the “on–off–on” fluorescent sensor based on TSPP–VB2 was successfully constructed. In addition, the optimal reaction conditions of the sensor system were optimized, and interference experiments were studied. Last but not least, the content of S2− in rabbit serum, milk and beverage was respectively detected by the method of adding standard. The research above shows that the “on–off–on” fluorescence detection system constructed in this experiment can selectively detect S2− in actual samples. Compared with the detection method of pure porphyrin compound probe, the method in this study can better improves the sensitivity of detection, and has the remarkable advantages of low price, simple operation and less time. So this research method has the bright and good prospect in the fields of the sensing research, and it is worth of popularizing in the practical application.Conflicts of interest
There are no conflicts to declare.Acknowledgements
This work was supported by Natural Science Foundation of Qinghai Province in China (Grant No. 2019-ZJ-944Q); Qinghai Provincial Thousand Talents Program of High-level Innovation Talent, China; University-level Planning Project of Qinghai Nationality University of Qinghai Province in China (Grant No. 2021XJGH16) and Innovation team of Medicinal material resource protection and high value utilization in Qinghai Province (2021XJPI02).Notes and references
- X. Pang, L. Wang, L. Gao, H. Feng, J. Kong and L. Li, Luminescence, 2019, 34, 585–594 CrossRef CAS PubMed
.
- F. Cheng, X. Wu, M. Liu, Y. Lon, G. Chen and R. Zeng, Sens. Actuators, B, 2016, 228, 673–678 CrossRef CAS
.
- N. Kumar, V. Bhalla and M. Kumar, Coord. Chem. Rev., 2013, 257, 2335–2347 CrossRef CAS
.
- S. Wang, L. Wang, Y. Zhu and Y. Song, Spectrochim. Acta, Part A, 2020, 236, 118327 CrossRef CAS PubMed
.
- Y. Jia, Y. Guo, S. Wang, W. Chen, J. Zhang, W. Zheng and X. Jiang, Nanoscale, 2017, 9, 9811–9817 RSC
.
- H. Wang, X. Wu, S. Yang, H. Tian, Y. Liu and B. Sun, Dyes Pigm., 2019, 160, 757–764 CrossRef CAS
.
- H. Wang, Q. Ma, Y. Wang, C. Wang, D. Qin, D. Shan, J. Chen and X. Lu, Anal. Chim. Acta, 2017, 973, 34–42 CrossRef CAS PubMed
.
- T. Tabanlıgil Calam, Microchem. J., 2021, 169, 106557 CrossRef
.
- Y. Zou, M. Ruan, J. Luan, X. Feng, S. Chen and Z. Chu, J. Nutr., Health Aging, 2017, 21, 314–319 CrossRef CAS PubMed
.
- A. I. Mazur, J. Natorska, E. Wypasek, E. Kołaczkowska and B. Płytycz, Cent. Eur. J. Immunol., 2008, 33, 98–101 CAS
.
- A. Masek, E. Chrzescijanska, M. Zaborski and M. Maciejewska, C. R. Chim., 2012, 15, 524–529 CrossRef CAS
.
- N. Suwannasom, I. Kao, A. Pru, R. Georgieva and H. Bumler, Int. J. Mol. Sci., 2020, 21, 950 CrossRef CAS PubMed
.
- Z. Wang, L. Zhang, Y. Hao, W. Dong and X. Gong, Anal. Chim. Acta, 2021, 1144, 1–13 CrossRef CAS PubMed
.
- S. Feng, F. Pei, Y. Wu, J. Lv and W. Lei, Spectrochim. Acta, Part A, 2021, 246, 119004 CrossRef CAS PubMed
.
- J. L. Sessler, M. J. Cyr, V. Lynch, E. McGhee and J. A. Ibers, J. Am. Chem. Soc., 1990, 112, 2810–2813 CrossRef CAS
.
- C. M. Lemon, E. Karnas, M. G. Bawendi and D. G. Nocera, Inorg. Chem., 2013, 52, 10394–10406 CrossRef CAS PubMed
.
- D. Fry and M. Zamadar, Res. Rev.: J. Chem., 2015, 4, 46–55 CAS
.
- Q. Zhao, R. Li, S. Xing, X. Liu, T. Hu and X. Bu, Inorg. Chem., 2011, 50, 10041–10046 CrossRef CAS PubMed
.
- D. Zhang, P. Du, J. Chen, H. Guo and X. Lu, Sens. Actuators, B, 2021, 341, 130000 CrossRef CAS
.
- L. Li, X. Ning, Y. Qian, G. Pu, Y. Wang, X. Zhang, H. Wang, J. Chen, D. Shan and X. Lu, Sens. Actuators, B, 2017, 257, 331–339 CrossRef
.
- B. Beyene, A. Ybeltal and M. Ayana, Results Chem., 2020, 2, 100058 CrossRef CAS
.
- J. Chen, Q. Ma, X. Hu, Y. Gao, X. Yan, D. Qin and X. Lu, Sens. Actuators, B, 2018, 254, 475–482 CrossRef CAS
.
- Y. Zeng, J. Liu and Y. Li, Electrochem. Commun., 2002, 4, 679–683 CrossRef CAS
.
- S. Simionescu, S. Teodorescu, R. M. Ion and G. Nechifor, Mater. Plast., 2016, 53, 194–197 Search PubMed
.
- R. M. Ion and S. Patachia, in International Conference on Advancements of Medicine and Health Care through Technology, Cluj-Napoca, Romania, 2014, vol. 44, pp. 307–310 Search PubMed
.
- J. Zhang, S. Devaramani, D. Shan and X. Lu, Anal. Bioanal. Chem., 2016, 408, 7155–7163 CrossRef CAS PubMed
.
- M. Xi, P. Wang, M. Zhang, L. Qin, S. Z. Kang and X. Li, Appl. Surf. Sci., 2020, 529, 147200 CrossRef CAS
.
- J. Chen, Y. Gao, Q. Ma, X. Hu, Y. Xu and X. Lu, Sens. Actuators, B, 2018, 268, 270–277 CrossRef CAS
.
- Y. Pan, X. Xu, Y. Zhang, Y. Zhang and W. Dong, Spectrochim. Acta, Part A, 2020, 229, 117927 CrossRef CAS PubMed
.
- L. Hou, X. Kong, Y. Wang, J. Chao, C. Li, C. Dong, Y. Wang and S. Shuang, J. Mater. Chem. B, 2017, 5, 8957–8966 RSC
.
- P. Sianglam, S. Kulchat, T. Tuntulani and W. Ngeontae, Spectrochim. Acta, Part A, 2017, 183, 408–416 CrossRef CAS PubMed
.
- P. Ding, X. Xin, L. Zhao, Z. Xie, Q. Zhang, J. Jiao and G. Xu, RSC Adv., 2017, 7, 3051–3058 RSC
.
- S. Wang, D. Du, M. Yang, Q. Lu, R. Ye, X. Yan and Y. Lin, Talanta, 2017, 168, 168–173 CrossRef CAS PubMed
.
- L. C. Wang, G. Q. Chen, G. M. Zeng, J. Liang, H. R. Dong, M. Yan, Z. W. Li, Z. Guo, W. Tao and L. Peng, New J. Chem., 2015, 39, 9306–9312 RSC
.
- H. Jin, R. J. Gui, Y. F. Wang and J. Sun, Talanta, 2017, 169, 141–148 CrossRef CAS PubMed
.
- H. Jiang, Y. Liu, W. Luo, Y. Wang, X. Tang, W. Dou, Y. Cui and W. Liu, Anal. Chim. Acta, 2018, 1014, 91–99 CrossRef CAS PubMed
.
- J. R. Koenitzer, T. S. Isbell, H. D. Patel, G. A. Benavides and D. W. Kraus, Am. J. Physiol.: Heart Circ. Physiol., 2007, 292, 1953–1960 CrossRef PubMed
.
- M. Wang, K. Li, R. R. Zhu, L. L. Cheng, Q. S. Wu and S. L. Wang, J. Photochem. Photobiol., B, 2011, 103, 186–191 CrossRef CAS PubMed
.
| This journal is © The Royal Society of Chemistry 2022 |

