 Open Access Article
Direct analysis of the actin-filament formation effect in photodynamic therapy†
Atsushi Taninakaab,
Shunta Ugajina,
Hiromi Kurokawac,
Yu Nagoshia,
Mayuka Kamiyanagia,
Osamu Takeuchia,
Hirofumi Matsuic and
Hidemi Shigekawa *a
*a
aFaculty of Pure and Applied Sciences, University of Tsukuba, 305-8573 Ibaraki, Japan. E-mail: hidemi@ims.tsukuba.ac.jp
bTAKANO Co., LTD., Miyada-mura, Kamiina-gun, Nagano, 399-4301 Japan
cFaculty of Medicine, University of Tsukuba, 305-8575 Ibaraki, Japan
First published on 16th February 2022
Abstract
Photodynamic therapy (PDT) is a method in which a photosensitizer is administered in vivo and irradiated with light to generate reactive oxygen species (ROS), thereby causing the selective death of cancer cells. Since PDT is a noninvasive cancer treatment method with few adverse effects, it has attracted considerable attention and is increasingly used. In PDT, there are two dominant processes based on the actin filament (A-filament) formation effect: the destruction of cells by necrosis and vascular shutdown. Despite the importance of its fine control, the mechanism of the reaction process from the generation of reactive oxygen by photoinduction inducing the formation of A-filament and its polymerization to form stress fibers (S-fibers) has not yet been clarified because, for example, it has been difficult to directly observe and quantify such processes in living cells by conventional methods. Here, we have combined atomic force microscopy (AFM) with other techniques to reveal the mechanism of the A-filament and S-fiber formation processes that underlie the cell death process due to PDT. First, it was confirmed that activation of the small G protein RhoA, which is a signal that induces an increase in A-filament production, begins immediately after PDT treatment. The production of A-filament did not increase with increasing light intensity when the amount of light was large. Namely, the activation of RhoA reached an equilibrium state in about 1 min: however, the production of A-filament and its polymerization continued. The observed process corresponds well with the change in the amount of phosphorylated myosin-light chains, which induce A-filament polymerization. The increase in the elastic modulus of cells following the formation of S-fiber was confirmed by AFM for the first time. The distribution of generated A-filament and S-fiber was consistent with the photosensitizer distribution. PDT increases A-filament production, and when the ROS concentration is high, blebbing occurs and cells die, but when it is low, cell death does not occur and S-fiber is formed. That is, it is expected that vascular shutdown can be controlled efficiently by adjusting the amount of photosensitizer and the light intensity.
Cancer is a disease that now affects one in two people during their lives and is still on the rise. Therefore, there is an urgent need to establish a treatment method while also improving the survival rate and the quality of life after treatment. Photodynamic therapy (PDT) is a method in which a photosensitizer is administered in vivo and irradiated with light to generate reactive oxygen species (ROS), thereby causing the selective death of cancer cells.1–6 Since PDT is a noninvasive cancer treatment method with few adverse effects, it has been attracting attention and is being increasingly used to increase the quality of life of patients post-treatment. Previous studies have shown that PDT has two main effects. (1) Cancer cells and new blood vessels produced by angiogenesis are destroyed by necrosis and necroptosis induced by ROS.1,7–9 (2) The process of altering vascular cells that supply nutrients to cancer cells and the cells around them causes the vascular shutdown and necrosis of cancer cells.10–15 To use PDT effectively, it is necessary to correctly understand the mechanisms of these effects, but unclear points in the mechanisms remain.
Various photosensitizers have been developed, most of which are molecules with a porphyrin ring.1,3,16,17 In PDT, this porphyrin ring is photoexcited to generate singlet oxygen, which is converted to other ROS such as OH radicals and H2O2.1,3,16,17 In process (1) above, the main mechanism is the destruction of the cytoplasm and cell membrane by ROS.3,11 On the other hand, in process (2), cell destruction is considered to be caused by cell–cell interaction and cell contraction due to an increase in the numbers of intracellular actin filaments (A-filaments) around the tumor (cancer tissue).10–15 Despite the importance of its fine control, the mechanism of the reaction process from the generation of active oxygen by photoinduction inducing the formation of A-filament and their polymerization to form stress fibers (S-fibers) (Fig. S1† for more details) has not yet been clarified because, for example, it has been difficult to directly observe and quantify the A-filament and S-fiber formation processes in living cells by conventional methods.18,19
Recently, important mechanisms such as those of blebbing20 and the RhoA–Rho-associated protein kinase (ROCK) pathway21,22 have been investigated and have attracted attention. It was claimed that the A-filament formation occurred within 5 minutes after PDT on the basis of the measurement of phosphorylation of myosin and that the blood flow decreased in the experiments using mice. However, the details of the reaction process, such as its relationship with the activation of RhoA by active oxygen and whether the cells are actually hardened owing to the formation of A-filament, have not been confirmed. Therefore, to clarify the mechanism for the further use of PDT, an urgent task is to introduce and develop a new method for analysis.
Here, we have combined atomic force microscopy (AFM) with other techniques and analyzed the mechanism of the A-filament and S-fiber formation processes that underlies the cell death process due to PDT.
Experimental
In recent years, as a nondestructive method for analyzing the state of cytoskeletons such as A-filament and microtubules without staining, AFM has been used to measure the shape and mechanical properties of cells.23–31 Dynamic mode AFM can be used to measure the viscoelasticity of cells and observe A-filament with a high elastic modulus.23,25–33 Another analysis method is to determine the local elastic modulus by measuring force curves.23,28,34–38 Although the method takes a longer time, it is superior to viscoelasticity measurement by dynamic mode AFM for the quantification of the elastic modulus because it directly observes the mechanical properties of cells.In addition, a fluorescent probe (SPY555-actin, Cytoskeleton, Inc.) that enables the direct imaging of A-filament in living cells has recently been developed.39,40 It has low background noise and can be used in multiple colors. Since the excitation wavelength of SPY555-actin (555 nm) has a small absorption coefficient for taraporphyrin sodium,2,3,10,17 which is a second-generation photosensitizer, the effect of fluorescence observation on the analysis of A-filament dynamics induced by PDT is reduced. It has been reported that SPY555-actin stabilizes A-filament; thus the A-filament concentration naturally increases when this probe is used,41 making quantitative analysis difficult. However, depending on the cells and measurement conditions, the effect of external stimuli such as PDT becomes greater than that of stabilization. Under this condition, it becomes possible to use this probe with the method of using AFM, as carried out in this experiment.
When a photosensitizer taken into cells is irradiated with light, singlet oxygen is generated and changes to ROS, which activates RhoA. This change in the transformation process of the protein RhoA, a signal molecule of the mechanism, can be analyzed by western blotting.
In this study, we have combined these techniques to directly analyze the A-filament and S-fiber formation processes. Namely, to reveal the details of the mechanism of cell death due to external stress, a dominant effect of PDT, we investigated the relationship between the activation of RhoA by reactive oxygen, which triggers myosin phosphorylation, the increase in A-filament concentration, and the increase in elastic modulus (Fig. S1† for more details).
Sample preparation and measurement
The cells used were rat gastric mucosa-derived cancer-like mutant RGK1 cells.41 Fluorescence observation, time-lapse observation, and light irradiation were performed with an IX83 system (Olympus Corp.) equipped with a stage top incubator (Tokai Hit Co., Ltd.). For AFM observation, an Asylum Research MFP-3D-BIO atomic force microscope (Oxford Instruments) was installed on an IX71 system (Olympus Corp.) to measure the elastic modulus of the same cells before and after light irradiation. After AFM observation with the IX71 system, light irradiation was performed with the IX83 system, then the sample was moved to the IX71 system again, the same cells were found by phase contrast microscopy observation, and AFM observation was performed (Methods for more details).Results and discussion
A-Filament formation probed by fluorescence measurement
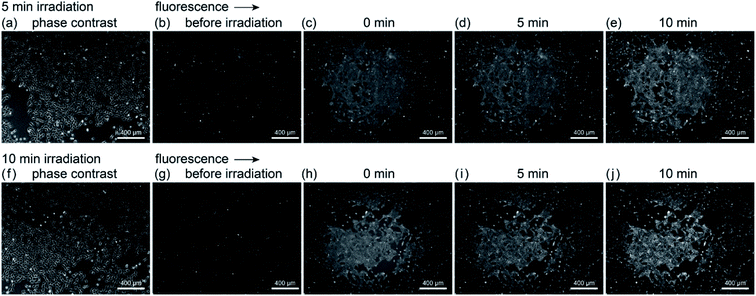
First, we look at the results of direct observation using fluorescence. Fig. 1(a)–(e) show the change observed after 5 minute light irradiation: (a) a phase contrast image of RGK1 stained with SPY555-actin (Cytoskeleton, Inc.) and its fluorescence images (b) before, (c) immediately after, (d) 5 minutes after, and (e) 10 minutes after the end of light irradiation. A light with a diameter of 1.4 mm was irradiated at the center of the images in Fig. 1 for 5 minutes by applying a bandpass filter of 635–675 nm (center wavelength 655 nm, intensity 34 mW cm−2) to a white light source attached to a fluorescence microscope. If PDT enhances the production of A-filament, the fluorescence intensity should increase only in the light-irradiated area. In fact, Fig. 1(c)–(e) show a higher fluorescence intensity in the light-irradiated area than Fig. 1(b). See Fig. S2† for the results of the quantitative evaluation of the fluorescence intensity. Although ROS is generated only during light irradiation, the fluorescence intensity increased after the end of the irradiation, as shown in Fig. 1(d) and (e). That is, after the mechanism to activate the production of A-filament by the generation of ROS during the light irradiation (process (a) in Fig. S1†), the process of A-filament formation (process (c) in Fig. S1†) continued for the next 10 minutes. In the paper we referred to [ref. 13], it has been confirmed that myosin phosphorylation begins about 5 minutes after the light irradiation is stopped, which is in good agreement with our results.To further investigate the A-filament formation process, a 10 minute irradiation experiment was conducted to compare the results with that obtained by 5 minute irradiation. Fig. 1(f)–(j) respectively show the images obtained by observations similar to those in Fig. 1(a)–(e). First, the fluorescence intensity increased immediately after the light irradiation, as in the case of irradiation for 5 minutes, and the fluorescence intensity continued to increase for 5 and 10 minutes after the end of light irradiation. Namely, the production of A-filament continued after the generation of ROS. Moreover, the fluorescence intensity obtained immediately after 10 minutes of irradiation (Fig. 1(g) and (h), +30%) was higher than those obtained immediately after (Fig. 1(b) and (c), +20%) and 5 minutes after irradiation for 5 minutes (Fig. 1(b)–(d), +22%) (see Fig. S2(a) and (b)†). The amount of A-filament generated was higher in the case of 10 minute irradiation than in the case of 5 minute irradiation. Therefore, the amount of A-filament production is considered to depend on the amount of ROS generated during light irradiation.
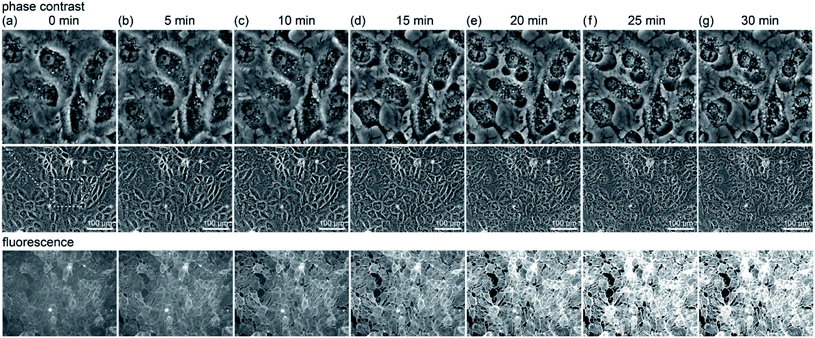
To further understand the mechanism, the change due to 5 min irradiation was investigated in more detail. We compared the changes in cell structure observed by optical microscopy with that in fluorescence intensity, as shown in Fig. 2. The middle row shows phase contrast images, the upper row shows their enlarged views, and the lower row shows their fluorescence images. Five minutes after light irradiation, no significant change was observed in the cell structure. Subsequently, the fluorescence intensity gradually increased. Around 20 to 25 minutes after irradiation, as shown in Fig. 2(e) and (f), respectively, the fluorescence intensity sharply increased at the location where the cells showed blebbing and swelling (see Fig. S2(c)†). Blebbing is thought to occur where the cell membrane is damaged by ROS during light irradiation. Therefore, the influx of the SPY555-actin fluorescent probe in the medium into the cells might have occurred there.
To see the effect of A-filament stabilization by the SPY555-actin fluorescent probe,41 we examined the fluorescence intensity when only the probe was inserted (Fig. S3†). When PDT was not performed, almost no change was observed even after 2 h (Fig. S2(d)†), and it was confirmed that the probe had little effect on stabilizing A-filament in this experiment. That is, the results obtained in this experiment show the generation of A-filament by PDT.
Activation of RhoA probed by western blotting
Next, we take a closer look at these processes. First, to confirm the mechanism that increases the production of A-filament, the change in the transforming protein RhoA, a signal molecule of the mechanism, was measured by western blotting. Fig. 3 shows the change in the amount of RhoA (normalized by the amount of β-tubulin) obtained by 1 min irradiation, 1 min irradiation and 4 min incubation, 5 min irradiation, and 15 min irradiation at the light intensity determined for the system (0.0531 mW cm−2) (original data are also shown in Fig. S4†). The control is the result obtained without any treatment. When RhoA is activated by ROS to be RhoA*, RhoA* binds to ROCK and also activates mammalian diaphanous-related formin (mDia), resulting in the promotion A-filament formation13,20–22,42,43 (see Fig. S1†). Namely, a decrease in RhoA concentration indicates A-filament formation. The RhoA concentration decreased significantly after 1 min irradiation and then appeared to decrease only slightly. That is, although the mechanism of A-filament formation continues after 1 min, as observed in the fluorescence measurement, the RhoA* production process is considered to be in an equilibrium state within the first 1 min.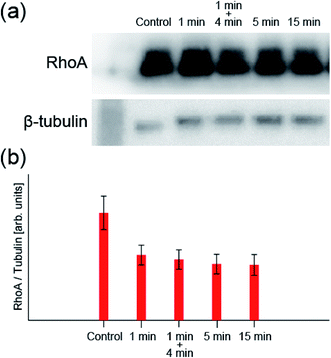 | ||
| Fig. 3 (a) Typical image of western blotting (see Fig. S4† for all data). (b) RhoA concentration measured by western blotting when the sample was irradiated with light with a wavelength of 660 nm and an intensity of 0.0531 mW cm−2 (n = 5: n is the number of experiments). The values are normalized by the amount of β-tubulin antibody. | ||
Relationship between amount of generated reactive oxygen and A-filament production
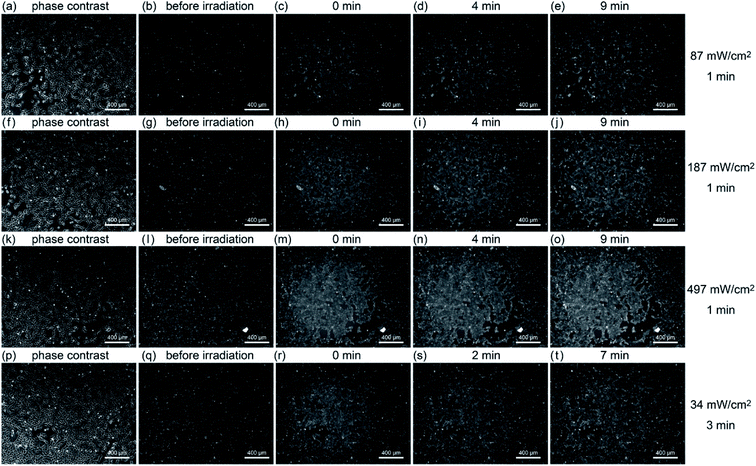
Next, the relationship between the amount of ROS generated and A-filament production was investigated. Fig. 4 shows the results of fluorescence observation after irradiating a sample with light of different intensities (87, 187, and 497 mW cm−2) for 1 min while keeping the temperature at 37 °C. At 497 mW cm−2, probably because the scattered irradiation light was strong, the fluorescence intensity outside the light spot of 1.4 mm diameter increased to the same level as that where the light was exposed. Irradiation increased fluorescence, but the fluorescence intensity did not depend on the intensity of light (87 mW cm−2, 15%, 187 mW cm−2, 13%, 497 mW cm−2, 15%). At 187 and 497 mW cm−2, there was little change in fluorescence intensity immediately after, 5 minutes after, and 10 minutes after irradiation (∼1.2%) (see Fig. S2(e)–(g)†).The bottom row of Fig. 4 shows the results when light with an intensity of 34 mW cm−2 was irradiated for 3 minutes. The fluorescence intensity for 3 minutes of irradiation is about the same as that when irradiating the sample with light of 87 mW cm−2 for 1 min; namely, the actual amount of light is about the same. In the case of 34 mW cm−2 intensity, although the light was irradiated for 3 minutes and then the sample was allowed to stand at 37 °C for 7 minutes (Fig. 4(t)), the fluorescence intensity was only slightly different from that immediately after the irradiation (see Fig. S2(h)†).
To see the details of the change in the fluorescence described above, we magnified phase contrast images obtained with light intensities of 497, 87, and 34 mW cm−2, as shown in Fig. 5. When the sample was irradiated at 497 mW cm−2 for 1 min (Fig. 5(a)), the cells showed necrosis and swelled and ruptured in about 15 minutes. On the other hand, when the sample was irradiated at 87 mW cm−2 for 1 min (Fig. 5(b)), blebbing started about 15 minutes after the light irradiation, which continued for more than 6 h, and the cells swelled and burst (see Movie S1†). This phenomenon closely resembles the “death dance” observed for human embryonic stem cells (hESCs) owing to the excessive activation of myosin.20 In the case of the irradiation at 34 mW cm−2, no significant changes were observed, which was also confirmed by the analysis of fluorescence, as shown in Fig. S5 (see Fig. S2(i)†). The effect of light irradiation is considered to be determined by the light intensity and irradiation time. Under the irradiation condition of 34 mW for 1 minute, A-filament gradually increased (Fig. S2(i)†), but the cells were not destroyed in the range measured up to about 24 h. Therefore, when PDT is performed with this amount of light, immediate death due to necrosis does not occur, and it seems that this amount of light is suitable for producing a shutdown effect.
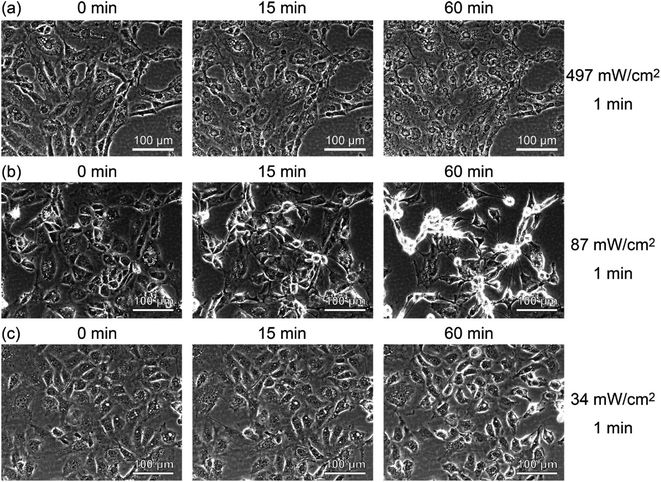 | ||
| Fig. 5 Time-lapse phase contrast images of RGK1 irradiated with light with a center wavelength of 655 nm and intensities of (a) 497 mW cm−2, (b) 87 mW cm−2, and (c) 34 mW cm−2 for 1 minute. | ||
On the basis of these results, it is considered that when light is weakened and irradiated in PDT, the mechanism of myosin activation by RhoA/ROCK and A-filament formation does not destroy cells.11,13,14,22,43 Although the increase in A-filament production depends on the amount of ROS generated, it is considered that the ROS involved in the increase in A-filament production has a threshold amount that can be tolerated by cells. That is, even if a large amount of ROS is generated in a short time, ROS exceeding the threshold amount is considered to destroy cells regardless of the increase in A-filament production. It is necessary to reduce the amount of light sufficiently to induce the vascular shutdown effect of PDT without causing cell destruction. In fact, in previous studies investigating the activation of myosin, experiments were conducted at low light intensities.13,14,44
Wavelength dependence of PDT effect
The wavelength and intensity of the excitation light are adjusted by combining the light source and filters. Our system can select 655 nm or 545 nm, which are used in ordinary fluorescence microscopes. However, for example, at 655 nm, it is limited to the excitation intensities shown in Fig. 4. Therefore, we tried to widen the measurement range by using 545 nm. Fig. S6† shows the ultraviolet-visible absorption spectrum of the aqueous taraporphyrin sodium solution. As previously described, since the excitation wavelength of SPY555-actin (555 nm) has a small absorption coefficient for taraporphyrin sodium, the effect of fluorescence observation on the analysis of A-filament dynamics induced by PDT is reduced. Therefore, instead of using light at 655 nm, which has a large absorption coefficient for taraporphyrin sodium, irradiation at 535–555 nm (center wavelength 545 nm, intensity 235 mW cm−2) was carried out for finer control. In addition, the fluorescence observation of A-filament was performed in the same manner as in Fig. 1 and 2, and similar results were obtained, as shown in Fig. S7 and S8,† respectively. Considering the difference in absorption coefficient shown in Fig. S6,† the light intensity in the case of 235 mW cm−2 irradiation at 545 nm is 235 mW cm−2 × 0.132 ≈ 31 mW cm−2, namely, abut 10% lower than 34 mW cm−2, the intensity used in the case of a 655 nm wavelength, and the expected results were obtained (see Fig. S2(a)–(c) and (j)–(l)†). There is a tendency that the amount of generated A-filament increased with increasing the amount of light irradiation.AFM measurement
Next, the local elastic modulus of the cells was measured by AFM. As shown in Fig. S1,† S-fibers are formed by the A-filament bound to desmosomes and affect the elastic modulus of cells. Therefore, information on the A-filament formation process can be analyzed by measuring the elastic modulus of cells. That is, the state of A-filament in a cell can be known from the change in elastic modulus, and thereby, information on the state of the cell including damage can be obtained.23,28,34–38 Biochemical experiments are usually conducted at 37 °C to maintain cell activities. However, since the aim of this experiment was to accurately measure the elastic modulus, experiments were performed at room temperature (∼25 °C) to reduce the change in the measurement conditions caused by cell activities.Fig. 6 shows AFM images of the sample and the force curves measured at each point (A–F) in the images. Hysteresis was observed on the cells, showing that they are alive. These measurements were performed over a region of 100 μm × 100 μm on a grid of 64 points × 64 points to obtain an elastic modulus map (see Methods for details).
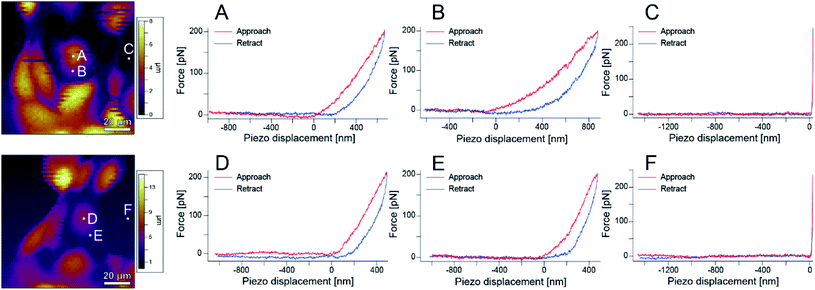 | ||
| Fig. 6 AFM images and force curves obtained at different points in the images. (A) and (D) Are near the cell nucleus, (B) and (E) are on the cell body, and (C) and (F) are at the bottom of the dish. | ||
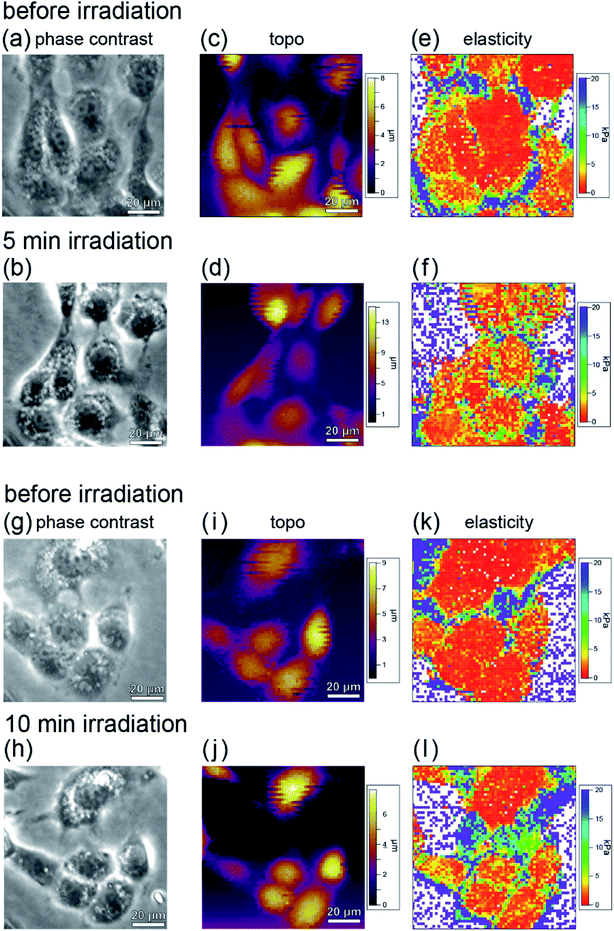
Fig. 7(a)–(d) show phase contrast and topographic (topo) images of typical cells in the sample before and after irradiation with light of 535–555 nm wavelength (center wavelength 545 nm, intensity 550 mW cm−2) for 5 minutes. From Fig. 7(a) and (b), it can be seen that no blebbing occurred in the cells and that the cells were not necrotic despite the light irradiation. In fact, as can be seen from Fig. 6, force curves with hysteresis were obtained near the nucleus and the cell membrane with the approach and retraction of the cantilever, whereas a force curve without hysteresis was obtained on the dish. Namely, the cells were shown to have viscoelastic properties (stress relaxation) before and after PDT, confirming that they were not necrotized.
The elastic modulus was estimated by fitting the force curves, measured at each point of the cell during the approach of the AFM tip, with the Hertz contact mechanical model,45 and the elastic modulus maps obtained before and after PDT are shown in Fig. 7(e) and (f), respectively. Fig. 7(g)–(l) show the results obtained after 10 minutes irradiation. From the phase contrast (Fig. 7(g) and (h)) and topo (Fig. 7(i) and (j)) images, it can be seen that the cells are not necrotic, as in the case of 5 minutes irradiation (Fig. 7(a)–(d)). Fig. 7(l) shows a higher elastic modulus than Fig. 7(k). In addition, the amount of increase in elastic modulus in Fig. 7(l) is larger than that in Fig. 7(f). From this, it is considered that the A-filament production increases with the irradiation, and the production of F-actin depends on the amount of ROS generated.
From the comparison before and after PDT, it was found that although the elastic modulus of the cells increased locally, it did not increase uniformly in all cells. This indicates that the cells are not in the same state and A-filament is in various development states. The variation may be owing to the differences in the division cycle and the degree of differentiation of individual cells. To estimate the relative increase in elastic modulus as a result of PDT in consideration of the development of A-filament in each cell, the elastic modulus of each cell was measured before and after PDT, and the average elastic modulus was estimated.
Fig. 8(a) shows the average elastic modulus near the cell nucleus and in the entire cell excluding the nucleus (cell body) before and after PDT. Before and after 5 minutes irradiation, the average elastic modulus near the cell nucleus was estimated to be 2.63 and 2.91 kPa, respectively. The average elastic modulus of the cell body was estimated to be 13.9 and 15.7 kPa, respectively. The mean elastic modulus increased slightly, by approximately 11% (1.11 times) near the cell nucleus and by approximately 13% (1.13 times) for the cell body. On the other hand, before and after 10 minute irradiation, the average elastic modulus near the cell nucleus was estimated to be 2.58 and 3.38 kPa, and the average elastic modulus of the cell body was estimated to be 11.3 and 21.4 kPa, respectively.
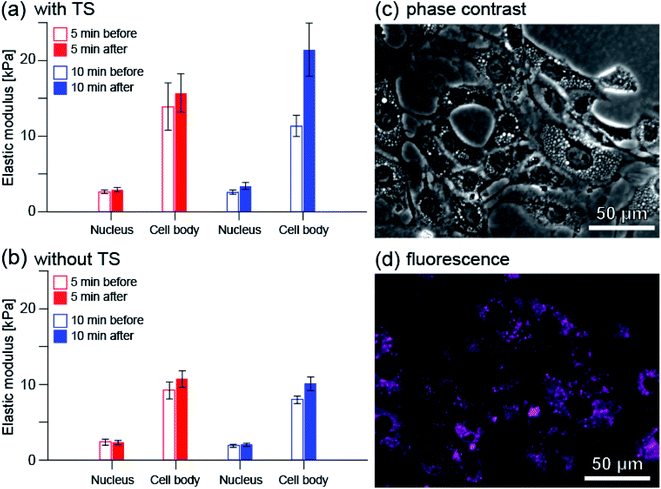 | ||
| Fig. 8 Changes in the average elastic modulus of RGK1 measured by AFM when the irradiation time was 5 minutes (red) and 10 minutes (blue): (a) with taraporphyrin sodium (TS) and (b) without. The number of cells measured, n, was 28, 33, 31, and 31 for (a) 5 min irradiation, (a) 10 min irradiation, (b) 5 min irradiation, and (b) 10 min irradiation, respectively. First, as explained in Methods, the elastic modulus value was quantified for each cell by averaging the measured values at each point in the nucleus and peripheral parts imaged in Fig. 7. First, as explained in Methods, the elastic modulus value was quantified for each cell by averaging the measured values at each point in the nucleus and peripheral parts imaged in Fig. 7. The value of each bar graph is the average of the same processing for n cells measured under each condition. (c) Phase contrast image of RGK1. (d) Fluorescence image of taraporphyrin sodium in RGK1 (shown by color of magenta). Excitation wavelength: 635–675 nm, fluorescent wavelength: 696–736 nm for (c) and (d). | ||
The relative increase in average elastic modulus is larger for 10 minutes irradiation than for 5 minutes irradiation; the relative increase in average elastic modulus near the cell nucleus is approximately 31% (1.31 times) and that of the cell body is approximately 89% (1.89 times). These are in good agreement with the results observed by fluorescence measurement (Fig. S2(j) and (k), (a) and (b)†).
Fig. 8(b) shows the average elastic modulus when the cells to which taraporphyrin sodium was not added were irradiated. There is little difference between the cases of 5 and 10 min irradiation. The relative increase in the average elastic modulus of the cell body was estimated to be 16% (1.16 times) and 26% (1.26 times) for the cases of 5 and 10 min irradiation, respectively, both results showing a slight increase. One of the causes is considered to be the effect of stress due to AFM measurement.
The elastic modulus of cells is mainly determined by the tension of S-fibers formed by A-filaments bound to desmosome (see Fig. S1†). Therefore, the details of the change from F-actin to F-stress can be evaluated using fluorescence and AFM. In a previous study,13 it was observed that myosin phosphorylation progressed within 5 minutes after light irradiation, and then the total amount decayed over 1 hour. The result that the elastic modulus hardly changed in 5 minutes and changed greatly in 10 minutes corresponds well to the process in which A-filament binds to desmosome and becomes S-fiber by myosin phosphorylation. The larger relative increase in the average elastic modulus of the cell body is considered to be due to more A-filament formation in the area. As shown in Fig. 8(c) and (d), taraporphyrin sodium is widely distributed in the cells except near the nucleus.
The change in elastic modulus is more clearly observed than that in fluorescence measurement, indicating that the sensitivity of AFM measurement is sufficiently high for a quantitative analysis. Because AFM has nanoscale spatial resolution, further applications in this field such as evaluation of the characteristics of each cell are expected.
Model for explaining PDT based on F-actin formation
From the above results, the effects of PDT using taraporphyrin sodium on cells are considered as follows. As shown in Fig. 9, ROS is generated from taraporphyrin sodium taken up by cells and activates RhoA.1,13,14,22 The activated RhoA binds to ROCK,21,46 and the mechanism of myosin phosphorylation and A-filament production immediately begins to operate.13,14,21,22 The formation of F-actin even after the light irradiation corresponds well to the change in the amount of phosphorylated myosin. In addition, as revealed by the PL image and the AFM elastic modulus map, the distribution of the photosensitizer that produces the ROS triggering the A-filament formation process is important.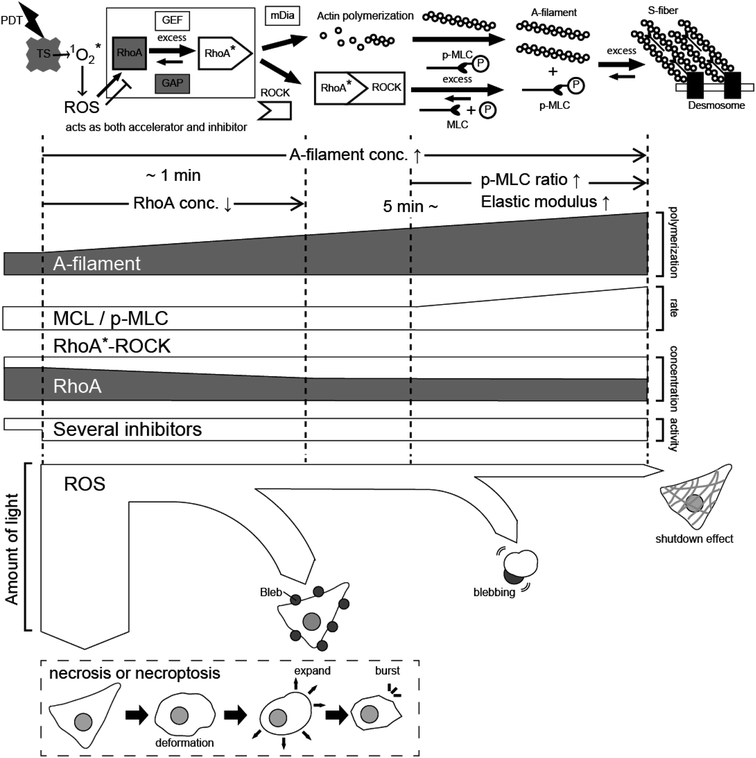 | ||
| Fig. 9 Schematic model explaining the PDT effect based on A-filament production. TS: taraporphyrin sodium, ROS: reactive oxygen species, MLC: myosin light chain, ROCK: Rho-associated protein kinase. | ||
On the other hand, ROS also has a mechanism of inhibiting RhoA activation21 (nitric oxide activates cGK. See Fig. S1† for comparison). As a result, the activation of RhoA equilibrates at a certain concentration depending on the amount of irradiation light. Namely, there is an upper limit to the extent to which cells can relieve oxidative stress, that is, the amount of active oxygen that activates RhoA is considered to depend on the equilibrium state determined by the light intensity. Active oxygen that exceeds the threshold directly destroys cells in a short time. Even if the cells do not die instantly, if the amount of active oxygen is large, blebbing starts, and cells swell after about 60 minutes and then rupture. Therefore, to necrotize cancer cells by impaired blood flow, it is necessary to reduce the amount of light to suppress blebbing and generate the A-filament required for impaired blood flow. Recently, PDT has also been applied to retina treatment,47–49 and future developments are expected by adjusting the process revealed in this study.
Conclusion
The F-actin formation process, which is the dominant effect of PDT, was analyzed in detail using a fluorescent probe that can be used to observe A-filament in living cells, by western blotting analysis of RhoA activation, and by local elastic modulus measurement by AFM. First, it was confirmed that activation of the small G protein RhoA, which is a signal that induces an increase in A-filament production, begins immediately after PDT treatment. The production of the A-filament did not increase with the light intensity when the amount of light was large. Namely, the activation of RhoA reached an equilibrium state in about 1 min; however, the production of A-filament and its polymerization continued. The observed process corresponds well to the change in the amount of the phosphorylated myosin-light chains, which induce A-filament polymerization. The increase in the elastic modulus of cells following the formation of S-fiber was confirmed using AFM for the first time. The distribution of generated A-filament and S-fiber was consistent with the photosensitizer distribution. PDT increases A-filament production, and when the ROS concentration is high, blebbing occurs and cells die, but when it is low, cell death does not occur and S-fiber is formed. That is, it is expected that vascular shutdown can be controlled efficiently by adjusting the amount of photosensitizer and the light intensity. We have succeeded in demonstrating that we can extract previously hidden information by combining physical methods with biochemical methods.Methods
Sample preparation
RGK1 cultured in a flask was placed in a dish with a diameter of 60 mm and allowed to stand in an incubator for one day. The dish was administered with 50 μL of 0.69 g L−1 taraporphyrin sodium PBS solution and allowed to stand in the incubator again for 22 to 24 h. The medium in the dish was replaced, then used as a sample.Fluorescence observation
A fluorescent probe (SPY555-actin, Cytoskeleton, Inc.) was used for the direct imaging of A-filament in living cells. It has low background noise and multiple colors are available. In the case of GFP, genetic manipulation is required to use it for living cells, and when it is used for antibody staining or living cells, it is injected by making a hole. SPY555-actin can probe the state of A-filament production while cells are still alive.39,40 SPY555-actin was dissolved in 50 μL of anhydrous dimethyl sulfoxide (DMSO), and 2 μL of the solution was added to the sample. Then the sample was allowed to stand in an incubator with a temperature of 37 °C for 60 minutes. After that, the dish was transferred to a stage top incubator (manufactured by Tokai Hit Co., Ltd.), and fluorescence observation was performed using a fluorescence microscope in an environment of 37 °C, saturated water vapor, and 5% CO2 (535–555 nm bandpass filter). After observing the fluorescence, the bandpass filter was replaced with a 635–675 nm bandpass filter, and the sample was irradiated with light to examine the effect of PDT. A mercury white light source (U-HG LGPS manufactured by Olympus) was used. Then fluorescence observation was performed again. In the case of AFM measurement of the elastic modulus (Fig. 6–8), a 535–555 nm bandpass filter was used to finely adjust of light intensity for PDT, as explained in the text. The exposure times were 2 and 11.7 s, respectively, for 20× and 4× (5× area) magnifications.Western blotting analysis
A light pigtail with a wavelength of 660 nm was output from a semiconductor laser (Thorlabs: LP660-SF50) and was expanded with an optical fiber to a diameter of 60 mm, and light with an intensity of 0.0531 mW cm−2, determined using the system, was irradiated from the bottom of the sample at 37 °C. After light irradiation, proteins were extracted from the sample using RIPA buffer, and western blotting was performed. The primary antibody RhoA (67B9) rabbit mAb (Cell Signaling Technology) was used for the detection of RhoA, and β-tubulin antibody (Protein Tech) was used for quantitative standardization (normalization).Modulus measurement
An Asylum Research MFP-3D-BIO atomic force microscope manufactured by Oxford Instruments was used with an Olympus Biolever BL-AC40TS-C2 cantilever (silicon nitride, spring constant 0.1 N m−1, half-apex angle 17.5°). The force curve was measured in a region of 100 μm × 100 μm with a grid of 64 points × 64 points, and the local elastic modulus was obtained from the force curve at each point using Hertz's equation and used as an elastic modulus map. When using Hertz's equation, the elastic modulus of the cantilever was 290 GPa and Poisson's ratio of the sample was 0.5. About five cells existed in the region of 100 μm × 100 μm, and the average elastic modulus was calculated for each cell by dividing the cell into two regions, namely, the vicinity of the nucleus and the remaining part of the cell (cell body). The values near the nucleus were averaged within a circular region having half the cell height as the diameter. The values of the other parts were averaged over the entire area except for the nucleus and the dish part in each elastic modulus map. Here, the region with an elastic modulus of 1 MPa or more was defined as the dish portion.Author contributions
A. T. developed the system and took data with S. U., H. K., Y. N., and M. K. H. M. and O. T. provided technical advice. H. S. organized and supervised the project and edited the paper with A. T.Conflicts of interest
There are no conflicts to declare.Acknowledgements
We acknowledge the financial supports of a Grant-in-Aid for Scientific Research (JP17H06088, JP19H02591, JP19K16854) from Japan Society for the Promotion of Science and Japan Core Research Evolutional Science and Technology (CREST) (JPMJCR1875).References
- W. M. Sharman, C. M. Allen and J. E. van Lier, in Methods in Enzymology, Academic Press, 2000, vol. 319, pp. 376–400 Search PubMed.
- G. I. Stables and D. V. Ash, Photodynamic therapy, Cancer Treat. Rev., 1995, 21, 311–323 CrossRef CAS PubMed.
- H. I. Pass, Photodynamic Therapy in Oncology: Mechanisms and Clinical Use, JNCI, J. Natl. Cancer Inst., 1993, 85, 443–456 CrossRef CAS PubMed.
- Y. Hayata, H. Kato, J. Ono, Y. Matsushima, N. Hayashi, T. Saito and N. Kawate, in Early Detection and Localization of Lung Tumors in High Risk Groups, ed. P. R. Band, Springer, Berlin, Heidelberg, 1982, pp. 121–130 Search PubMed.
- T. J. Dougherty, J. E. Kaufman, A. Goldfarb, K. R. Weishaupt, D. Boyle and A. Mittleman, Photoradiation Therapy for the Treatment of Malignant Tumors, Cancer Res., 1978, 38, 2628–2635 CAS.
- R. L. Lipson and E. J. Baldes, The Photodynamic Properties of a Particular Hematoporphyrin Derivative, Arch. Dermatol., 1960, 82, 508–516 CrossRef CAS PubMed.
- Y. Miki, J. Akimoto, K. Moritake, C. Hironaka and Y. Fujiwara, Photodynamic therapy using talaporfin sodium induces concentration-dependent programmed necroptosis in human glioblastoma T98G cells, Laser Med. Sci., 2015, 30, 1739–1745 CrossRef PubMed.
- Z. Su, Z. Yang, L. Xie, J. P. DeWitt and Y. Chen, Cancer therapy in the necroptosis era, Cell Death Differ., 2016, 23, 748–756 CrossRef CAS PubMed.
- Z. Mohammadalipour, M. Rahmati, A. Khataee and M. A. Moosavi, Differential effects of N-TiO2 nanoparticle and its photo-activated form on autophagy and necroptosis in human melanoma A375 cells, J. Cell. Physiol., 2020, 235, 8246–8259 CrossRef CAS PubMed.
- T. J. Dougherty, C. J. Gomer, B. W. Henderson, G. Jori, D. Kessel, M. Korbelik, J. Moan and Q. Peng, Photodynamic Therapy, JNCI, J. Natl. Cancer Inst., 1998, 90, 889–905 CrossRef CAS PubMed.
- N. L. Oleinick, R. L. Morris and I. Belichenko, The role of apoptosis in response to photodynamic therapy: what, where, why, and how, Photochem. Photobiol. Sci., 2002, 1, 1–21 CrossRef CAS PubMed.
- A. Saito, T. Nagao, H. Minamitani, T. Iino, T. Yamamoto and K. Aizawa, in Proceedings of the 19th Annual International Conference of the IEEE Engineering in Medicine and Biology Society. “Magnificent Milestones and Emerging Opportunities in Medical Engineering” (Cat. No.97CH36136), 1997, vol. 5, pp. 2294–2295 Search PubMed.
- T. Suzuki, M. Tanaka, M. Sasaki, H. Ichikawa, H. Nishie and H. Kataoka, Vascular Shutdown by Photodynamic Therapy Using Talaporfin Sodium, Cancers, 2020, 12, 2369 CrossRef CAS PubMed.
- S. Cavin, T. Riedel, P. Rosskopfova, M. Gonzalez, G. Baldini, M. Zellweger, G. Wagnières, P. J. Dyson, H.-B. Ris, T. Krueger and J. Y. Perentes, Vascular-targeted low dose photodynamic therapy stabilizes tumor vessels by modulating pericyte contractility, Lasers Surg. Med., 2019, 51, 550–561 CrossRef PubMed.
- M. Karwicka, B. Pucelik, M. Gonet, M. Elas and J. M. Dąbrowski, Effects of Photodynamic Therapy with Redaporfin on Tumor Oxygenation and Blood Flow in a Lung Cancer Mouse Model, Sci. Rep., 2019, 9, 12655 CrossRef PubMed.
- C. S. Foote, Definition of type I and type II photosensitized oxidation, Photochem. Photobiol., 1991, 54, 659 CrossRef CAS PubMed.
- M. Ethirajan, Y. Chen, P. Joshi and R. K. Pandey, The role of porphyrin chemistry in tumor imaging and photodynamic therapy, Chem. Soc. Rev., 2010, 40, 340–362 RSC.
- Z. Huang, R. P. Haugland, W. You and R. P. Haugland, Phallotoxin and actin binding assay by fluorescence enhancement, Anal. Biochem., 1992, 200, 199–204 CrossRef CAS PubMed.
- H. Faulstich, S. Zobeley, G. Rinnerthaler and J. V. Small, Fluorescent phallotoxins as probes for filamentous actin, J. Muscle Res. Cell Motil., 1988, 9, 370–383 CrossRef CAS PubMed.
- M. Ohgushi, M. Matsumura, M. Eiraku, K. Murakami, T. Aramaki, A. Nishiyama, K. Muguruma, T. Nakano, H. Suga, M. Ueno, T. Ishizaki, H. Suemori, S. Narumiya, H. Niwa and Y. Sasai, Molecular Pathway and Cell State Responsible for Dissociation-Induced Apoptosis in Human Pluripotent Stem Cells, Cell Stem Cell, 2010, 7, 225–239 CrossRef CAS PubMed.
- A. Wirth, Rho kinase and hypertension, Biochim. Biophys. Acta, Mol. Basis Dis., 2010, 1802, 1276–1284 CrossRef CAS PubMed.
- H. Kajimoto, K. Hashimoto, N. Bonnet Sandra, A. Haromy, G. Harry, R. Moudgil, T. Nakanishi, I. Rebeyka, B. Thébaud, D. Michelakis Evangelos and L. Archer Stephen, Oxygen Activates the Rho/Rho-Kinase Pathway and Induces RhoB and ROCK-1 Expression in Human and Rabbit Ductus Arteriosus by Increasing Mitochondria-Derived Reactive Oxygen Species, Circulation, 2007, 115, 1777–1788 CrossRef CAS PubMed.
- A. Calzado-Martín, M. Encinar, J. Tamayo, M. Calleja and A. San Paulo, Effect of Actin Organization on the Stiffness of Living Breast Cancer Cells Revealed by Peak-Force Modulation Atomic Force Microscopy, ACS Nano, 2016, 10, 3365–3374 CrossRef PubMed.
- M. Radmacher, R. Tillamnn, M. Fritz and H. Gaub, From molecules to cells: imaging soft samples with the atomic force microscope, Science, 1992, 257, 1900 CrossRef CAS PubMed.
- A. X. Cartagena-Rivera, W.-H. Wang, R. L. Geahlen and A. Raman, Fast, multi-frequency and quantitative nanomechanical mapping of live cells using the atomic force microscope, Sci. Rep., 2015, 5, 11692 CrossRef CAS PubMed.
- M. Dokukin and I. Sokolov, High-resolution high-speed dynamic mechanical spectroscopy of cells and other soft materials with the help of atomic force microscopy, Sci. Rep., 2015, 5, 12630 CrossRef CAS PubMed.
- M. Radmacher, R. W. Tillmann and H. E. Gaub, Imaging viscoelasticity by force modulation with the atomic force microscope, Biophys. J., 1993, 64, 735–742 CrossRef CAS.
- Y. Fang, C. Y. Y. Iu, C. N. P. Lui, Y. Zou, C. K. M. Fung, H. W. Li, N. Xi, K. K. L. Yung and K. W. C. Lai, Investigating dynamic structural and mechanical changes of neuroblastoma cells associated with glutamate-mediated neurodegeneration, Sci. Rep., 2014, 4, 7074 CrossRef PubMed.
- A. Cartagena and A. Raman, Local Viscoelastic Properties of Live Cells Investigated Using Dynamic and Quasi-Static Atomic Force Microscopy Methods, Biophys. J., 2014, 106, 1033–1043 CrossRef CAS PubMed.
- A. Raman, S. Trigueros, A. Cartagena, A. P. Z. Stevenson, M. Susilo, E. Nauman and S. A. Contera, Mapping nanomechanical properties of live cells using multi-harmonic atomic force microscopy, Nat. Nanotechnol., 2011, 6, 809–814 CrossRef CAS PubMed.
- B. A. Smith, B. Tolloczko, J. G. Martin and P. Grütter, Probing the Viscoelastic Behavior of Cultured Airway Smooth Muscle Cells with Atomic Force Microscopy: Stiffening Induced by Contractile Agonist, Biophys. J., 2005, 88, 2994–3007 CrossRef CAS PubMed.
- R. Takahashi and T. Okajima, Mapping power-law rheology of living cells using multi-frequency force modulation atomic force microscopy, Appl. Phys. Lett., 2015, 107, 173702 CrossRef.
- R. E. Mahaffy, C. K. Shih, F. C. MacKintosh and J. Käs, Scanning Probe-Based Frequency-Dependent Microrheology of Polymer Gels and Biological Cells, Phys. Rev. Lett., 2000, 85, 880–883 CrossRef CAS PubMed.
- S. Iyer, R. M. Gaikwad, V. Subba-Rao, C. D. Woodworth and I. Sokolov, Atomic force microscopy detects differences in the surface brush of normal and cancerous cells, Nat. Nanotechnol., 2009, 4, 389–393 CrossRef CAS PubMed.
- J. R. Staunton, B. L. Doss, S. Lindsay and R. Ros, Correlating confocal microscopy and atomic force indentation reveals metastatic cancer cells stiffen during invasion into collagen I matrices, Sci. Rep., 2016, 6, 19686 CrossRef CAS PubMed.
- C. J. Cattin, M. Düggelin, D. Martinez-Martin, C. Gerber, D. J. Müller and M. P. Stewart, Mechanical control of mitotic progression in single animal cells, Proc. Natl. Acad. Sci. U. S. A., 2015, 112, 11258–11263 CrossRef CAS PubMed.
- S. E. Cross, Y.-S. Jin, J. Rao and J. K. Gimzewski, Nanomechanical analysis of cells from cancer patients, Nat. Nanotechnol., 2007, 2, 780–783 CrossRef CAS PubMed.
- C. Formosa-Dague, P. Speziale, T. J. Foster, J. A. Geoghegan and Y. F. Dufrêne, Zinc-dependent mechanical properties of Staphylococcus aureus biofilm-forming surface protein SasG, Proc. Natl. Acad. Sci. U. S. A., 2016, 113, 410–415 CrossRef CAS PubMed.
- G. Lukinavičius, L. Reymond, E. D'Este, A. Masharina, F. Göttfert, H. Ta, A. Güther, M. Fournier, S. Rizzo, H. Waldmann, C. Blaukopf, C. Sommer, D. W. Gerlich, H.-D. Arndt, S. W. Hell and K. Johnsson, Fluorogenic probes for live-cell imaging of the cytoskeleton, Nat. Methods, 2014, 11, 731–733 CrossRef PubMed.
- G. Lukinavičius, K. Umezawa, N. Olivier, A. Honigmann, G. Yang, T. Plass, V. Mueller, L. Reymond, I. R. Corrêa Jr, Z.-G. Luo, C. Schultz, E. A. Lemke, P. Heppenstall, C. Eggeling, S. Manley and K. Johnsson, A near-infrared fluorophore for live-cell super-resolution microscopy of cellular proteins, Nat. Chem., 2013, 5, 132–139 CrossRef PubMed.
- O. Shimokawa, H. Matsui, Y. Nagano, T. Kaneko, T. Shibahara, A. Nakahara, I. Hyodo, A. Yanaka, H. J. Majima, Y. Nakamura and Y. Matsuzaki, Neoplastic transformation and induction of H+,K+-adenosine triphosphatase by N-methyl-N′-nitro-N-nitrosoguanidine in the gastric epithelial RGM-1 cell line, In Vitro Cell. Dev. Biol.: Anim., 2008, 44, 26–30 CrossRef CAS PubMed.
- S. Etienne-Manneville and A. Hall, Rho GTPases in cell biology, Nature, 2002, 420, 629–635 CrossRef CAS PubMed.
- K. Burridge, E. Monaghan-Benson and D. M. Graham, Mechanotransduction: from the cell surface to the nucleus via RhoA, Philos. Trans. R. Soc., B, 2019, 374, 20180229 CrossRef CAS PubMed.
- C. Kanthou and G. M. Tozer, The tumor vascular targeting agent combretastatin A–4-phosphate induces reorganization of the actin cytoskeleton and early membrane blebbing in human endothelial cells, Blood, 2002, 99, 2060–2069 CrossRef CAS PubMed.
- I. N. Sneddon, The relation between load and penetration in the axisymmetric boussinesq problem for a punch of arbitrary profile, Int. J. Eng. Sci., 1965, 3, 47–57 CrossRef.
- S. Hartmann, A. J. Ridley and S. Lutz, The Function of Rho-Associated Kinases ROCK1 and ROCK2 in the Pathogenesis of Cardiovascular Disease, Front. Pharmacol., 2015, 6, 276 Search PubMed.
- S. Honda, Y. Kurimoto, Y. Kagotani, H. Yamamoto, H. Takagi and M. Uenishi, and for the Hyogo Macular Disease Study Group, Photodynamic therapy for typical age-related macular degeneration and polypoidal choroidal vasculopathy: A 30-month multicenter study in Hyogo, Japan, Jpn. J. Ophthalmol., 2009, 53, 593–597 CrossRef CAS PubMed.
- M. Quaranta, M. Mauget-Faÿsse and G. Coscas, Exudative idiopathic polypoidal choroidal vasculopathy and photodynamic therapy with verteporfin, Am. J. Ophthalmol., 2002, 134, 277–280 CrossRef PubMed.
- F. Gomi, M. Ohji, K. Sayanagi, M. Sawa, H. Sakaguchi, Y. Oshima, Y. Ikuno and Y. Tano, One-Year Outcomes of Photodynamic Therapy in Age-Related Macular Degeneration and Polypoidal Choroidal Vasculopathy in Japanese Patients, Ophthalmology, 2008, 115, 141–146 CrossRef PubMed.
Footnote |
| † Electronic supplementary information (ESI) available. See DOI: 10.1039/d1ra09291j |
| This journal is © The Royal Society of Chemistry 2022 |

