 Open Access Article
Creative Commons Attribution 3.0 Unported Licence
A sorbent containing pH-responsive chelating residues of aspartic and maleic acids for mitigation of toxic metal ions, cationic, and anionic dyes†
Shaikh A. Ali *ab,
Shuaib A. Mubaraka,
Ibrahim Y. Yaagooba,
Zeeshan Arshad
 a and
Mohammad A. J. Mazumder*ab
aChemistry Department, King Fahd University of Petroleum & Minerals, Dhahran 31261, Saudi Arabia. E-mail: shaikh@kfupm.edu.sa; jafar@kfupm.edu.sa; Fax: +966 13 860 4277; Tel: +966 13 860 7836
bInterdisciplinary Research Center for Advanced Materials, King Fahd University of Petroleum & Minerals, Dhahran 31261, Saudi Arabia
First published on 17th February 2022
Abstract
t-Butyl hydroperoxide-initiated cycloterpolymerization of diallylaminoaspartic acid hydrochloride [(CH2![[double bond, length as m-dash]](https://www.rsc.org/images/entities/char_e001.gif) CHCH2)2NH+CH(CO2H)CH2CO2H Cl−] (I), maleic acid (HO2CH
CHCH2)2NH+CH(CO2H)CH2CO2H Cl−] (I), maleic acid (HO2CH![[double bond, length as m-dash]](https://www.rsc.org/images/entities/char_e001.gif) CHCO2H) (II) and cross-linker tetraallylhexane-1,6-diamine dihydrochloride [(CH2
CHCO2H) (II) and cross-linker tetraallylhexane-1,6-diamine dihydrochloride [(CH2![[double bond, length as m-dash]](https://www.rsc.org/images/entities/char_e001.gif) CHCH2)2NH+(CH2)6NH+ (CH2CH
CHCH2)2NH+(CH2)6NH+ (CH2CH![[double bond, length as m-dash]](https://www.rsc.org/images/entities/char_e001.gif) CH2)2 2Cl−] (III) afforded a new pH-responsive resin (IV), loaded with four CO2H and a chelating motif of NH+⋯CO2− in each repeating unit. The removal of cationic methylene blue (MB) (3000 ppm) at pH 7.25 and Pb(II) (200 ppm) at pH 6 by IV at 298, 313, and 328 K followed second-order kinetics with Ea of 33.4 and 40.7 kJ mol−1, respectively. Both MB and Pb(II) were removed fast, accounting for 97.7% removal of MB within 15 min at 313 K and 94% of Pb(II) removal within 1 min. The super-adsorbent resin gave respective qmax values of 2609 mg g−1 and 873 mg g−1 for MB and Pb(II). IV was also found to trap anionic dyes; it removed 91% Eriochrome Black T (EBT) from its 50 ppm solutions at pH 2. The resin was found to be effective in reducing priority metal contaminants (like Cr, Hg, Pb) in industrial wastewater to sub-ppb levels. The synthesis of the recyclable resin can be easily scaled up from inexpensive starting materials. The resin has been found to be better than many recently reported sorbents.
CH2)2 2Cl−] (III) afforded a new pH-responsive resin (IV), loaded with four CO2H and a chelating motif of NH+⋯CO2− in each repeating unit. The removal of cationic methylene blue (MB) (3000 ppm) at pH 7.25 and Pb(II) (200 ppm) at pH 6 by IV at 298, 313, and 328 K followed second-order kinetics with Ea of 33.4 and 40.7 kJ mol−1, respectively. Both MB and Pb(II) were removed fast, accounting for 97.7% removal of MB within 15 min at 313 K and 94% of Pb(II) removal within 1 min. The super-adsorbent resin gave respective qmax values of 2609 mg g−1 and 873 mg g−1 for MB and Pb(II). IV was also found to trap anionic dyes; it removed 91% Eriochrome Black T (EBT) from its 50 ppm solutions at pH 2. The resin was found to be effective in reducing priority metal contaminants (like Cr, Hg, Pb) in industrial wastewater to sub-ppb levels. The synthesis of the recyclable resin can be easily scaled up from inexpensive starting materials. The resin has been found to be better than many recently reported sorbents.
1. Introduction
Industrial effluents containing dyes damage the aquatic environment. Therefore, the remediation of dye-contaminated wastewater is highly significant for the protection of the environmental ecology. The textile industry uses methylene blue (MB), which is discharged into the environment via the effluents of textile, paper, and printing industries,1 thereby causing various ecological problems.2 Commercial annual production of dyes is ≈7 × 10⁵ tons, a considerable fraction of which is discharged directly in aqueous effluent.3 The dyes discharged into river streams cause enormous harm to aquatic life4 by reducing light penetration and photosynthesis.5 In addition to being carcino- and muta-genic, most dyes are not biodegradable,6 which makes bioremediation7 an inefficient process.8The discharge of toxic metal ions has also added to the woes of the environment. The Chinese standard set a maximum of 0.01 mg L−1 for Pb in drinking water.9 However, the goal of the U.S. Environmental Protection Agency (EPA) is to achieve a concentration approaching zero.10 The water scarcity makes it imperative to remediate the wastewaters. The chelating ion-exchange resins are quite effective in removing toxic metal ions from wastewaters.11 The chelating ligands offer remarkable selectivity in trapping heavy metal ions in the presence of alkali and alkaline earth metal ions.
Because of simplicity and cost-effectiveness, the adsorption technique12 is extensively used to remove inorganic and organic contaminants from industrial wastewater.8,13 Among various adsorbents reported for MB removal,14 the relatively high cost of activated carbon limits its application, which encourages exploration for better low-cost adsorbents like biomass, clays minerals, and zeolites.5,15 There is demand for readily available cheap, environment friendly, and recyclable adsorbents for remediation of pollutants.
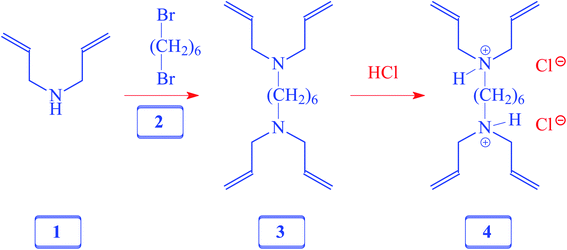
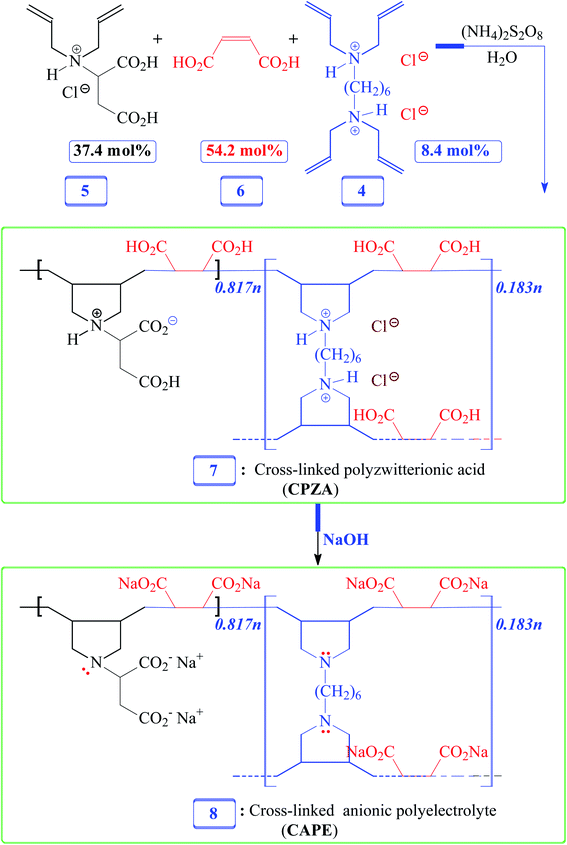
Herein, we would like to synthesize a new resin and examine its efficacy in the removal of Pb(II), cationic dye MB, and anionic dye Eriochrome Black T (EBT) from aqueous systems. For this purpose, adsorbent cross-linked polyzwitterionic acid (CPZA) 7 has been synthesized for the first time using cyclopolymerization protocol16–18 involving inexpensive cross-linker 4, N,N-diallylaspartic acid hydrochloride (5) bearing the skeleton of aspartic acid [H3N+CH(CH2CO2H)2CO2−], and maleic acid (MA) 6 (Schemes 1 and 2). The current pH-responsive resin 7, loaded with four CO2H and chelating motifs of NH+⋯CO2− in each repeating unit, offers the latitude for effective mitigation of cationic as well as anionic materials.
2. Experimental
2.1. Physical methods
A PerkinElmer (16F PC) spectrometer was used to record FTIR spectra. Atomic compositions were determined using a PerkinElmer instrument (Model 2400). An SDT analyzer (Q600: TA Instruments) was used to perform thermogravimetric analyses (TGA) under a flow of N2. Solution pHs were measured using a Sartorius pH meter. The surface morphology of the resins was examined by SEM-EDX spectroscopy. Surface area and porosimetry analyzer (Micromeritics) were used to characterize the resin using Brunauer–Emmett–Teller and Barrett–Joyner–Halenda methods. Using a UV-Vis spectrophotometer (Thermo Electron), MB concentrations were determined at pH 7 at λmax of 665 nm. USEPA Method 6020A19 was utilized to determine the Pb(II) concentrations by the Inductively Coupled Plasma-Mass Spectrometer (ICP-MS XSERIES-II), which has 0.05 ppb as the detection limit. Various Pb(II) concentrations along with a blank were used to calibrate the ICP-MS instrument.2.2. Materials
Diallylamine, dimethyl maleate, allyl chloride, 1,6-dibromohexane, tert-butylhydroperoxide (TBHP) were purchased from Fluka AG and used as received. MB trihydrate (C16H24ClN3O3S: molar mass 373.9), MA, and maleic acid were purchased from Sigma-Aldrich. All water used was of Milli-Q quality. ACS certified Pb(NO3)2 from Fischer Scientific Co was used to prepare a 2000 ppm Pb(II) as a stock solution. Monomer N,N-diallylaspartic acid hydrochloride (5) was synthesized as a white solid (85%) by reacting diallylamine and dimethyl maleate using the procedure as described.202.3. Synthesis of N1,N1,N6,N6-tetraallylhexane-1,6-diamine 4
A solution of diallylamine 1 (33.5 g, 345 mmol) and 1,6-dibromoheane 2 (20.7 g, 85 mmol) in toluene (80 mL) was heated in a closed vessel at 115 °C for 24 h. After washing the reaction mixture with 5% NaOH (120 mL), the organic layer was dried (Na2SO4), concentrated, and distilled to obtain amine 3 as a colorless liquid (18 g, 77%, bp 0.6 mbarHg, 110 °C). 1H NMR and IR spectra of the amine matched with those reported21 for 3, which was prepared using a different route.2.4. Synthesis of cross-linker 4
A solution of 3 (10 g, 36 mmol) in water (20 mL) was treated with dropwise addition of conc. HCl (37%, 8.5 g, 86 mmol) and stirred at room temperature for 30 min. The homogeneous solution was freeze-dried and the residual sticky liquid was crystallized (MeOH–ether–acetone) to obtain 4 as a white solid (11 g, 87%). Mp 138–140 °C. (Found: C, 61.6; H, 10.0; N, 7.9. C18H34Cl2N2 requires C, 61.88; H, 9.81; N, 8.02%); vmax (KBr): 3438, 3079, 2912, 2706, 2630, 2540, 1642, 1438, 1366, 1309, 1253, 1048, 997, 940, 738, and 640 cm−1; δH (D2O): 1.27 (4H, m), 1.62 (4H, m), 3.02 (4H, m), 3.66 (8H, d, J 7.05 Hz), 5.48 (8H, m), 5.80 (4H, m), (HOD: 4.65). δC (D2O): 23.83 (2C), 25.94 (2C), 52.67 (2C), 55.49 (4C), 126.36 (4C,![[double bond, length as m-dash]](https://www.rsc.org/images/entities/char_e001.gif) CH), 127.24 (4C,
CH), 127.24 (4C, ![[double bond, length as m-dash]](https://www.rsc.org/images/entities/char_e001.gif) CH2) (dioxane: 67.40 ppm).
CH2) (dioxane: 67.40 ppm).
2.5. Synthesis of CPZA 7
A solution of monomer 5 (17.5 mmol), maleic acid (6) (27.5 mmol), and cross-linker 4 (1.38 g, 3.95 mmol) in water (4.75 g) were prepared in an RB flask (50 mL). After purging the reaction mixture with N2, TBHP (600 mg) was added, and the mixture in the closed flask was stirred using a magnetic stir-bar at 75 °C for 24 h. The stir-bar became immobile; water (3 mL) was added to the gelly mixture, and the polymerization was continued at 85 °C for a further 12 h. The solidified material was soaked in water for 24 h, filtered, and washed with water. The white resin CPZA 7 was dried under vacuum at 70 °C (6.8 g, 84%). A mass of 375.5 mg of resin 7 is calculated to have 0.817 mmol of monomer (5-HCl), 1.183 mmol of maleic acid 6, and 0.183 mmol of cross-linker 4 in a 5/6/4 mol ratio of 37.4![[thin space (1/6-em)]](https://www.rsc.org/images/entities/char_2009.gif) :
:![[thin space (1/6-em)]](https://www.rsc.org/images/entities/char_2009.gif) 54.2
54.2![[thin space (1/6-em)]](https://www.rsc.org/images/entities/char_2009.gif) :
:![[thin space (1/6-em)]](https://www.rsc.org/images/entities/char_2009.gif) 8.4 to match the feed ratio. (Found: C, 50.8; H, 6.4; N, 4.5. Resin 7 containing monomer 5-HCl/6/4 in a mol ratio 37.4
8.4 to match the feed ratio. (Found: C, 50.8; H, 6.4; N, 4.5. Resin 7 containing monomer 5-HCl/6/4 in a mol ratio 37.4![[thin space (1/6-em)]](https://www.rsc.org/images/entities/char_2009.gif) :
:![[thin space (1/6-em)]](https://www.rsc.org/images/entities/char_2009.gif) 54.2
54.2![[thin space (1/6-em)]](https://www.rsc.org/images/entities/char_2009.gif) :
:![[thin space (1/6-em)]](https://www.rsc.org/images/entities/char_2009.gif) 8.4 requires C, 51.82; H, 6.23; N, 4.42%); vmax (KBr): 3566, 2937, 2526, 1731,1597, 1395, 1190, 1029, 810, and 629 cm−1.
8.4 requires C, 51.82; H, 6.23; N, 4.42%); vmax (KBr): 3566, 2937, 2526, 1731,1597, 1395, 1190, 1029, 810, and 629 cm−1.
2.6. Conversion of CPZA 7 to CAPE 8
A sample of resin 7 (1.00 g) (containing 2.18 mmol RU of 5 (–HCl), 3.15 mmol of 6, and 0.487 mmol of 4) is calculated to have 8.48 mmol protonated CO2H and 3.15 mmol protonated NH+. The sample was stirred for 2 h at room temperature in water (10 mL) containing NaOH (1.4 g, 35 mmol). The mixture, upon filtration and washing with excess methanol (remove unreacted NaOH), afforded CAPE 8 (vacuum dried at 60 °C, 1.1 g, ≈100%). A sample of CAPE 8 (450 mg) contains repeating units of the disodium salt of monomer 5 (0.817 mmol), disodium maleate (1.183 mmol), and unprotonated amine form 3 (0.183 mmol). (Found: C, 42.2; H, 4.4; N, 3.5%. Resin 8 containing disodium 5/disodium 6/3 in a mol ratio 37.4![[thin space (1/6-em)]](https://www.rsc.org/images/entities/char_2009.gif) :
:![[thin space (1/6-em)]](https://www.rsc.org/images/entities/char_2009.gif) 54.2
54.2![[thin space (1/6-em)]](https://www.rsc.org/images/entities/char_2009.gif) :
:![[thin space (1/6-em)]](https://www.rsc.org/images/entities/char_2009.gif) 8.4 requires C, 43.24; H, 4.22; N, 3.69%). vmax (KBr): 3484, 2933, 2858, 2803, 1660, 1582, 1399, 1298, 1208, 1151, 1108, 1029, 877, and 812 cm−1.
8.4 requires C, 43.24; H, 4.22; N, 3.69%). vmax (KBr): 3484, 2933, 2858, 2803, 1660, 1582, 1399, 1298, 1208, 1151, 1108, 1029, 877, and 812 cm−1.
2.7. Ion exchange capacity (IEC)
The sample was centrifuged after stirring 100 mg of CAPE 8 with 25 mL of 0.1 M HCl for 6 h. Upon titration of a certain volume of the resin-free liquid with 0.1 M NaOH, the excess acid was calculated to determine the IEC using eqn (1):
 | (1) |
2.8. Swelling coefficient (SC)
A certain mass of the 20 to 30 mesh size resins was filled in a burette and then immersed in water. After 12 h, the volume changes were measured, and the SCs (final/initial volume ratio) was found to be 1.3 and 4.0 for resins 7 and 8, respectively. When resin 7 was covered with 1 M HCl instead of neutral H2O, its zwitterionic motifs were transformed to cationic motifs, giving an SC value of 2.1.2.9. Adsorption of experiments
Eqn (2) was used to calculate the adsorption capacity, qe (mg g−1), where the volume, V of MB solution is expressed in L and m denotes the mass of CPZA 7 in g.
 | (2) |
Eqn (3) expresses the percent MB-removal (R).
 | (3) |
RB flask of 250 mL size containing CPZA 7 (250 mg) in water (100 − x mL) and x mL of 1.0 M NaOH was used to conduct the kinetic runs at various temperatures. Several pretrial experiments were performed to find out the value of x mL as ≈1.5 mL required to adjust the final pH to 7.25 subsequent to the addition of MB trihydrate in solid form (351 mg) (MW 373.9 g mol−1), to make the concentration of MB (MW 319.85 g mol−1) as 3000 ppm. After stirring the mixture using a magnetic stir-bar (300 rpm), the stirring was briefly stopped at several time intervals to collect ≈0.2 mL of the supernatant, which was used after appropriate dilution to determine the MB concentrations at pH 7. Eqn (4) was to determine the adsorption capacity, qt (mg g−1) at various time t.
 | (4) |
Isotherm fitting and statistical analyses were carried out using a MATLAB environment.
The mixtures of CPZA 7 (250 mg), water (88.8 mL), 1 M NaOH (1.2 mL), and 2000 ppm Pb(II) (10 mL) in 250 mL RB flasks were stirred (300 rpm) at 298, 313, and 328 K. Volume of 1 M NaOH was determined by several pretrial runs to maintain the final pH at 6. The mixture thus became 200 ppm in Pb(II). The stirring was briefly stopped at several time intervals to collect ≈0.2 mL of the supernatants to determine Pb(II) concentrations for the kinetic runs. Using eqn (4), adsorption capacities, qt (mg g−1) at various times t was determined.
2.10. Recycling experiment involving MB and Pb(II)
After centrifugation and removal of the supernatant, the residual resin was washed with water (5 mL). To dislodge MB from the MB-loaded residue, it was stirred twice for 15 min – first with 10 mL 1 M HCl and then with 5 mL 0.1 M HCl. The two supernatants were mixed and analyzed to determine the concentration of the desorbed MB. The regenerated CPZA was washed with water and used to quadruplicate the above cycle.
3. Results and discussion
3.1. Adsorbent (CPZA 7) synthesis
Numerous linear cyclopolymers of industrial importance have been synthesized via free radical polymerization of various diallylammonium monomers. The polymer backbone is embedded with cyclic pyrrolidine rings.16,17 Copolymerization of maleic acid (MA) with diallylammonium salts having reactivity ratios of almost zero gives alternate copolymers.18 Copolymerization precludes the formation of individual homopolymers because of the zero reactivity ratios. To synthesize the cross-linked alternate copolymer, cross-linker 4 was synthesized in excellent yield as outlined in Scheme 1. The alternate copolymerization of monomers 5 (37.4 mol%) and 6 (54.2 mol%) in the presence of cross-linker 6 (8.4 mol%) and TBHP initiator afforded CPZA 7 in 84% yield (Scheme 2). The C![[double bond, length as m-dash]](https://www.rsc.org/images/entities/char_e001.gif) C and = C–H stretching of diallyl motifs in the monomers usually appears at ≈ 1640 cm−1 and ≈3080 cm−1, respectively.20,21 These vibrations are absent in the synthesized resin 7, thereby implying the absence of any residual alkene motifs as it is consumed to form the cyclic rings. Upon treatment with NaOH, pH-responsive CPZA 7 was transformed to its anionic form CAPE 8. The % mol ratio of monomers 5/6/4 incorporated into the resin was approximated to be 37.4
C and = C–H stretching of diallyl motifs in the monomers usually appears at ≈ 1640 cm−1 and ≈3080 cm−1, respectively.20,21 These vibrations are absent in the synthesized resin 7, thereby implying the absence of any residual alkene motifs as it is consumed to form the cyclic rings. Upon treatment with NaOH, pH-responsive CPZA 7 was transformed to its anionic form CAPE 8. The % mol ratio of monomers 5/6/4 incorporated into the resin was approximated to be 37.4![[thin space (1/6-em)]](https://www.rsc.org/images/entities/char_2009.gif) :
:![[thin space (1/6-em)]](https://www.rsc.org/images/entities/char_2009.gif) 54.2
54.2![[thin space (1/6-em)]](https://www.rsc.org/images/entities/char_2009.gif) :
:![[thin space (1/6-em)]](https://www.rsc.org/images/entities/char_2009.gif) 8.4, same as the feed ratio; this is expected at such a high conversion. Under the reaction conditions, neither diallyamine salts nor maleic acid can undergo homopolymerization; the polymerization invariably leads to the formation of alternate addition of diallylamine salt and maleic acid.18 The high IEC value of 7.65 mmol g−1 was attributed to CAPE 8 having four CO2− groups in each repeating unit.
8.4, same as the feed ratio; this is expected at such a high conversion. Under the reaction conditions, neither diallyamine salts nor maleic acid can undergo homopolymerization; the polymerization invariably leads to the formation of alternate addition of diallylamine salt and maleic acid.18 The high IEC value of 7.65 mmol g−1 was attributed to CAPE 8 having four CO2− groups in each repeating unit.
3.2. Morphology of CPZA 7
BET analysis gave the textural parameters of CPZA 7 as listed in Table 1. For CPZA 7, the surface area was found to be greater than 0.1 m2 g−1 known for various ionic sorbents.11,22| BET surface area (m2 g−1) | Total pore volume (cm3 g−1) | Pore diameter (nm) |
|---|---|---|
| 1.62 | 5.20 × 10⁻³ | 12.8 |
3.3. TGA of CPZA 7
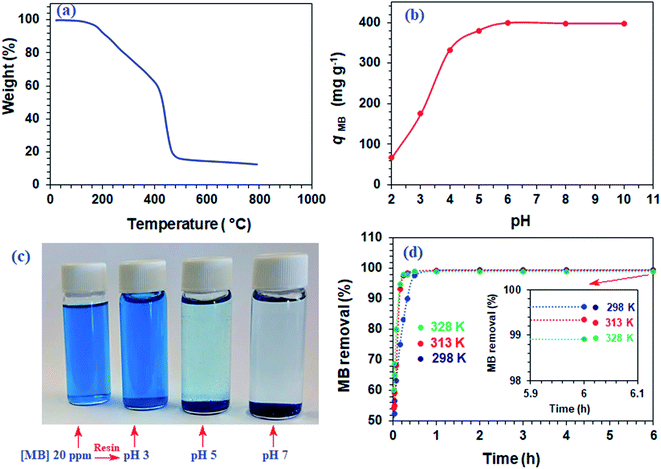
The TGA curve for resin 7, shown in Fig. 1a, reveals a weight loss of 7.5% up to 200 °C owing to the moisture loss. A gradual loss of 34% in the 200–415 °C range is attributed to the release of (i) H2O during the formation of anhydride units both in the pendant as well as in the backbone and (ii) maleic anhydride units from the pendants.23,24 A steep loss of 42% in the 515–800 °C range was accounted by the degradation of the nitrogenated organic fraction along with the removal of maleic acid units from the backbone. The resin was found to be stable up to 200 °C.3.4. Dependency of qe on pH
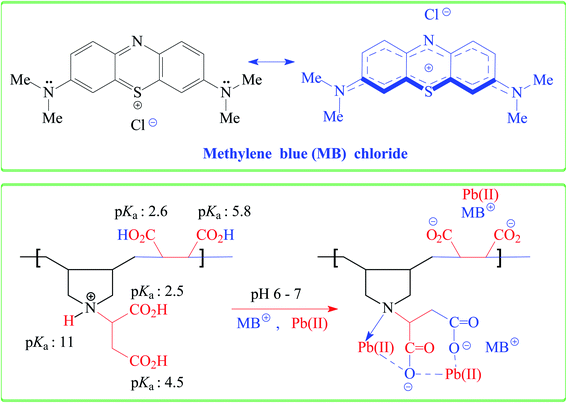
The qe increases with increasing pH and remains constant after pH 7 (Fig. 1b). The succinic acid motifs have two ionizable CO2H groups having expected pKa of 2.6 and 5.8,18 while the pKa values of 2.5 and 4.5 could be assigned to the two CO2H groups in the residues of aspartic acid residue.25,26 In the pH range 6–7.25 used in the current study, the majority of CO2H groups is expected to be anionic CO2− which can impart electrostatic attraction to entrap cationic MB (Scheme 3). As can be seen in Fig. 1c, the color of MB almost vanishes at pH 7 where the blue-colored resin-MB complex settles down at the bottom.3.5. Adsorption kinetics of MB
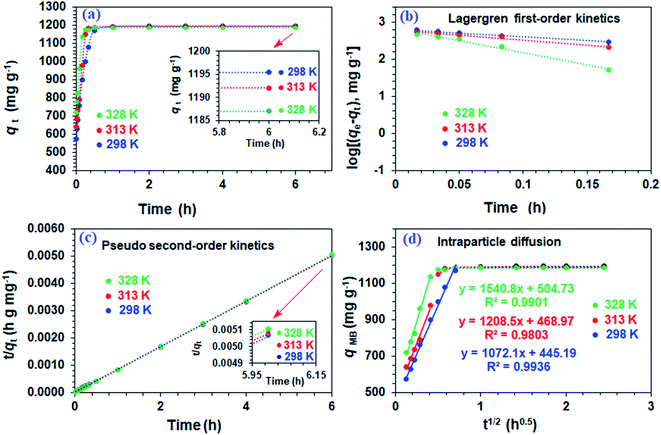
The resin demonstrated a very fast adsorptive removal of MB with qt values attaining the equilibrium qe at around ≈15 min (Fig. 2a), whereby 83.3, 97.7, and 98.0% MB is adsorbed from its 3000 ppm solutions at respective temperatures of 298, 313, and 328 K (Fig. 1d). The decrease of qe with increasing temperatures reveals the exothermic nature of the adsorption process (inset in Fig. 1d and 2a).First-order (Fig. 2b), second-order (Fig. 2c), and intraparticle diffusion kinetics (Fig. 2d) were used to analyze the MB adsorption data using eqn (5),11 (6), and (7), respectively, having corresponding rate constants of k1, k2, and kp.
 | (5) |
 | (6) |
| qt = xi + kpt0.5 | (7) |
The kinetic data fitted the second-order model better as revealed by R2 and closeness of the qcal and qexp values, thereby suggesting MB removal as a chemisorption process (Table 2).27 The electronic interactions between donor CO2− and acceptor cationic aromatic rings may lead to chemisorption.28,29 The adsorption processes usually involve film diffusion, followed by intraparticle diffusion and adsorption ![[left over right harpoons]](https://www.rsc.org/images/entities/char_21cb.gif) desorption equilibrium (mass action). Intraparticle plots have significant intercepts, xi (Fig. 2d), pointing towards the extensive contribution of film diffusion.30,31 In the bilinear plots, the initial lines with steeper slopes (kp) describe the intraparticle diffusion,32,33 while the horizontal lines represent (Table 2) the mass action equilibria (Fig. 2d).
desorption equilibrium (mass action). Intraparticle plots have significant intercepts, xi (Fig. 2d), pointing towards the extensive contribution of film diffusion.30,31 In the bilinear plots, the initial lines with steeper slopes (kp) describe the intraparticle diffusion,32,33 while the horizontal lines represent (Table 2) the mass action equilibria (Fig. 2d).
| Second-order kinetics | ||||||
|---|---|---|---|---|---|---|
| Temp. (K) | qe,exp (mg g−1) | k2 (h−1 g mg−1) | hb (h−1 mg g−1) | qe,calc (mg g−1) | R2 | Ea (kJ mol−1) |
| a Adsorption of MB (3000 ppm, 100 mL) by CPZA 7 (250 mg) (final pH: ≈ 7.25).b Initial adsorption rate h = k2qe2. | ||||||
| 298 | 1195 | 0.02542 | 36![[thin space (1/6-em)]](https://www.rsc.org/images/entities/char_2009.gif) 894 894 |
1205 | 0.9999 | 33.4 |
| 313 | 1192 | 0.04429 | 63![[thin space (1/6-em)]](https://www.rsc.org/images/entities/char_2009.gif) 516 516 |
1198 | 1.000 | |
| 328 | 1187 | 0.08704 | 123![[thin space (1/6-em)]](https://www.rsc.org/images/entities/char_2009.gif) 229 229 |
1190 | 1.000 | |
| First-order kinetics | ||||
|---|---|---|---|---|
| Temp. (K) | qe,exp (mg g−1) | k1 (h−1) | qe,calc (mg g−1) | R2 |
| 298 | 1195 | 4.915 | 665.0 | 0.9986 |
| 313 | 1192 | 6.345 | 631.0 | 0.9832 |
| 328 | 1187 | 15.21 | 691.8 | 0.9816 |
| Intraparticle diffusion | ||||
|---|---|---|---|---|
| Temp. (K) | kp (mg g−1 h−1/2) | xi (mg g−1) | Ri | R2 |
| 298 | 1072 | 445 | 0.628 | 0.9936 |
| 313 | 1209 | 469 | 0.607 | 0.9803 |
| 328 | 1541 | 505 | 0.575 | 0.9901 |
Eqn (8) was used to calculate the initial adsorption factor (Ri).
 | (8) |
Using the intercept (xi), which is the instantaneous adsorption at time zero, and qe, exp values from Table 2, the Ri values were calculated to be 0.628, 0.607, and 0.575 at respective temperatures of 298, 313 and 328 K, implying the corresponding instantaneous removal of 37.2, 39.3 and 42.5%. The increase in temperature increases the xi values, indicating the decrease in resistance to external diffusion.33
3.6. Infrared spectra
For the IR spectrum, the MB-loaded resin, collected from the kinetic experiments, was washed and dried under vacuum. The band for the C![[double bond, length as m-dash]](https://www.rsc.org/images/entities/char_e001.gif) O stretching of COOH in CPZA 7A appeared at 1731 cm−1, while the adsorption owing to CO2− in the zwitterionic motifs in 7 was attributed to the band at 1597 cm−1 (Fig. 3b). The bands at 1399 and 1582 cm−1 were assigned to the CO2− vibrations in the anionic resin 8 (Fig. 3c).34 A band at 1601 cm−1 was attributed to the ring vibrations of MB·3H2O (Fig. 3a).35 The considerable shift of C
O stretching of COOH in CPZA 7A appeared at 1731 cm−1, while the adsorption owing to CO2− in the zwitterionic motifs in 7 was attributed to the band at 1597 cm−1 (Fig. 3b). The bands at 1399 and 1582 cm−1 were assigned to the CO2− vibrations in the anionic resin 8 (Fig. 3c).34 A band at 1601 cm−1 was attributed to the ring vibrations of MB·3H2O (Fig. 3a).35 The considerable shift of C![[double bond, length as m-dash]](https://www.rsc.org/images/entities/char_e001.gif) O band to 1609 cm−1 (Fig. 3d) away from that of COOH at 1731 cm−1 (Fig. 3b) confirms the CO2−/MB interactions.
O band to 1609 cm−1 (Fig. 3d) away from that of COOH at 1731 cm−1 (Fig. 3b) confirms the CO2−/MB interactions.
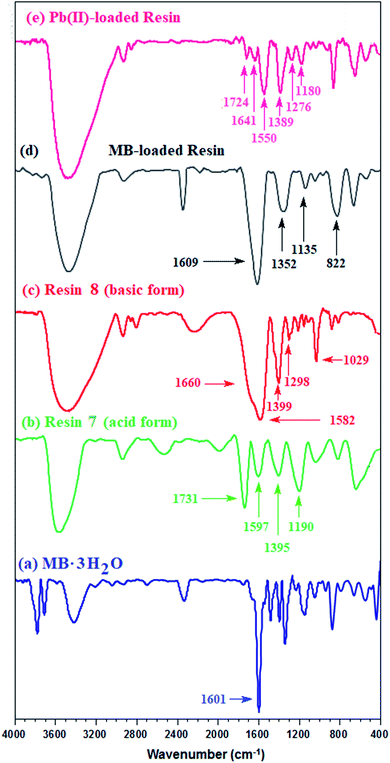 | ||
| Fig. 3 IR spectra of (a) MB + trihydrate; (b) CPZA 7; (c) CAPE 8; resin loaded (d) with MB and (e) Pb(II). | ||
3.7. MB adsorption: energy of activation energy (Ea)
Using second-order rate constants k2 (Table 2) and the Arrhenius (eqn (9)), the Ea was found to be 33.4 kJ mol−1 (Fig. 4a); the relatively large value implies a chemisorption process.
 | (9) |
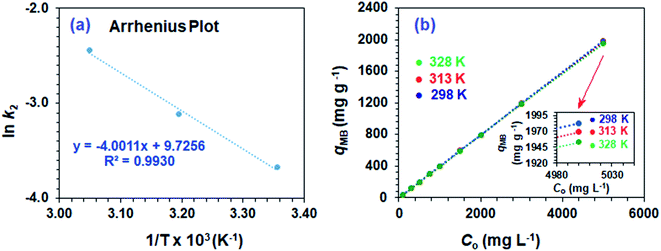 | ||
| Fig. 4 (a) Arrhenius plot and (b) dependency of qe of CPZA 7 on the initial MB concentrations (Co) at 298, 313 and 328 K. | ||
3.8. MB adsorption isotherms
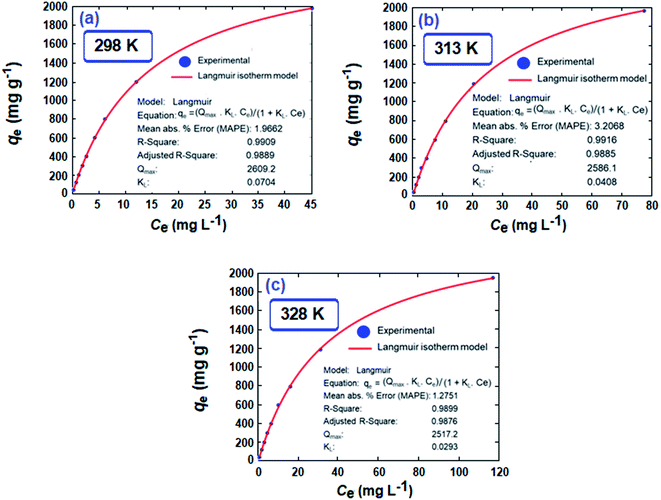
A set of qe and Ce using various concentrations (Co in the range 100–5000 ppm) of MB at three different temperatures was determined to construct adsorption isotherms. Fig. 4b displays the qe versus Co plots. Using the qe and Ce values at 298 K, linear Temkin, Langmuir, Dubinin–Radushkevich, and Freundlich, isotherms36 were constructed (not displayed here) and found to have respective R2 0.8865, 0.9995, 0.6965, and 0.9672. The linear Langmuir isotherm thus showed the best fitting with a staggering qm value of 2632 mg g−1.The qe and Ce values were used to fit into the nonlinear Langmuir isotherm as per eqn (10) to extract thermodynamic parameters. The units of qe and qmax are in mg g−1, while those of Ce and the Langmuir equilibrium constant KL are in mg L−1 and L mg−1, respectively. Using eqn (11), the equilibrium constant KL was converted37–39 to  in Van't Hoff eqn (12),
  must be dimensionless.
  in eqn (12) becomes unitless by assuming the coefficient of activity, γ as dimensionless 1, [MB]° as 1 mol L−1 for the standard MB concentration, the molar mass (Mw) in g mol−1 of MB as 319.85, and by changing the unit of KL from L mg−1 to L g−1 by multiplying with 1000.
 | (10) |
 | (11) |
 | (12) |
Nonlinear isotherms are displayed in Fig. 5. The RAdj2 values were highly satisfactory; the large qm value of 2609, 2586, and 2517 mg g−1 at respective temperatures of 298, 313, and 328 K does indeed make CPZA 7 a super-adsorbent (Fig. 5).
The adsorption process is favorable, as indicated by the relatively large negative values of ΔG° (Table 3). The decrease in qMB with increasing temperatures makes the adsorption an exothermic process (Fig. 6a). The ΔH°, ΔS°, and ΔG°  values, extracted from the Van't Hoff plot (Fig. 6b), are included in Table 3.
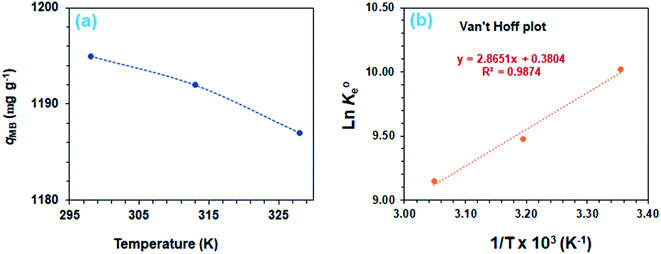 | ||
| Fig. 6 (a) Dependency of MB adsorption capacity, qe on temperature [50 mg CPZA 7, 20 mL 3000 ppm MB (Co), (pH 7.25)] and (b) Van't Hoff plot. | ||
3.9. Adsorption of MB in the presence of NaCl
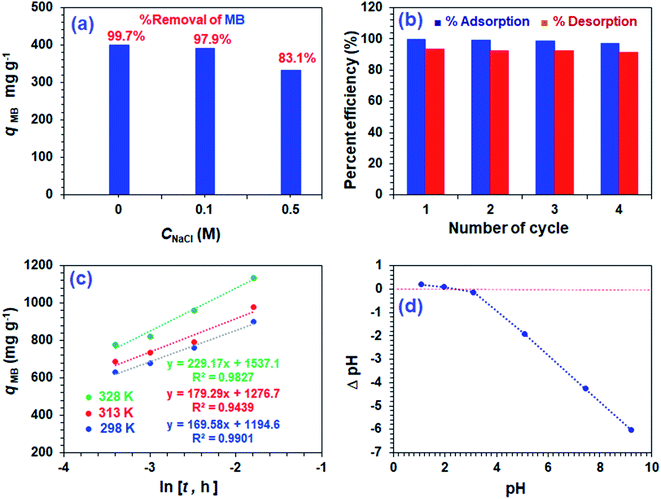
Fig. 7a displays the effect of NaCl on the adsorptive MB removal from its 1000 ppm solutions. The industrial effluents containing NaCl may affect the efficacy of the adsorption of MB. It is gratifying to note that the respective percent removal in 0, 0.1, and 0.5 M NaCl was found to be 99.7, 97.9, and 83.1%, thereby confirming no significant adverse effects on the MB removal process by CPZA 7.The presence of 2300 ppm Na+ (0.1 M) and 11![[thin space (1/6-em)]](https://www.rsc.org/images/entities/char_2009.gif) 500 ppm Na+ (0.5 M) ions are unable to compete effectively with the 1000 ppm of cationic MB for adsorption onto the resin. Thus electronic interactions between the electron-donor CO2− ligands and electron-acceptor cationic aromatic rings of MB constituting a chemisorption process are thermodynamically more favorable than the Na+–CPZA 7 electrostatic attractions.28,29
500 ppm Na+ (0.5 M) ions are unable to compete effectively with the 1000 ppm of cationic MB for adsorption onto the resin. Thus electronic interactions between the electron-donor CO2− ligands and electron-acceptor cationic aromatic rings of MB constituting a chemisorption process are thermodynamically more favorable than the Na+–CPZA 7 electrostatic attractions.28,29
3.10. Sorbent recycling
For the regeneration and reuse in several cycles, the CPZA 7 has achieved excellent efficacies of ≈92–99% (Fig. 7b). The presence of numerous CO2H, NH+ makes it a pH-responsive resin, thereby providing the latitude of 7![[left over right harpoons]](https://www.rsc.org/images/entities/char_21cb.gif) 8 equilibrations in the presence of HCl or NaOH. The absence of labile motifs like ester, amide, etc., makes it a chemically robust resin.
8 equilibrations in the presence of HCl or NaOH. The absence of labile motifs like ester, amide, etc., makes it a chemically robust resin.
3.11. Mechanism of adsorption
The kinetic adsorption data are fitted well with the Elovich model (eqn (13)), thereby suggesting the process as chemisorption (Fig. 7c).40 The α and β values of 1.94 × 10⁵ mg g−1 h−1 and 0.00590 g mg−1 at 298 K, respectively, indicate the irreversible nature of the adsorption process because of a very high rate of adsorption (α) and low rate of desorption (β).33 While endothermic adsorption suggests a chemisorption process, the exothermic ΔH° of −23.8 kJ mol−1 (Table 3) and its magnitude may suggest the physi- and chemi-sorption process.41 The ΔG° value of −22.8 kJ mol−1 suggests the process may involve both monolayer adsorption (chemisorption) and multilayer adsorption (physisorption).42 Formation of multilayer dye molecule may account for the ultra-high adsorption capacity, qMB.43
 | (13) |
The pH drift method44 to determine pH at the point of zero charge (pH PZC) utilized a series of 0.1 M NaNO3 (10 mL) solutions in CO2-free deionized water at various initial pH values adjusted using 0.1 M NaOH or 0.1 M HCl. After adding CPZA 7 (50 mg) and stirring at 298 K for 24 h, the final pHs were measured. The difference of initial and final pH, i.e., ΔpH plotted against the initial pH plot, revealed a pH value of 2.4 as the pH PZC, representing the point where ΔpH equals zero (Fig. 7d). The pH of 7.25 used for the MB removal, being >2.4, would therefore be negatively charged to facilitate chemical and/or physical adsorption of cationic MB. The adsorbed MB cannot be dislodged from the loaded resin by washing with water or ethanol, suggesting that MB is attached to the resin with a stronger force imparted by chemisorption. The desorption of the cationic dye MB bye HCl, which imparts cationic charges on the resin, is associated with the electrostatic repulsion among the positively charged species.
3.12. Comparative qm for MB of some recent adsorbents
The qm values of some recent sorbents used for MB removal are compared with that of the current resin in Table 4, which reveals the notable efficacy of the current resin CPZA 7. The synthesis of current resin can be scaled up easily using inexpensive starting materials, which makes it an attractive sorbent for the mitigation of MB in industrial wastewater.| Adsorbents | qm (mg g−1) | Ref. |
|---|---|---|
| Nickel-based MOF | 694 | 45 |
| Cellulosic olive stones | 588 | 46 |
| Nickel alginate/graphene oxide aerogel | 537 | 47 |
| Polymeric multi-layered alginate-based | 522 | 48 |
| Magnetic nano-hybrid | 714 | 49 |
| Graphene functionalized with polyamine | 741 | 50 |
| Graphene/β-cyclodextrin | 1134 | 51 |
| Inorganic–organic hybrid nanowire networks | 1188 | 52 |
| Attapulgite/chitosan | 1873 | 53 |
| Hydrogel based on poly(acrylic acid) | 2100 | 54 |
| Resin containing aminocarboxylate and maleic acid | 2101 | 39 |
| Titanate nanosheets | 3937 | 43 |
| Aminophosphonate/succinate resin | 2445 | 55 |
| Resin with aspartate/succinate motifs | 2609 | (Current work) |
3.13. Removal of anionic dyes (methyl orange and Eriochrome black T)
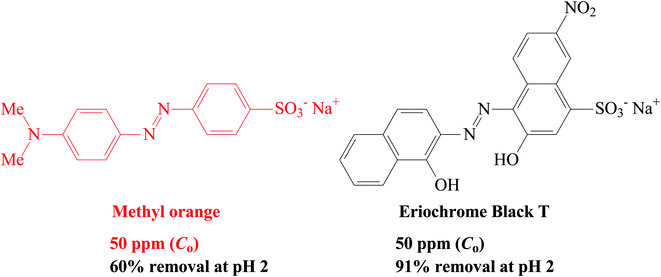
CPZA 7 has been very effective in the trapping of cationic dye MB. The efficacy of 7 in removal of anionic dyes like methyl orange (MO) and Erichrome black T (EBT) has also been examined briefly (Scheme 4). A mixture of each dye (50 ppm, 20 mL) and CPZA 7 (50 mg) was stirred for 6 h at 298 K. Analyses of the supernatants by UV-vis spectroscopy (after adjusting to pH 5.11 for MO and 5.0 for EBT) revealed the removal of 60, 15 and 9.7% MO and 91, 71 and 57% EBT at pH 2, 4, and 6, respectively. The blank MO solutions in the range 1–3 ppm at pH 5.11 and EBT solutions in the range 3–7 ppm at pH 5.0 were used to construct the calibration curves (λmax 464 nm for MO and 544 nm for EBT). Decreasing pH thus increases the adsorptive removal of the dyes. At pH 2, all the CO2− in CPZA 7 are expected to be protonated to CO2H, thereby allowing the cationic NH+ motifs in the sorbent to impart electrostatic interactions to bind the anionic SO3− groups. Note that SO3H groups having a pKa of −2.1 is expected to be dissociated to SO3− even at pH 2. Some recent works described the removal of EBT using zinc oxide nanoparticles56 and magnetic NiFe2O4 nanoparticles,57 achieving the best removal of EBT at about 87 and 91%, respectively.3.14. Adsorption of Pb(II)
Film diffusion dominates the adsorption process as revealed by large intercepts (xi) (i.e., adsorptions at time zero) values of 72.0, 73.5, and 74.5 mg g−1 at the respective temperatures of 298, 313, and 328 K (Fig. S1d†). Using xi and qe, exp from Table S1,† the Ri values as calculated using eqn (4) were found to be 0.094, 0.0755, and 0.0688 at the respective temperatures of 298, 313, and 328 K, with the corresponding instantaneous adsorption, thus accounting for 90.6, 92.5 and 93%. The resistance to the external diffusion thus decreases with the increase of temperatures, as suggested by increasing xi values.33 The kinetic data for Pb(II) adsorption fitted well with the Elovich model (eqn (13)), thereby suggesting the process as chemisorption (Fig. S2b†).40 The high adsorption rate (α) of ≈1.08 × 1033 mg g−1 h−1 along with the slower rate of desorption (β) of ≈0.985 g mg−1, point towards the irreversible nature of the chemisorption.27
As discussed in the case of MB (vide supra), the adsorption data at the three different temperatures were fitted into Langmuir's nonlinear isotherm (Fig. S4†) to find out the values of KL and dimensionless equilibrium constants  To do so, [MB]° in eqn (11) was replaced with [Pb]°, and MW for Pb was taken as 207.2 g mol−1. The RAdj2 values indicated the excellent fitting. The qm values were found to be 872.6, 914.9, and 948.4 mg g−1 at the respective temperatures of 298, 313, and 328 K (Fig. S4†).
The plot as per Van't Hoff eqn (12) (Fig. S5b†) using  values revealed the endothermic nature of Pb(II) adsorption with a relatively high ΔH°[(+) 27.8 kJ mol−1] (Table S2†), which indicates the process as chemisorption.58 The ΔG° values, being negative, favors the adsorption process. As a consequence of the endothermic process, an increase in temperatures leads to higher adsorption capacities, qPb (Fig. S5a†).
![[thin space (1/6-em)]](https://www.rsc.org/images/entities/char_2009.gif) 000 ppb Pb(II), which was reduced to 147 ppb (i.e., 98.5% removal). Moreover, the concentration of other metal contaminants was also reduced. It is worth mentioning that the treatment of a mixture containing 10
000 ppb Pb(II), which was reduced to 147 ppb (i.e., 98.5% removal). Moreover, the concentration of other metal contaminants was also reduced. It is worth mentioning that the treatment of a mixture containing 10![[thin space (1/6-em)]](https://www.rsc.org/images/entities/char_2009.gif) 000 ppb each of MB and Pb(II) with PZCA 7 led to the more effective removal of MB (97%) than Pb(II) (69.6%).
000 ppb each of MB and Pb(II) with PZCA 7 led to the more effective removal of MB (97%) than Pb(II) (69.6%).
| Metal | Original wastewater (μg L−1) | After treatment with CAPE 8a (μg L−1) | |
|---|---|---|---|
| Original wastewater | Original wastewater spiked with Pb2+ (10![[thin space (1/6-em)]](https://www.rsc.org/images/entities/char_2009.gif) 000 μg L−1) 000 μg L−1) |
||
| a Wastewater (20 mL, pH 5.5) stirred with 50 mg CAPE 8 for 6 h at 298 K.b 20 mL solution stirred with 50 mg of CPZA 7 (pH 6.0) at 298 K for 6 h. | |||
| Al | 25.4 | 5.31 | 6.81 |
| Zn | 26.9 | 0.72 | 0.19 |
| Fe | 32.5 | 8.41 | 12.5 |
| Cr | 2.89 | 0.59 | 1.07 |
| Ni | 22.3 | 2.11 | 2.33 |
| Co | 1.48 | 0.32 | 0.34 |
| As | 0.16 | 0.06 | 0.08 |
| Cu | 25.7 | 4.83 | 5.67 |
| Sn | 3.56 | 1.27 | 1.45 |
| Cd | 0.63 | 0.29 | 0.32 |
| Sn | 5.01 | 1.02 | 1.12 |
| Hg | 1.58 | 0.45 | 0.32 |
| Mn | 10.4 | 0.24 | 0.07 |
| Pb | 3.78 | 0.98 | 147 |
Solutionb containing 10![[thin space (1/6-em)]](https://www.rsc.org/images/entities/char_2009.gif) 000 μg L−1 each of MB and Pb(II) stirred with PZCA 7 000 μg L−1 each of MB and Pb(II) stirred with PZCA 7 |
|||
| MB | 10![[thin space (1/6-em)]](https://www.rsc.org/images/entities/char_2009.gif) 000 000 |
310 | |
| Pb | 10![[thin space (1/6-em)]](https://www.rsc.org/images/entities/char_2009.gif) 000 000 |
3036 | |
3.15. SEM and EDX analysis
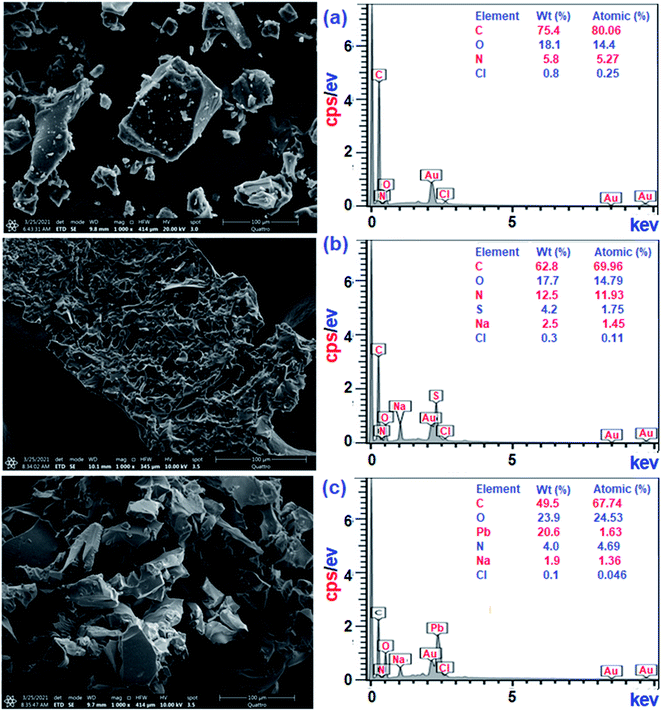
Treatment of CPZA 7 (100 mg) at 298 K with 40 mL of 1000 ppm MB (pH 7.25, 2 h) and 40 mL of 100 ppm Pb(II) (pH 6.0, 1 h) afforded resins loaded with MB and Pb(II), respectively. The sputter-coated nascent and loaded CPZA 7 with a gold film were scanned to obtain their SEM images and EDX spectra, shown in Fig. 8. Upon adsorption, the morphology of the loaded resins was changed (Fig. 8b and c) compared to unloaded CPZA 7 (Fig. 8a). The presence of S and Pb confirms their adsorptions onto the resin. Noted that the C![[double bond, length as m-dash]](https://www.rsc.org/images/entities/char_e001.gif) O vibrations for the Pb(II)-loaded resin are present as minor bands at 1724 and 1641 cm−1, while the strong band shifted to 1550 cm−1 indicates the formation of Pb(II) complex with CO2− groups (Fig. 3e).59
O vibrations for the Pb(II)-loaded resin are present as minor bands at 1724 and 1641 cm−1, while the strong band shifted to 1550 cm−1 indicates the formation of Pb(II) complex with CO2− groups (Fig. 3e).59
3.16. Pb(II) adsorption: comparative qm of several recent sorbents
The qm values of some recent sorbents used for Pb(II) removal are compared with that of the current resin in Table 6, which reveals the excellent efficacy of CPZA 7.| Adsorbents | qm (mg g−1) | Ref. |
|---|---|---|
| Starch-based ZnO nanocomposite | 256 | 60 |
| Chitosan/lignosulfonate adsorbent | 525 | 61 |
| Polypyrrole-iron oxide-seaweed nanocomposite | 333 | 62 |
| Polyvinyl alcohol phosphate ester super-adsorbents | 559 | 63 |
| Bentonite modified chitosan–cellulose | 256 | 64 |
| Treated sodium alginate | 221 | 65 |
| Naphthalene sulfonic acid doped polyaniline nickel composite nanotubes | 415 | 66 |
| Nitrogen-doped carboxylated porous carbon | 721 | 67 |
| Amido-amine derivative of alginic acid | 556 | 68 |
| Resin with aspartate/succinate motifs | 873 | (Current work) |
4. Conclusions
Monomer 5 containing residue of aspartic acid [(CH2![[double bond, length as m-dash]](https://www.rsc.org/images/entities/char_e001.gif) CHCH2)2NH+CH(CO2H)CH2CO2H Cl−] underwent TBHP-initiated alternate copolymerization with maleic acid 6 in the presence of cross-linker tetraallylhexane-1,6-diamine dihydrochloride [(CH2
CHCH2)2NH+CH(CO2H)CH2CO2H Cl−] underwent TBHP-initiated alternate copolymerization with maleic acid 6 in the presence of cross-linker tetraallylhexane-1,6-diamine dihydrochloride [(CH2![[double bond, length as m-dash]](https://www.rsc.org/images/entities/char_e001.gif) CHCH2)2NH+(CH2)6NH+ (CH2
CHCH2)2NH+(CH2)6NH+ (CH2![[double bond, length as m-dash]](https://www.rsc.org/images/entities/char_e001.gif) CHCH2)2 2Cl−] 4 to afford a new pH-responsive cross-linked chelating ion-exchange resin CPZA 7 in excellent yield (87%). The resin containing an abundant CO2− and chelating motifs of succinate (–CHCO2−–CHCO2−) and R2NCHCO2− has been turned out to be a super-adsorbent for the removal of cationic MB and Pb(II) with qmax of 2609 and 872.6 mg g−1, respectively, at 298 K. Both MB and Pb(II)-uptake was found to be very fast; obeying second-order kinetics, the resin accounted for 97.7% removal of MB within 15 min at 313 K and 94% Pb(II) removal within 1 min. The removal data for MB and Pb(II) fitted Elovich kinetic model, thereby supporting a chemisorption process. The thermodynamic parameter ΔH°, extracted from nonlinear Langmuir adsorption isotherms, was found to be (−) 23.8 kJ mol−1 (exothermic) and (+) 27.8 kJ mol−1 (endothermic) for the respective adsorptions of MB and Pb(II). The adsorption efficiency of CPZA 7 remained stable for over 4 cycles of adsorption/desorption involving MB and Pb(II).
CHCH2)2 2Cl−] 4 to afford a new pH-responsive cross-linked chelating ion-exchange resin CPZA 7 in excellent yield (87%). The resin containing an abundant CO2− and chelating motifs of succinate (–CHCO2−–CHCO2−) and R2NCHCO2− has been turned out to be a super-adsorbent for the removal of cationic MB and Pb(II) with qmax of 2609 and 872.6 mg g−1, respectively, at 298 K. Both MB and Pb(II)-uptake was found to be very fast; obeying second-order kinetics, the resin accounted for 97.7% removal of MB within 15 min at 313 K and 94% Pb(II) removal within 1 min. The removal data for MB and Pb(II) fitted Elovich kinetic model, thereby supporting a chemisorption process. The thermodynamic parameter ΔH°, extracted from nonlinear Langmuir adsorption isotherms, was found to be (−) 23.8 kJ mol−1 (exothermic) and (+) 27.8 kJ mol−1 (endothermic) for the respective adsorptions of MB and Pb(II). The adsorption efficiency of CPZA 7 remained stable for over 4 cycles of adsorption/desorption involving MB and Pb(II).
CPZA 7 was also found to trap anionic dyes; it removed 60% MO and 91% EBT from their 50 ppm solutions at pH 2.
CPZA 7 performed much better than many recently reported sorbents to remove MB and Pb(II). The presence of NaCl (0.1–0.5 M) did not have any significant adverse effect on the removal of MB. CPZA 7 was found to be effective in reducing priority metal contaminants (like Cr, Hg, Pb) in industrial wastewater to sub-ppb levels. The resin also performed well for the removal of MB and Pb(II) simultaneously from their solution. The synthesis of the resin can be easily scaled up from inexpensive starting materials; its outstanding performances pave the way for potential application in wastewater treatment.
Conflicts of interest
There are no conflicts to declare.Acknowledgements
The author(s) would like to acknowledge the facilities and financial assistance provided by King Fahd University of Petroleum & Minerals (KFUPM), Saudi Arabia, and the Deanship of Scientific Research (KFUPM) under Project Number DUP19103 for “Distinguished University Professor Award” are gratefully acknowledged.References
- I. Tan, B. Hameed and A. Ahmad, Chem. Eng. J., 2007, 127, 111–119 CrossRef CAS.
- K. Mohanty, J. T. Naidu, B. C. Meikap and M. N. Biswas, Ind. Eng. Chem. Res., 2006, 45, 5165–5171 CrossRef CAS.
- G. Crini, Bioresour. Technol., 2006, 97, 1061–1085 CrossRef CAS PubMed.
- T. Akar, T. A. Demir, I. Kiran, A. Özcan, A. S. Özcan and S. Tunali, J. Chem. Technol. Biotechnol., 2006, 81, 1100–1106 CrossRef CAS.
- C. A. P. Almeida, N. A. Debacher, A. J. Downs, L. Cottet and C. A. D. Mello, J. Colloid Interface Sci., 2009, 332, 46–53 CrossRef CAS PubMed.
- S. Preethi, A. Sivasamy, S. Sivanesan, V. Ramamurthi and G. Swaminathan, Ind. Eng. Chem. Res., 2006, 45, 7627–7632 CrossRef CAS.
- L. Ai, C. Zhang and Z. Chen, J. Hazard. Mater., 2011, 192, 1515–1524 CrossRef CAS PubMed.
- A. N. Fernandes, C. A. P. Almeida, C. T. B. Menezes, N. A. Debacher and M. M. D. Sierra, J. Hazard. Mater., 2007, 144, 412–419 CrossRef CAS PubMed.
- Ministry of Health of P. R. China. Standards for drinking water quality (GB 5749-2006), https://www.aqsiq.net/pdf/China_GB_5749-2006_Standards_for_Drinking_Water_Quality.pdf2006, 2006, accessed 27 September 2021 Search PubMed.
- U. S. Environmental Protection Agency, National primary drinking water regulations (EPA 816-F-09-004), https://www.nrc.gov/docs/ML1307/ML13078A040.pdf, 2009, accessed 10 September 2021 Search PubMed.
- S. Alexandratos, Ind. Eng. Chem. Res., 2009, 48, 388–398 CrossRef CAS.
- M. T. Yagub, T. K. Sen, S. Afroze and H. M. Ang, Adv. Colloid Interface, 2014, 209, 172–184 CrossRef CAS PubMed.
- H. Deng, L. Yang, G. H. Tao and J. L. Dai, J. Hazard. Mater., 2009, 166, 1514–1521 CrossRef CAS PubMed.
- O. Hamdaoui and J. Hazard, Mater, 2006, 135, 264–273 CrossRef CAS PubMed.
- M. Rafatullah, O. Sulaiman, R. Hashim and A. Ahmad, J. Hazard. Mater., 2010, 177, 70–80 CrossRef CAS PubMed.
- G. B. Butler, Cyclopolymerization and cyclocopolymerization, Marcel Dekker, New York, 1st edn, 1992 Search PubMed.
- G. B. Butler, J. Polym. Sci. A Polym. Chem., 2000, 38, 3451–3461 CrossRef CAS.
- I. Y. Yaagoob, H. A. Al-Muallem and S. A. Ali, RSC Adv., 2017, 7, 31641–31653 RSC.
- EPA Method 6020A (SW-846), Inductively Coupled Plasma-Mass Spectrometry, Revision 1, https://19january2017snapshot.epa.gov/homeland-security-research/epa-method-6020a-sw-846-inductively-coupled-plasma-mass-spectrometry_.html, 1998, accessed 12 October 2021 Search PubMed.
- Z. A. Jamiu, H. A. Al-Muallem and S. A. Ali, React. Funct. Polym., 2015, 93, 120–129 CrossRef CAS.
- S. A. Ali and M. T. Saeed, Polymer, 2001, 42, 2785–2794 CrossRef CAS.
- R. Kunin, E. A. Meitzner, J. A. Oline, S. A. Fisher and N. Frisch, Ind. Eng. Chem. Prod. Res. Dev., 1962, 1, 140–144 CAS.
- F. Rullens, M. Devillers and A. Laschewsky, Macromol. Chem. Phys., 2004, 205, 1155–1166 CrossRef CAS.
- M. Hahn, W. Jaeger, R. Schmolke and J. Behnisch, Acta Polym., 1990, 41, 107–112 CrossRef CAS.
- H. A. Al-Muallem, M. I. M. Wazeer and S. A. Ali, Polymer, 2002, 43, 4285–4295 CrossRef CAS.
- S. Pahari, L. Sun and E. Alexov, Database, 2019, 2019, 1–7 CrossRef PubMed.
- A. Ramesh, H. Hasegawa, T. Maki and K. Ueda, Sep. Purif. Technol., 2007, 56, 90–100 CrossRef CAS.
- L. Liu, S. Fan and Y. Li, Int. J. Environ. Res. Public Health, 2018, 15, 1321–1336 CrossRef PubMed.
- V. P. Dinh, T. D. T. Huynh, H. M. Le, V. D. Nguyen, V. A. Dao, N. Q. Hung, L. A. Tuyen, S. Lee, J. Yi, T. D. Nguyen and L. V. Tan, RSC Adv., 2019, 9, 25847–25860 RSC.
- F. C. Wu, R. L. Tseng and R. S. Juang, Chem. Eng. J., 2009, 153, 1–8 CrossRef CAS.
- D. Kavitha and C. Namasivayam, Bioresour. Technol., 2007, 98, 14–21 CrossRef CAS PubMed.
- H. K. Boparai, M. Joseph and D. M. Carroll, J. Hazard. Mater., 2011, 186, 458–465 CrossRef CAS PubMed.
- K. C. Bedin, A. C. Martins, A. L. Cazetta, O. Pezoti and V. C. Almeida, Chem. Eng. J., 2016, 286, 476–484 CrossRef CAS.
- J. F. Pearson and M. A. Slifkin, Spectrochim. Acta, Part A, 1972, 28, 2403–2417 CrossRef CAS.
- L. Xiong, Y. Yang, J. Mai, W. Sun, C. Zhang, D. Wei, Q. Chen and J. Ni, Chem. Eng. J., 2010, 136, 313–320 CrossRef.
- N. Goyal, S. Barman and V. K. Bulasara, Micropor. Mesopor. Mat., 2018, 259, 184–194 CrossRef CAS.
- E. C. Lima, M. A. Adebayo and F. M. Machado, Chapter 3-Kinetic and Equilibrium Models of Adsorption. in Carbon Nanomaterials as Adsorbents for Environmental and Biological Applications, ed. C. P. Bergmann and F. M. Machado, Springer, 2015, pp. 33–69 Search PubMed.
- E. C. Lima, A. H. Bandegharaei, J. C. M. Piraján and I. Anastopoulos, J. Mol. Liq., 2019, 273, 425–434 CrossRef CAS.
- S. A. Ali, I. Y. Yaagoob, M. A. J. Mazumder and H. A. Al-Muallem, J. Hazard. Mater., 2019, 369, 642–654 CrossRef CAS PubMed.
- J. S. Piccin, G. L. Dotto, M. L. Vieira and L. A. Pinto, J. Chem. Eng. Data, 2011, 56(10), 3759–3765 CrossRef CAS.
- Y. Xia, Q. Yao, W. Zhang, Y. Zhang and M. Zhao, Arab. J. Chem., 2019, 12, 2448–2456 CrossRef CAS.
- F. A. Arias, M. Guevara, T. Tene, P. Angamarca, R. Molina, A. Valarezo, O. Salguero, C. V. Gomez, M. Arias and L. S. Caputi, J. Nanomater., 2020, 10, 681–698 CrossRef CAS PubMed.
- H. Yuan, S. Ma, X. Wang, H. Long, X. Zhao, D. Yang, W. H. Lo and Y. H. Tsang, RSC Adv., 2019, 9, 5891–5894 RSC.
- T. Mahmood, M. T. Saddique, A. Naeem, P. Westerhoff, S. Mustafa and A. Alum, Ind. Eng. Chem. Res., 2011, 50, 10017–10023 CrossRef CAS.
- Y. Xie, B. Yan, H. Xu, J. Chen, Q. Liu, Y. Deng and H. Zeng, ACS Appl. Mater. Interfaces, 2014, 6, 8845–8852 CrossRef CAS PubMed.
- M. A. Al-Ghouti and R. S. Al-Absi, Sci. Rep., 2020, 10, 15928 CrossRef CAS PubMed.
- Y. Wang, J. Pan, Y. Li, P. Zhang, M. Li, H. Zheng, X. Zhang, H. Li and Q. Du, J. Mater. Res. Technol., 2020, 9, 12443–12460 CrossRef CAS.
- C. Ammar, F. M. Alminderej, Y. EL-Ghoul, M. Jabli and M. Shafiquzzaman, Polymers, 2021, 13, 411 CrossRef CAS PubMed.
- X. Wan, Y. Zhan, Z. Zeng and Y. He, Chem. Eng. J., 2017, 330, 491–504 CrossRef CAS.
- L. Hu, Z. Yang, L. Cui, Y. Li, H. H. Ngo, Y. Wang, Q. Wei, H. Ma, L. Yan and B. Du, Chem. Eng. J., 2016, 287, 545–556 CrossRef CAS.
- M. H. Beyki, F. Shemirania, J. Malakootikhah, S. Minaeian and R. Khani, React. Funct. Polym., 2018, 125, 108–117 CrossRef CAS.
- S. Zhang, H. Yang, H. Huang, H. Gao, X. Wang, R. Cao, J. Li, X. Xu and X. Wang, J. Mater. Chem. A, 2017, 5, 15913–15922 RSC.
- L. Wang, J. Zhang and A. Wang, Desalination, 2011, 266, 33–39 CrossRef CAS.
- X. S. Hu, R. Lianga and S. G. Guoxing, J. Mater. Chem. A, 2018, 6, 17612–17624 RSC.
- S. A. Mubarak, S. A. Ali, I. Y. Yaagoob and M. A. J. Mazumder, ACS Omega, 2020, 5, 27833–27845 CrossRef CAS PubMed.
- Y. Kaur, T. Jasrotia, R. Kumar, G. R. Chaudhary and S. Chaudhary, Chemosphere, 2021, 278, 130366 CrossRef CAS PubMed.
- F. Moeinpour, A. Alimoradi and M. Kazemi, J. Environ. Health Sci. Eng., 2014, 12, 112 CrossRef PubMed.
- P. S. Thue, A. C. Sophia, E. C. Lima, A. G. N. Wamba, W. S. de Alencar, G. S. dos Reis, F. S. Rodembusch and S. L. P. Dias, J. Clean Prod., 2018, 171, 30–44 CrossRef CAS.
- M. G. MacDonald, M. R. Palmer, M. R. Suchomel and B. H. Berrie, ACS Omega, 2016, 1, 344–350 CrossRef CAS PubMed.
- M. Naushad, T. Ahamad, K. M. Al-Sheetan and J. Hazard, Mater., 2021, 407, 124816 CAS.
- F. Zhang, B. Wang, P. Jie, J. Zhu and F. Cheng, Polymer, 2021, 228, 123878 CrossRef CAS.
- G. Sarojini, S. Venkateshbabu and M. Rajasimman, Chemosphere, 2021, 278, 130400 CrossRef CAS PubMed.
- J. Sun, G. Sun, X. Zhao, X. Liu, H. Zhao, C. Xu, L. Yan, X. Jiang and Y. Cui, Chemosphere, 2021, 282, 131032 CrossRef CAS PubMed.
- Y. Chen, Z. Nie, J. Gao, J. Wang and M. Cai, J. Environ. Chem. Eng., 2021, 9, 105755 CrossRef CAS.
- A. Hashem, C. O. Aniagor, M. F. Nasr and A. Abou-Okeil, Int. J. Biol. Macromol., 2021, 176, 201–216 CrossRef CAS PubMed.
- M. Bhaumik, A. Maity and H. G. Brink, Chem. Eng. J., 2021, 417, 127910 CrossRef CAS.
- A. M. Bakry, F. S. Awad, J. A. Bobb and M. S. El-Shall, ACS Omega, 2020, 5, 33090–33100 CrossRef CAS PubMed.
- U. Vaid, S. Mittal, J. N. Babu and R. Kumar, Int. J. Biol. Macromol., 2020, 147, 499–512 CrossRef CAS PubMed.
Footnote |
| † Electronic supplementary information (ESI) available. See DOI: 10.1039/d1ra09234k |
| This journal is © The Royal Society of Chemistry 2022 |

