 Open Access Article
Molten salt synthesis of carbon-supported Pt–rare earth metal nanoalloy catalysts for oxygen reduction reaction†
Yulin Jianga,
Tao Fu*b,
Jiaxiang Liuc,
Jinbao Zhao *ac,
Bing Libd and
Zhenjie Chena
aState Key Laboratory of Physical Chemistry of Solid Surfaces, Collaborative Innovation Centre of Chemistry for Energy Materials, State-Province Joint Engineering Laboratory of Power Source Technology for New Energy Vehicle, Engineering Research Center of Electrochemical Technology, Ministry of Education, College of Chemistry and Chemical Engineering, Xiamen University, Xiamen 361005, People's Republic of China. E-mail: jbzhao@xmu.edu.cn
bCollege of Chemistry and Material Science, Fujian Provincial Key Laboratory of Clean Energy Materials, Longyan University, Longyan 364012, People's Republic of China. E-mail: tfu@lyun.edu.cn
cCollege of Energy, Xiamen University, Xiamen 361005, People's Republic of China
dSchool of Mechanical and Power Engineering, East China University of Science and Technology, Shanghai 200237, People's Republic of China
First published on 9th February 2022
Abstract
The synthesis of nano-sized alloys of Pt and rare earth (RE) metal catalysts has been a huge challenge due to a significantly large standard reduction potential difference of Pt and RE metals and the high synthesis temperature. PtxY/C catalysts with an average particle size of around 21 nm, were synthesized by mixing K2PtCl4 with Y2O3 (a molar ratio of Pt![[thin space (1/6-em)]](https://www.rsc.org/images/entities/char_2009.gif) :
:![[thin space (1/6-em)]](https://www.rsc.org/images/entities/char_2009.gif) Y = 1
Y = 1![[thin space (1/6-em)]](https://www.rsc.org/images/entities/char_2009.gif) :
:![[thin space (1/6-em)]](https://www.rsc.org/images/entities/char_2009.gif) 1) with a carbon support in a molten LiCl–CaH2 system by a one-step molten salt synthesis method at 600 °C. The synthesis processes of the PtxY/C alloys are proposed as follows: Pt nanoparticles were first obtained by the reaction of K2PtCl4 and CaH2 at 210 °C, then Y ions were preferentially reduced on the Pt nanoparticle surface by the reduction of CaH2, followed by PtxY alloy formation in the molten LiCl–CaH2 system at 600 °C. Molten LiCl provides a strong reducing environment and lowers the formation temperature of alloys. Pt2Gd/C and Pt2La/C were also obtained with Gd2O3 and La2O3 as the starting raw materials, respectively by using the same process. When investigated as an electrocatalyst for the oxygen reduction reaction (ORR), the half-wave potentials of PtxRE/Cs are all more positive than that of commercial Pt/C catalyst (e.g., 0.905 V for PtxY/C while 0.880 V for JM Pt/C), and the nano-sized PtxY/C alloy shows higher electrocatalytic activity toward the ORR and preferable catalytic durability with respect to JM Pt/C catalysts. This facile synthesis method provides an effective strategy for the preparation of Pt–RE based multicomponent nanoalloys, especially in large-scale production.
1) with a carbon support in a molten LiCl–CaH2 system by a one-step molten salt synthesis method at 600 °C. The synthesis processes of the PtxY/C alloys are proposed as follows: Pt nanoparticles were first obtained by the reaction of K2PtCl4 and CaH2 at 210 °C, then Y ions were preferentially reduced on the Pt nanoparticle surface by the reduction of CaH2, followed by PtxY alloy formation in the molten LiCl–CaH2 system at 600 °C. Molten LiCl provides a strong reducing environment and lowers the formation temperature of alloys. Pt2Gd/C and Pt2La/C were also obtained with Gd2O3 and La2O3 as the starting raw materials, respectively by using the same process. When investigated as an electrocatalyst for the oxygen reduction reaction (ORR), the half-wave potentials of PtxRE/Cs are all more positive than that of commercial Pt/C catalyst (e.g., 0.905 V for PtxY/C while 0.880 V for JM Pt/C), and the nano-sized PtxY/C alloy shows higher electrocatalytic activity toward the ORR and preferable catalytic durability with respect to JM Pt/C catalysts. This facile synthesis method provides an effective strategy for the preparation of Pt–RE based multicomponent nanoalloys, especially in large-scale production.
1 Introduction
Nowadays proton exchange membrane fuel cells (PEMFCs), directly generating electrical energy through hydrogen oxidation at the anode and oxygen reduction reaction (ORR) at the cathode,1–3 have received extensive attention in renewable energy fields (e.g. fuel cell electric vehicles), due to their advantages of low pollution and high specific energy.4–9 Nevertheless, the high cost of PEMFCs still restricts their widespread commercialization in which platinum (Pt) catalysts used at both anode and cathode electrodes account for about 40% of the cost.10 In particular, the cathode requires about 9–10 times as much platinum as the anode because of its sluggish oxygen reduction reaction (ORR). Nowadays, many researchers have proposed many strategies to solve this problem, including morphology control, nanoparticles and Pt-based alloys.11–17Pt-based alloys that can adjust the electronic structure of Pt atoms, is one of the effective strategies to enhance the activity and stability with the reduced amount of Pt in many catalysis fields.18–20
In the past two decades, the Pt-late transition metals (LTMs, such as Fe, Ni, Co etc.) alloys have been widely studied21 and have remarkably improved the catalytic activities.22 However, the late transition metals are more likely to dissolve and dealloy in the acidic medium of PEMFCs over time23 due to the lower alloy formation energy between Pt and LTMs,24 which results in the decrease of activity and durability of the alloys. Therefore, selection of the Pt alloys with higher alloy formation energy is beneficial to resist dealloying and maintain high stability.25,26
More recently, Greeley and his coworkers predicted and demonstrated that the Pt-rare earth metal (RE) alloys showed a significant enhanced activity by using density functional theory (DFT) calculations and experiments.27 Subsequently, Sung Jong Yoo25,28 explained that the strong electronic synergetic interaction between Pt and RE atoms results in the d-band center of Pt downshift, which can reduce the adsorption strength of oxygenated species (*O, *OH, *OOH) and ultimately improve the activity. In addition, compressive strains in the particle surface will be generated in the alloy because the atomic radius of rare earth metals are larger than that of Pt, which can lower the adsorption of reaction intermediates at the Pt sites, and adjust the binding energy of oxygenated intermediates and boost ORR activity.25 The application of Pt–RE alloy catalysts can not only improve the catalytic activity of ORR, but also can reduce the loading of Pt.29
However, the chemical synthesis of Pt–RE alloys is very challenging because of the vast difference of standard reduction potentials between Pt and RE metals (e.g. +1.19 V for Pt2+/Pt, −2.37 V for Y3+/Y) and the high oxygen affinity of RE metal atoms.30 Moreover, synthesis of Pt–RE alloys usually needs high temperatures. For example, Pt5Ce alloy phase forms at 1529 °C according to the phase diagram.31 Hence such high temperature makes it more difficulty to synthesize nano-sized Pt–RE alloys. In the past decade, many efforts have been devoted to synthesize Pt–RE alloy catalysts by a variety of methods, however, only a few researches have been proved to obtain Pt–RE alloys in a strict reduction environment.29,30,32 Schwämmlein et al. prepared PtxY/C alloy via thermally reducing YCl3 with commercial Pt/C catalyst under the atmosphere of highly purified H2 at 1200 °C.33 Kanady et al. synthesized Pt3Y nanoalloy particles by heating the mixture of alkali metal tri-ethylborohydrides (MEt3BH, M = K, Na), PtCl4 and YCl3 to 200 °C in which MEt3BH was used as the reducing agent.34 Itahara et al. prepared Pt5Ce nanoparticles by using sodium vapor as the reducing agent at 600 °C.32 Recently, Kobayashi et al.35 reported the Pt2Y nanopowders with a reckoned particle size of 147.8 nm by molten salt synthesis (MSS), via mixing Pt with Y2O3 in a molten LiCl–CaH2 system under Ar atmosphere at 600 °C, in which CaH2 was used as the reducing agent.
Molten salts usually composed of inorganic salts, are non-toxic and harmless to the environment,36 which can well disperse the reactants and products, especially can lower the alloy formation temperature.37,38 Therefore, MSS can be regarded as a potential candidate for preparation of Pt–RE alloys.
Before MSS of Pt2Y nanopowders, Kobayashi et al.35 first prepared the precursor of Pt and Y2O3 mixture by using H2PtCl6 and Y2O3 as raw materials at 500 °C, which not only made the synthesis complicated, but also increased the particle size to more than 100 nm. So, here, we simplified the synthesis procedure in one-step by directly mixing the raw materials including K2PtCl4, Y2O3, Vulcan XC-72R, LiCl and CaH2, and then directly prepared Pt2Y by heating the mixture to 600 °C. The Vulcan XC-72R is used as the carbon support of Pt2Y alloy, which can significantly isolate the alloy particles and reduce the particle size to 21 nm. At the same time, we explored the synthesis mechanism of Pt2Y nanoalloys in LiCl–CaH2 molten salts and successfully prepared Pt2La and Pt2Gd alloys by using the same method. The obtained carbon-supported Pt–RE nanoalloys were used as the ORR catalysts, which showed more positive half-wave potentials than that of commercial Pt/C catalyst, e.g., 0.905 V for PtxY/C while 0.880 V for JM Pt/C.
2 Experimental
2.1 Main materials
The materials including lithium chloride (LiCl, ≥99%, AR, anhydrous), calcium hydride (CaH2, 95%, AR) and RE metal oxides (Y2O3, Gd2O3, La2O3) were all obtained from Aladdin Company. Potassium tetrachloroplatinate (K2PtCl4, Pt (wt%) ≥ 46%) was supplied by Tianjin Meisco Chemical, 5 wt% Nafion ionomer solution by Dupont and the carbon support Vulcan XC-72R by Cobalt. The commercial Pt/C catalysts were supplied by Johnson Matthey (20 wt% for Pt content, simplified as JM Pt/C). All the materials were used as received without for further treatment.2.2 Synthesis of carbon-supported Pt–RE nanoalloy particles (PtxRE/C)
PtxY/C was synthesized in molten LiCl–CaH2 system by one-step MSS method. First, a precursor was obtained by mixing K2PtCl4 with Y2O3 in a molar ratio of Pt![[thin space (1/6-em)]](https://www.rsc.org/images/entities/char_2009.gif) :
:![[thin space (1/6-em)]](https://www.rsc.org/images/entities/char_2009.gif) Y = 1
Y = 1![[thin space (1/6-em)]](https://www.rsc.org/images/entities/char_2009.gif) :
:![[thin space (1/6-em)]](https://www.rsc.org/images/entities/char_2009.gif) 1, in which the Y-rich ratio was used to ensure that all of the Pt salt were completely alloyed with RE. Next, a mixture was prepared by grounding the precursor with carbon support (Vulcan XC-72R), LiCl and CaH2 in a mortar with a weight ratio of precursor (including Vulcan XC-72R): LiCl
1, in which the Y-rich ratio was used to ensure that all of the Pt salt were completely alloyed with RE. Next, a mixture was prepared by grounding the precursor with carbon support (Vulcan XC-72R), LiCl and CaH2 in a mortar with a weight ratio of precursor (including Vulcan XC-72R): LiCl![[thin space (1/6-em)]](https://www.rsc.org/images/entities/char_2009.gif) :
:![[thin space (1/6-em)]](https://www.rsc.org/images/entities/char_2009.gif) CaH2 = 1
CaH2 = 1![[thin space (1/6-em)]](https://www.rsc.org/images/entities/char_2009.gif) :
:![[thin space (1/6-em)]](https://www.rsc.org/images/entities/char_2009.gif) 40
40![[thin space (1/6-em)]](https://www.rsc.org/images/entities/char_2009.gif) :
:![[thin space (1/6-em)]](https://www.rsc.org/images/entities/char_2009.gif) 10. Then the mixture was placed in a furnace to remove air for 1 hour at room temperature by purge with Ar, and heated to 600 °C at a heating rate of 5 °C min−1. Through holding 2 hours at 600 °C, the products was taken out by cooling off naturally to room temperature. The products including byproducts and excess reactants, such as Y2O3, CaH2, LiCl and CaO, etc. were leached by 1.0 M HNO3 solution, washed with Milli-Q water and separated by centrifugation (10
10. Then the mixture was placed in a furnace to remove air for 1 hour at room temperature by purge with Ar, and heated to 600 °C at a heating rate of 5 °C min−1. Through holding 2 hours at 600 °C, the products was taken out by cooling off naturally to room temperature. The products including byproducts and excess reactants, such as Y2O3, CaH2, LiCl and CaO, etc. were leached by 1.0 M HNO3 solution, washed with Milli-Q water and separated by centrifugation (10![[thin space (1/6-em)]](https://www.rsc.org/images/entities/char_2009.gif) 000 rpm for 5 minutes) for three times in sequence. Finally, PtxRE/C samples were obtained by freeze drying that contained around 23% Pt content according to ICP analysis.
000 rpm for 5 minutes) for three times in sequence. Finally, PtxRE/C samples were obtained by freeze drying that contained around 23% Pt content according to ICP analysis.
Pt2Gd/C and Pt2La/C are also prepared with Gd2O3 and La2O3 as raw materials, respectively by using the same process as above.
2.3 Physical characterizations
The crystal information of the samples was depicted by X-ray diffraction (XRD) method using the Mini Flex 600 X-ray diffractometer (Rigaku) with the radiation source of Cu Kα (λ = 0.15418 nm) with a scan rate of 5.0° min−1. The crystal structure and the morphology of the samples were acquired by transmission electron microscope (TEM) method using the F-30 HRTEM (Holland FEI Tecnai) at 300 kV. The elemental mappings were also performed by the F-30 HRTEM (Holland FEI Tecnai) equipped with the energy dispersive X-ray spectroscopy (EDX). The X-ray photoelectron spectroscopy (XPS) was applied to analyze the valence state of the elements in samples on X-ray photoelectron spectrometer (Thermo Fisherto, United State) with an Al Kα X-ray monochromator. The C 1s spectrum (284.6 eV) was used to calibrate the binding energy (BE). Inductively coupled plasma (ICP, NCS Testing Technology, Plasma1000) was carried out to examine the elemental content (Pt). In order to determine the synthesis mechanism, the reactants were analyzed using simultaneous thermal analysis (STA 449 F3 Jupiter) under an argon atmosphere with a heating rate of 5 °C min−1.2.4 Electrochemical measurements
Catalyst inks were prepared according to the follow steps. First, 2 mg of the catalysts or JM Pt/C were added to the solution composing of 990 μL ethanol and 10 μL of the 5 wt% Nafion ionomer solution to form a mixture. Subsequently, the mixture was dispersed by ultrasonic treatment for 3 hours to yield uniform catalyst suspension. Thereafter, aiming to form the catalyst thin film, the catalyst ink (10 μL) was cast to the polished rotating disk electrode (RDE, S = 0.196 cm−2, PINE Instrument) and dried naturally. The loading amounts of Pt on the electrode surface were around 20.41–23.47 μg cmPt−2.The electrochemical performance tests were carried out on the CHI730E bipotentiostat (Chenhua Instrument Corporation, Shanghai) at room temperature. The traditional three-electrode system was conducted to measure the ORR electrochemical performance, in which the catalyst ink coated in RDE, KCl-saturated Ag/AgCl electrode and a graphite electrode, were used as the working electrode (WE), reference electrode (RE) and counter electrode (CE), respectively. The electrolyte was 0.1 M HClO4 solution. All the potentials were normalized to the reversible hydrogen electrode (RHE) after the electrochemical tests according to the following equation:
| Evs. RHE = Evs. Ag/AgCl + 0.197 V + 0.059 × pH |
Cyclic voltammogram (CV) was first conducted between 0.00 V to 1.25 V (vs. RHE) with a scanning speed of 500 mV s−1 in N2-saturated 0.1 M HClO4. During CO-stripping cyclic voltammograms, constant potential of −15 mV (vs. RHE) was held for 12 minutes in 0.1 M HClO4 electrolyte saturated with CO and then cyclic voltammograms were measured in the potential range of 0–1.25 V with 50 mV s−1 in 0.1 M HClO4 electrolyte saturated with N2. Then linear scanning voltammetry (LSV) was conducted to characterize the ORR catalytic activity of samples under following conditions: sweep rate of 10 mV s−1, rotation rate of 1600 rpm and O2-saturated 0.1 M HClO4 solution.
The specific activity (SA) and mass activity (MA) of catalysts were figured out from the polarization curve obtained by LSV. The following Koutecký–Levich equation was applied to calculated the kinetic currents (ik), representing the intrinsic ORR activity:
3 Results and discussion
3.1 Structure characterizations
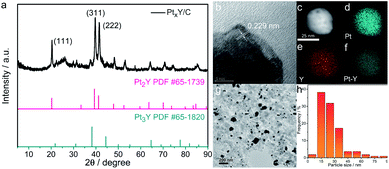
Fig. 1 displays the XRD spectra of the PtxY/C catalyst prepared by the MSS method. The main diffraction peaks are completely consistent with the reference pattern Pt2Y, in which the obvious peaks at 20°, 39° and 41° are indexed to the (111), (311) and (222) crystal planes of cubic Pt2Y, respectively. In addition, the small broaden peak between 20° and 30° is corresponding to the carbon support. It is worth noting that there are some additional peaks in the XRD spectra, which correspond to those of the Pt3Y reference pattern. The XRD results demonstrate the formation of Pt2Y and Pt3Y alloy phases, among which Pt2Y is the dominant phase.To further verify the formation of PtxY alloys, the high-resolution TEM (HRTEM) and the element mappings of PtxY have been provided in Fig. 1b–f. The lattice fringe distance of PtxY particles in Fig. 1b is about 0.229 nm, which corresponds to the interplanar distance of (311) crystal plane of Pt2Y. On the other hand, from the element mapping images of PtxY displayed in Fig. 1c–f, it is obvious that the Pt and Y elements were distributed in the nanoparticles homogeneously, demonstrating that Pt and Y metals are well alloyed. Besides, PtxY nanoalloy particles are well decorated on the carbon support as shown in Fig. 1g, and most of the particles possess a small particle size. Whereas, there are a few particles with larger particle sizes, which may be caused by the aggregation of the particles. According to the particle size statistics in Fig. 1h, the distribution of particle size is in the range of 9 nm to 90 nm, and most of the particle sizes are around 21 nm. In comparison, as shown in Fig. S1,† the average particle size of Pt in JM Pt/C catalyst is around 2 nm. Obviously, the synthesized PtxY nanoalloy particles are much larger than the Pt particles of JM Pt/C catalyst due to the high synthesis temperature.
XPS analysis was used to determine the electronic structure changes of Pt. Fig. 2a showed the Pt 4f core level peaks of the PtxY/C and JM Pt/C. The zerovalent metallic Pt (Pt0) peaks of JM Pt/C catalyst emerge at 74.8 and 71.4 eV correlating with the Bes of Pt 4f5/2 and Pt 4f7/2, respectively. Furthermore, the peaks at about 75.6 (Pt 4f5/2) and 72.3 eV (Pt 4f7/2) are on behalf of the Pt2+ species. For the PtxY/C sample, the Bes of 74.7 and 71.3 eV are assigned to Pt 4f5/2 and Pt 4f7/2, separately, corresponding to Pt0. Meanwhile, the peaks at the Bes of 75.8 eV (Pt 4f5/2) and 72.5 eV (Pt 4f7/2) stand for Pt2+ species. The Bes of Pt0 doublet of PtxY/C show a negative shift (about 0.1 eV) relative to JM Pt/C catalyst. This negative shift is ascribable to the change in surroundings around the Pt atoms produced by alloying Pt and Y,39,40 which changes the electronic structure of Pt. Partial hybridization of d–d band takes place when Pt is alloyed with lower electronegativity metals, which causes the charge to be transferred from the lower electronegativity metals (Y) to stronger one (Pt) through the metal bond.40 The d-band center of surface Pt shifts in the same direction as the surface core level,39,41,42 so when the Bes of surface Pt shift to the negative direction, the d-band center of Pt downshifts.39 The Pt 4f shift is a sign of PtxY alloy formation,40 which is in good agreement with the results of XRD and TEM analysis.
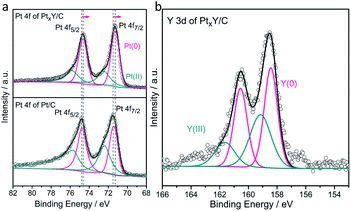 | ||
| Fig. 2 XPS spectra of (a) Pt 4f core levels for the PtxY/C prepared and the JM Pt/C catalysts and (b) Y 3d core levels for the PtxY/C prepared. | ||
The formation of PtxY alloys is also confirmed from Y 3d high-resolution XPS spectra, as shown in Fig. 2b. By deconvolving the peaks of Y 3d XPS spectra, the peak at Be. 158.4 eV and 160.5 eV close to Y0, indicating that the PtxY alloys are formed.43,44 Moreover, the other two peaks at 159.2 and 161.7 eV are represented Y2O3.34 It can be predicted that a small amount of Y2O3 will appear on the surface due to the high oxygen affinity of Y. This is different from XRD results, mainly because a small amount of Y2O3 on the surface is within the detection limit of XRD measurement, while XPS is surface sensitive.
3.2 Synthesis mechanism
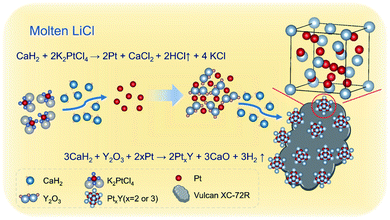
According to the differential scanning calorimetr (DSC) and thermogravimetric analysis (TG) curves of K2PtCl4 in Fig. 3a, the pure K2PtCl4 begins to melt at 370 °C and decomposes accompanied by decalescence and mass loss after heating to 600 °C. As excess CaH2 is mixed with K2PtCl4, the DSC and TG curves in Fig. 3b showed that Pt ions were reduced to metallic Pt at 210 °C in terms of the reaction (1), which also indicates a thermodynamical feasibility based on a negative Gibbs free energy of the reaction. In the temperature range from 210 °C to 600 °C, about 6% of the mass loss of the mixture is observed, which corresponds HCl volatilization and is close to the theoretical value of 8%.In addition, the TG curve shows an obviously downward trend at 600 °C, which corresponds to the decomposition of excess CaH2. Therefore, Pt was first formed by the reaction of K2PtCl4 and CaH2 at 210 °C during the synthesis progress of Pt–Y alloy. Afterwards Y ions were preferentially reduced on the Pt surface followed by PtxY alloys formation in the molten LiCl–CaH2 system.
As LiCl is absent in the MSS process of the alloys, only Pt metal is formed without any alloy peaks in the XRD patterns presented in Fig. S2.† This can be predicted according to the phase diagrams of Pt–RE alloys (e.g., Pt–Y, Fig. S3†), which shows that the synthesis temperature of Pt–Y alloy is above 1000 °C. Differently, after adding LiCl, Pt–Y alloy was successfully synthesized (Fig. 1a). This is probably due to the fact that molten LiCl–CaH2 provides a liquid and strong reaction environment for PtxY alloys formation, and lowers the formation temperature of the alloys. The products obtained by MSS after cooled without any treatments were composed of LiCl, CaCl2, CaH2, CaO and KCl, respectively, as shown in Fig. 3c. The intensity of these products is much higher than that of the Pt–Y alloy, resulting in the alloy phase not being observed. Through the analysis of these byproducts and the previous DSC results, we have summarized the synthesis mechanism and the typical synthesis scheme is descripted in Scheme 1. In this regard, the possible reactions are proposed as follows:
| K2PtCl4 + CaH2 = CaCl2 + 2Pt + 4KCl + 2HCl↑ | (1) |
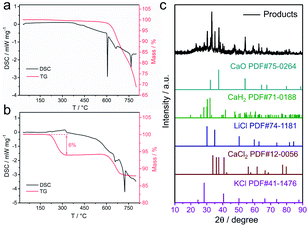 | ||
| Fig. 3 (a) DSC and TG curves for K2PtCl4, (b) DSC and TG curves for a mixture of CaH2 and K2PtCl4, (c) XRD pattern of the materials synthesized without LiCl. | ||
ΔG = −133.583 kcal mol−1 (200 °C)
| Y2O3 + 2Pt + 3CaH2 = 2PtxY + 3CaO + 3H2↑ | (2) |
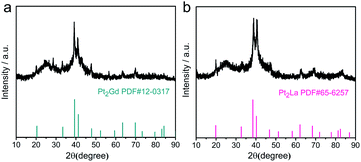
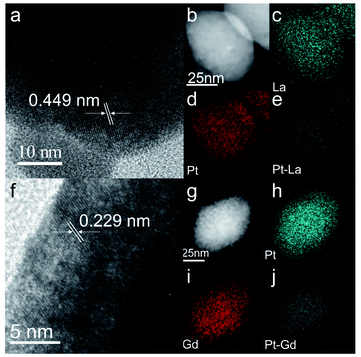
Further, Pt2Gd and Pt2La alloys were synthesized using the same method, according to the XRD results shown in Fig. 4. The HRTEM and the element mappings in Fig. 5 further verified the formation of Pt2La and Pt2Gd alloys. The lattice fringe distances (0.449 nm and 0.229) correspond to the interplanar distance of (111) crystal plane of Pt2La and (311) of Pt2Gd, respectively. Meanwhile, the element mapping images in Fig. 5b–e and g–j indicates that Pt, La and Gd are uniformly distributed in the particles. The above results prove that Pt2La and Pt2Gd alloys have been successfully synthesized.
3.3 Electrochemical properties
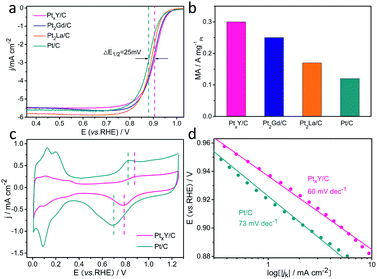
Aiming to assess the electrocatalytic properties toward ORR of the catalyst, the ORR polarization curves of these three materials synthesized (PtxY/C, Pt2Gd/C, and Pt2La/C) and JM Pt/C catalysts were measured in oxygen-saturated 0.1 M HClO4 electrolyte. The results are shown in Fig. 6a, showing that the half-wave potentials of the synthesized materials are all higher than that of JM Pt/C catalyst. Among them, the PtxY/C alloy has the highest half-wave potential (0.905 V), which is 25 mV higher than that of the JM Pt/C catalyst (0.88 V), indicating its superior ORR electrocatalytic activity. Furthermore, the half-wave potentials of Pt2Gd/C and Pt2La/C are 0.901 V and 0.89 V, which are positively shifted 21 mV and 10 mV compared with the JM Pt/C catalyst, respectively. Fig. 6b shows that the mass activities at 0.9 V (vs. RHE) of PtxY/C, Pt2Gd/C and Pt2La/C are 0.3, 0.25, and 0.17 A mgPt−1, which are 2.5 times, 2.08 times and 1.42 times as much as JM Pt/C catalysts (0.12 A mgPt−1), respectively. This corroborates the ORR activity enhancement of Pt–RE metal alloy catalysts. From the CV curves in Fig. 6c, both PtxY/C and JM Pt/C show nearly the same trend. On the other hand, as shown by the vertical line in Fig. 6c, the potentials of the oxidation peak and reduction peak of Pt in the PtxY/C catalyst shift to higher potentials with respect to JM Pt/C, implying the bonding strength between Pt and oxygenated intermediates is weakened24,45–47 that is associated with the downshift of d-band center of Pt. Under this circumstance, the weakened bonding could be beneficial to the desorption of oxygenated intermediates on the Pt site, thereby promoting the ORR progress and improving the activity.48,49 Furthermore, the shift of oxidation peak to a higher potential also illustrates that the adsorption strength between Pt and *O is weakened,50 which is a sign of enhanced ORR performance.24 The comparative CO-stripping voltammograms of PtxY/C and JM Pt/C catalyst are represented in Fig. S4.† Apparently, the onset potential and the CO stripping peak of PtxY/C shifts negatively, illustrating the reduced interaction of Pt–CO and the weaken bonding between Pt and CO.48 This is also correlated with the downshift of the d-band center of Pt,48,51 which coincides with the XPS results and the analysis of positive potential shift in Fig. 2a. Additionally, the negative shift of CO stripping peak proves that PtxY/C has excellent resistance to CO poisoning on the surface.52,53Fig. 6d presents the Tafel curves of PtxY/C and JM Pt/C catalyst. The Tafel slope of PtxY/C reveals a smaller value (60 mV dec−1) with respect to that of JM Pt/C catalyst (73 mV dec−1), demonstrating the minor charge transfer resistance and an improvement in ORR kinetics of PtxY/C. The improved performance of PtxY/C alloys can be put down to the electronic structure changes of Pt influenced by alloying Y with Pt. The d-band center downshift of Pt in PtxY/C can decrease the adsorption strength of reaction intermediates (*O, *OH, *OOH) during the ORR, thus enhance the activity of ORR. In brief, we can conclude that the incorporation of RE metal (e.g., Y) and the formation of the alloy between Pt and RE are conducive to enhance the ORR activity through these electrochemical tests.
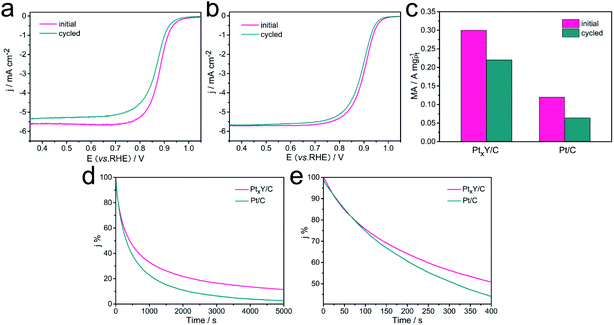
The durability of the catalysts significantly influences even dominates the practical applications of the catalysts. Therefore, the ADT was performed to assess the durability of the PtxY/C and the JM Pt/C catalysts, and the results were shown in Fig. 7a–c. Obviously, the LSV curves of PtxY/C and JM Pt/C catalysts both shifted toward to negative potential direction after 5000 potential cycles, indicating the catalytic activity of the catalysts displayed a decreased trend. PtxY/C reveals the negative half-wave potential shift of 10 mV with regard to a more obvious shift of 15 mV for the JM Pt/C catalyst, demonstrating the relatively high stability of PtxY/C. As shown in Fig. 7c, the initial MA value of PtxY/C is 0.26 A mgPt−1, which is 2.2 times that of JM Pt/C (0.12 A mgPt−1). After 5000 cycles, the MAs of PtxY/C catalyst (0.19 A mgPt−1) is about 3 times that of JM Pt/C (0.064 A mgPt−1). In addition, the PtxY/C shows only 27% loss of MA, while the MA of JM Pt/C catalyst decays by 47%. The results reveal that PtxY/C has significantly higher durability over JM Pt/C catalyst, which is attributed to the negative alloy formation energy of PtxY alloy, therefore leading to a high kinetic stability to prevent continuous dealloying.43 The nanoparticles of PtxY alloys are well-retained after ADT as seen in Fig. S5,† which is conducive to maintaining high performance toward ORR,54,55 thereby improving its durability. As for the JM Pt/C, the Pt particles have been agglomerated and grown up after durability test in Fig. S6.† Furthermore, the detachment of a few Pt particles from the support leads to the degradation of ORR performance. On the other hand, the XRD spectrum of PtxY/C after ADT shown in Fig. S7† indicates that the peaks still correspond to Pt2Y but the peak shape is not obvious. Compared the Pt 4f XPS spectra before and after ADT in Fig. S8,† the Pt 4f peaks shift to a lower binding energy, indicating an enhanced stress effect, which leads to enhanced adsorption of Pt and O atoms.55 The above results revealed that after ADT, PtxY/C shows a trend of lower catalytic performance.
Chronoamperometry (CA) is measured to study the electrochemical stability of the catalysts, and the results are shown in Fig. 7d–e. The PtxY/C and JM Pt/C have shown a sharp drop of the initial currents during the first 400 s, and then a slow drop of currents until 5000 s. Within the initial 100 s, the currents of the PtxY/C and JM Pt/C decrease in the same manner. As time goes by, PtxY/C has exhibited a slower decrease trend in current than JM Pt/C. It demonstrates that PtxY/C has shown better electrochemical stability than JM Pt/C, in good agreement with the ADT assessments. The improvement of durability may be due to the exceptional negative alloy formation energy in the Pt–Y alloy to some extent,43 which provides a higher kinetic stability and can resist continuous dealloying under PEMFC reaction conditions.
The electrochemical performance comparison of this material with Pt2Y and Pt3Y alloys recently reported by other researchers is summarized in Table S1.† In this work, the particle size of the obtained material is much larger than that in these literatures, but it still improves the ORR catalytic activity, indicating that the Pt–RE alloys have great potential in catalyzing ORR. The MA and SA are inferior to some previously reported materials, which may be related to the larger particle size of PtxY nanoalloy. Indeed, the MA and SA for PtxY/C are closely connected with the particle size of PtxY and the optimal particle size is approximately 8–9 nm.44 Most of the synthesized PtxY particles have larger particle diameters (>10 nm), which also leads to an insignificant improvement of the half-wave potential. Therefore, it is expected to improve the activity of the material by reducing the particle size.
4 Conclusions
In conclusion, it is the first time that the carbon-supported Pt–RE nanoalloys were successfully synthesized in one step by a simple MSS method, and the synthesis mechanism is discussed in this paper.PtxY/C catalysts with the average particle sizes of around 21 nm, was synthesized by mixing K2PtCl4 with Y2O3 (in a molar ratio of Pt![[thin space (1/6-em)]](https://www.rsc.org/images/entities/char_2009.gif) :
:![[thin space (1/6-em)]](https://www.rsc.org/images/entities/char_2009.gif) Y = 1
Y = 1![[thin space (1/6-em)]](https://www.rsc.org/images/entities/char_2009.gif) :
:![[thin space (1/6-em)]](https://www.rsc.org/images/entities/char_2009.gif) 1) with carbon support in molten LiCl–CaH2 system by one-step MSS method at 600 °C. Pt2Gd/C and Pt2La/C are also obtained with Gd2O3 and La2O3 as the starting raw materials, respectively by using the same process as above.
1) with carbon support in molten LiCl–CaH2 system by one-step MSS method at 600 °C. Pt2Gd/C and Pt2La/C are also obtained with Gd2O3 and La2O3 as the starting raw materials, respectively by using the same process as above.
In the synthesis processes, Pt nanoparticles were first obtained by the reaction of K2PtCl4 and CaH2 at 210 °C, then Y ions were preferentially reduced on the Pt nanoparticles surface followed by PtxY alloys formation in the molten LiCl–CaH2 system at 600 °C. CaH2 has the high reduction capacity to extract the oxygen atoms from RE2O3, which is beneficial to form Pt–RE alloys. Molten LiCl provides a strong reducing environment and lowers the formation temperature of alloys.
The half-wave potentials of PtxRE/Cs are all more positive than that of commercial Pt/C catalyst (e.g., 0.905 V for PtxY/C while 0.880 V for JM Pt/C). Furthermore, electrochemical characterizations have demonstrated that PtxY/C samples show higher electrocatalytic activity toward ORR and preferable catalytic durability with respect to JM Pt/C catalysts. This facile synthesis method provides an effective strategy for the preparation of Pt–RE based multicomponent nanoalloys, especially in a large-scale production.
Conflicts of interest
There are no conflicts to declare.Acknowledgements
This work was supported by the Key Project of Science and Technology of Xiamen [grant number 3502Z20201013], the Research Launching Funds of Longyan University [grant number LB2018024], the Natural Science Foundation of Fujian Province, China [grant number 2021J05231], Opening Project of PCOSS, Xiamen University [grant number 201911] and the National Natural Science Foundation of China [grant number 22021001]. We acknowledge Tan Kah Kee Innovation Laboratory for the XPS measurements.References
- X. K. Wan, G. Samjeske, H. Matsui, C. Chen, S. Muratsugu and M. Tada, Dalton Trans., 2021, 50, 6811–6822 RSC.
- G. Liu, Z. Yang, X. Wang and B. Fang, Nanomaterials, 2021, 11, 3462 CrossRef CAS PubMed.
- Z. Yang, M. Chen, B. Fang and G. Liu, Nanomaterials, 2020, 10, 2412 CrossRef CAS PubMed.
- T. Zhao, E. Luo, Y. Li, X. Wang, C. Liu, W. Xing and J. Ge, Sci. China Mater., 2021, 64, 1671–1678 CrossRef CAS.
- Y. J. Wang, D. P. Wilkinson and J. Zhang, Chem. Rev., 2011, 111, 7625–7651 CrossRef CAS PubMed.
- T. Fu, J. Fang, C. Wang and J. Zhao, J. Mater. Chem. A, 2016, 4, 8803–8811 RSC.
- K. M. Naik, E. Higuchi and H. Inoue, J. Power Sources, 2020, 455, 227972 CrossRef CAS.
- B. Fang, L. Daniel, A. Bonakdarpour, R. Govindarajan, J. Sharman and D. P. Wilkinson, Small, 2021, 17, e2102288 CrossRef PubMed.
- Z. Wang, Z. Lin, J. Deng, S. Shen, F. Meng, J. Zhang, Q. Zhang, W. Zhong and L. Gu, Adv. Energy Mater., 2020, 11, 2003023 CrossRef.
- C. Huang, W. Dong, C. Dong, X. Wang, B. Jia and F. Huang, Dalton Trans., 2020, 49, 1398–1402 RSC.
- L. Lu, B. Wang, D. Wu, S. Zou and B. Fang, Nanoscale, 2021, 13, 3709–3722 RSC.
- Z. Lin, B. Xiao, Z. Wang, W. Tao, S. Shen, L. Huang, J. Zhang, F. Meng, Q. Zhang, L. Gu and W. Zhong, Adv. Funct. Mater., 2021, 31, 2102321 CrossRef CAS.
- Z. Wang, Z. Lin, S. Shen, W. Zhong and S. Cao, Chin. J. Catal., 2021, 42, 710–730 CrossRef CAS.
- B. Fang, B. A. Pinaud and D. P. Wilkinson, Electrocatalysis, 2016, 7, 336–344 CrossRef CAS.
- Y.-J. Wang, W. Long, L. Wang, R. Yuan, A. Ignaszak, B. Fang and D. P. Wilkinson, Energy Environ. Sci., 2018, 11, 258–275 RSC.
- L. Lu, S. Zou and B. Fang, ACS Catal., 2021, 11, 6020–6058 CrossRef CAS.
- B. Fang, N. K. Chaudhari, M.-S. Kim, J.-H. Kim and J.-S. Yu, J. Am. Chem. Soc., 2009, 131, 15330–15338 CrossRef CAS PubMed.
- Z. Wang, B. Xiao, Z. Lin, Y. Xu, Y. Lin, F. Meng, Q. Zhang, L. Gu, B. Fang, S. Guo and W. Zhong, Angew. Chem., Int. Ed., 2021, 60, 23388–23393 CrossRef CAS PubMed.
- M.-S. Kim, B. Fang, N. K. Chaudhari, M. Song, T.-S. Bae and J.-S. Yu, Electrochim. Acta, 2010, 55, 4543–4550 CrossRef CAS.
- S. Ma, J. Deng, Y. Xu, W. Tao, X. Wang, Z. Lin, Q. Zhang, L. Gu and W. Zhong, J. Energy Chem., 2022, 66, 560–565 CrossRef.
- X. Zou, S. G. Chen, Q. M. Wang, X. Y. Gao, J. Li, J. Li, L. Li, W. Ding and Z. D. Wei, Nanoscale, 2019, 11, 20115–20122 RSC.
- Y. Nie, L. Li and Z. Wei, Chem. Soc. Rev., 2015, 44, 2168–2201 RSC.
- C. Roy, B. P. Knudsen, C. M. Pedersen, A. Velazquez-Palenzuela, L. H. Christensen, C. D. Damsgaard, I. E. L. Stephens and I. Chorkendorff, ACS Catal., 2018, 8, 2071–2080 CrossRef CAS.
- E. B. Tetteh, H. Y. Lee, C. H. Shin, S. H. Kim, H. C. Ham, T. N. Tran, J. H. Jang, S. J. Yoo and J. S. Yu, ACS Energy Lett., 2020, 5, 1601–1609 CrossRef CAS.
- S. G. Peera, T. G. Lee and A. K. Sahu, Sustainable Energy Fuels, 2019, 3, 1866–1891 RSC.
- N. Lindahl, E. Zamburlini, L. Feng, H. Grönbeck, M. Escudero-Escribano, I. E. L. Stephens, I. Chorkendorff, C. Langhammer and B. Wickman, Adv. Mater. Interfaces, 2017, 4, 1700311 CrossRef.
- J. Greeley, I. E. Stephens, A. S. Bondarenko, T. P. Johansson, H. A. Hansen, T. F. Jaramillo, J. Rossmeisl, I. Chorkendorff and J. K. Norskov, Nat. Chem., 2009, 1, 552–556 CrossRef CAS PubMed.
- S. J. Yoo, S. J. Hwang, J.-G. Lee, S.-C. Lee, T.-H. Lim, Y.-E. Sung, A. Wieckowski and S.-K. Kim, Energy Environ. Sci., 2012, 5, 7521 RSC.
- Y. Hu, J. O. Jensen, L. N. Cleemann, B. A. Brandes and Q. Li, J. Am. Chem. Soc., 2019, 142, 953–961 CrossRef PubMed.
- R. Brandiele, A. Guadagnini, L. Girardi, G. Dražić, M. C. Dalconi, G. A. Rizzi, V. Amendola and C. Durante, Catal. Sci. Technol., 2020, 10, 4503–4508 RSC.
- A. Janghorban, M. Lomello-Tafin, J. M. Moreau and P. Galez, Intermetallics, 2010, 18, 2208–2218 CrossRef CAS.
- H. Itahara, Y. Takatani, N. Takahashi and S. Kosaka, Inorg. Chem., 2020, 59(18), 13583–13588 CrossRef CAS PubMed.
- J. N. Schwammlein, G. S. Harzer, P. Pfandner, A. Blankenship, H. A. El-Sayed and H. A. Gasteiger, J. Electrochem. Soc., 2018, 165, J3173–J3185 CrossRef.
- J. S. Kanady, P. Leidinger, A. Haas, S. Titlbach, S. Schunk, K. Schierle-Arndt, E. J. Crumlin, C. H. Wu and A. P. Alivisatos, J. Am. Chem. Soc., 2017, 139, 5672–5675 CrossRef CAS PubMed.
- Y. Kobayashi, S. Tada and R. Kikuchi, Mater. Adv., 2020, 1, 2202–2205 RSC.
- H. Zhao, C. Yu, H. You, S. Yang, Y. Guo, B. Ding and X. Song, J. Mater. Chem., 2012, 22, 4780–4789 RSC.
- M. Xiao, B. Luo, M. Konarova, Z. Wang and L. Wang, Eur. J. Inorg. Chem., 2020, 31, 2942–2949 CrossRef.
- X. Liu, N. Fechler and M. Antonietti, Chem. Soc. Rev., 2013, 42, 8237–8265 RSC.
- S. J. Yoo, K. S. Lee, S. J. Hwang, Y. H. Cho, S. K. Kim, J. W. Yun, Y. E. Sung and T. H. Lim, Int. J. Hydrogen Energy, 2012, 37, 9758–9765 CrossRef CAS.
- R. Brandiele, C. Durante, E. Grądzka, G. A. Rizzi, J. Zheng, D. Badocco, P. Centomo, P. Pastore, G. Granozzi and A. Gennaro, J. Mater. Chem. A, 2016, 4, 12232–12240 RSC.
- M. V. Ganduglia-Pirovano, V. N. a. M. H. Cohen, J. Kudrnovský and I. Turek, Phys. Rev. B: Condens. Matter Mater. Phys., 1996, 54, 8892–8898 CrossRef CAS PubMed.
- B. Hammer and J. K. Nørskov, Adv. Catal., 2000, 45, 71–129 CAS.
- R. Cui, L. Mei, G. Han, J. Chen, G. Zhang, Y. Quan, N. Gu, L. Zhang, Y. Fang, B. Qian, X. Jiang and Z. Han, Sci. Rep., 2017, 7, 41826 CrossRef CAS PubMed.
- P. Hernandez-Fernandez, F. Masini, D. N. McCarthy, C. E. Strebel, D. Friebel, D. Deiana, P. Malacrida, A. Nierhoff, A. Bodin, A. M. Wise, J. H. Nielsen, T. W. Hansen, A. Nilsson, I. E. Stephens and I. Chorkendorff, Nat. Chem., 2014, 6, 732–738 CrossRef CAS PubMed.
- Y. Wang, D. Sun, M. Wang, Z. Feng and A. S. Hall, J. Phys. Chem. C, 2020, 124, 5220–5224 CrossRef CAS.
- X. Huang, A. J. Shumski, X. Zhang and C. W. Li, J. Am. Chem. Soc., 2018, 140, 8918–8923 CrossRef CAS PubMed.
- J. X. Wang, N. M. Markovic and R. R. Adzic, J. Phys. Chem. B, 2004, 108, 4127–4133 CrossRef CAS.
- Y. Xie, Y. Yang, D. A. Muller, H. D. Abruña, N. Dimitrov and J. Fang, ACS Catal., 2020, 10, 9967–9976 CrossRef CAS.
- V. Stamenkovic, B. S. Mun, K. J. Mayrhofer, P. N. Ross, N. M. Markovic, J. Rossmeisl, J. Greeley and J. K. Norskov, Angew. Chem., Int. Ed. Engl., 2006, 45, 2897–2901 CrossRef CAS PubMed.
- A. L. Strickler, A. Jackson and T. F. Jaramillo, ACS Energy Lett., 2016, 2, 244–249 CrossRef.
- T. Bligaard and J. K. Nørskov, Electrochim. Acta, 2007, 52, 5512–5516 CrossRef CAS.
- D. Y. Wang, H. L. Chou, Y. C. Lin, F. J. Lai, C. H. Chen, J. F. Lee, B. J. Hwang and C. C. Chen, J. Am. Chem. Soc., 2012, 134, 10011–10020 CrossRef CAS PubMed.
- M. Lokanathan, I. M. Patil, P. Mukherjee, A. Swami and B. Kakade, ACS Sustainable Chem. Eng., 2019, 8, 986–993 CrossRef.
- V. T. Ho, C. J. Pan, J. Rick, W. N. Su and B. J. Hwang, J. Am. Chem. Soc., 2011, 133, 11716–11724 CrossRef CAS PubMed.
- B. Zhang, G. Fu, Y. Li, L. Liang, N. S. Grundish, Y. Tang, J. B. Goodenough and Z. Cui, Angew. Chem., Int. Ed. Engl., 2020, 59, 7857–7863 CrossRef CAS PubMed.
Footnote |
| † Electronic supplementary information (ESI) available. See DOI: 10.1039/d1ra09400a |
| This journal is © The Royal Society of Chemistry 2022 |


