 Open Access Article
High performance flame-retardant organic–inorganic hybrid epoxy composites with POSS and DOPO-based co-curing agent
Wei-Hua Xu *a,
Shi-Jing Yana and
Jian-Qing Zhao*b
aKey Laboratory of Chemistry and Engineering of Forest Products, State Ethnic Affairs Commission, School of Materials and Environment, Guangxi University for Nationalities, Nanning, Guangxi 530006, PR China. E-mail: xuweihua4848@163.com
bSchool of Materials Science and Engineering, South China University of Technology, Guangzhou, Guangdong 510640, PR China. E-mail: psjqzhao@scut.edu.cn
First published on 18th March 2022
Abstract
Polyhedral oligomeric silsesquioxane (POSS) and a highly effective 9,10-dihydro-9-oxa-10-phosphaphenanthrene-10-oxide (DOPO)-based flame retardant co-curing agent (D-bp) were chemically introduced into the 4,4′-diaminodiphenyl methane (DDM)/diglycidyl ether of bisphenol A (DGEBA) epoxy system to create organic–inorganic hybrid epoxy composites with simultaneously improved flame retardancy and mechanical properties. The results revealed that POSS/D-bp/DGEBA hybrid composites exhibited excellent comprehensive performance, in which the V-0 criterion of the UL-94 test was passed and the peak of heat release rate (P-HRR) was significantly decreased from 939 to 371 kW m−2 when the phosphorus content was only 0.25 wt%. The glass transition temperature (Tg) increased by 16.2 °C and obvious improvement in the mechanical properties was also evidenced.
1. Introduction
Due to its characteristics of good chemical and corrosion resistance, high tensile strength and modulus, excellent dimensional stability and superior electrical properties, epoxy resin has been widely used as the polymeric matrix of advanced composites, especially in semiconductor encapsulation applications.1–3 Unfortunately, flammability is one of the major disadvantages for epoxy resin, which limits the utilization in some fields that require high flame resistance.4,5In recent years, as a substitute for halogen flame retardants, DOPO and its derivatives have exhibited remarkable achievements for halogen-free flame-retarded epoxy resin.6–10 However, the weak bond of phosphorus-containing groups that introduced into the epoxy matrix reduces the crosslinking density and consequently brings negative effects on thermal and mechanical properties of cured epoxy resin.11,12 It is still worthy to develop a high-performance epoxy resin which combines with the excellent flame retardancy, thermal and mechanical properties.
Organic–inorganic hybridization seems to be the effective way to realize such amelioration. POSS is considered to be an efficient inorganic reinforced material due to its well-defined nano-sized and typical cage structure. It has been widely used to improve the thermal and mechanical properties of thermoplastic or thermosetting polymers.13,14 A representative POSS molecule structure with the general formula (RSiO1.5)n possesses a cube-octameric inorganic core which is constructed by Si–O–Si bond has excellent thermal properties.15 Generally, R is a series of reactive groups (such as amino, epoxy, hydroxyl, etc.) which makes POSS possible to be chemically attached into the polymer matrix via copolymerization, grafting or blending.16,17 Based on the above characteristics, POSS can optimize the matrix interactions by covalent bonding, and thereby improve the crosslinking density, which endows obvious exaltation to the polymer hybrid composites.18–20 In addition, silicon and phosphorous element have exhibited the synergistic flame retardation effect through flame inhibition in the gas phase and char enhancement in the condensed phase.21,22 Zhang and co-workers synthesized a novel flame retardant (DOPO–POSS) and proposed a flame retardant mechanism called “blowing-out extinguishing effect”, which displayed excellent flame retardancy for epoxy resin through such synergism.23–25 However, since DOPO–POSS was introduced via physical blending method, the flame retardant efficiency was limited and the mechanical properties of the modified thermoset would decreased seriously in contrary. Liu obtained POSS-bis-DOPO flame retardant from DOPO and amine POSS for epoxy resin. Unfortunately, the compatibility between POSS-bis-DOPO and epoxy matrix still needed to be further improved.26 Hence, based on the synergism between phosphorus and silicon elements, in order to achieve a remarkable improvement in the flame-retardant efficiency by introducing silicon containing group into DOPO-based derivative and obtain excellent comprehensive properties, chemical approach such as copolymerization or grafting are considered as an effective method to realize phosphorus–silicon high efficiency synergistic flame retardant, which is the future development direction of high performance flame-retarded epoxy resin.
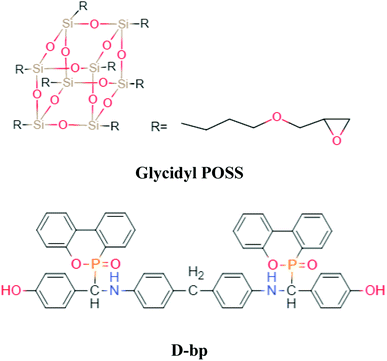
In our study, Glycidyl POSS (G-POSS) used as a reinforced matrix to substitute DGEBA and D-bp used as flame retardant co-curing of DDM thereby a series of POSS/D-bp/DGEBA hybrid composites were successfully prepared via organic–inorganic crosslinking reaction. The flame retardancy, thermal, mechanical and dynamic mechanical properties of cured hybrid composites were evaluated.
2. Experimental
2.1 Materials
DOPO and DGEBA (epoxide value of 0.51 mol per 100 g) were purchased from Eutec Trading (Shanghai) Co., Ltd and SINOPEC Assets Management Corporation Baling Petrochemical Branch, respectively. G-POSS (Fig. 1, epoxide value of 0.60 mol per 100 g), 4,4′-diaminodiphenyl methane (DDM) and 4-hydroxybenzaldehyde were obtained from Aladdin Chemistry (Shanghai) Co., Ltd. 1,4-Dioxane and ethanol were purchased from Guangzhou Chemical Reagent Factory and used without further purification. D-bp (Fig. 1, 1H NMR (400 MHz, DMSO-d6, ppm): 9.36–9.39 (s, 2H, Ph-OH), 8.15–8.17 (t, 2H, Ph-H), 7.96–7.99 (m, 2H, Ph-H), 7.72–7.74 (m, 2H, Ph-H), 7.66–7.70 (m, 2H, Ph-H), 7.51–7.53 (t, 2H, Ph-H), 7.38–7.44 (m, 2H, Ph-H), 7.28–7.32 (m, 2H, Ph-H), 7.18–7.19 (m, 2H, Ph-H), 7.13–7.15 (m, 2H, Ph-H), 7.01–7.03 (m, 2H, Ph-H), 6.68–6.70 (m, 2H, Ph-H), 6.64–6.66 (t, 2H, Ph-H), 6.61–6.63 (m, 2H, Ph-H), 6.52–6.55 (m, 2H, Ph-H), 6.47–6.50 (m, 2H, Ph-H), 6.43–6.45 (m, 2H, Ph-H), 6.38–6.42 (t, 1H), 5.97–6.01 (t, 1H), 4.83–4.88 (m, 1H, N–H), 3.39–3.44 (t, 2H). 31P NMR (162 MHz, DMSO-d6, ppm): 31.4, 28.6) was synthesized in our laboratory.272.2 Preparation of POSS/D-bp/DGEBA hybrid composites
The stoichiometric formulations for POSS/D-bp/DGEBA hybrid composites are listed in Table 1, where the sum amount of amino and phenol groups from DDM and D-bp is equal to the epoxy groups from DGEBA and G-POSS. POSS/D-bp/DGEBA hybrid composites were prepared with the following thermal curing process. Firstly, DGEBA and D-bp were mixed at 140 °C by mechanical stirring under N2 for 10 min. Then, the homogeneous liquid was cooled down to 90 °C and blended with G-POSS under ultrasonic dispersion for 1 h. After becoming transparent, DDM was added into the mixture and stirred until dissolved completely. Finally, all samples were vacuum-degassed in a mold and sequentially cured for 1 h at 80 °C, 1 h at 100 °C, 1 h at 120 °C, 3 h at 150 °C and 2 h at 180 °C, respectively.| Samples | DGEBA (g) | G-POSS (g) | DDM (g) | D-bp (g) | P (wt%) | Si (wt%) |
|---|---|---|---|---|---|---|
| EP-1 | 100 | 0 | 25.3 | 0 | 0 | 0 |
| EP-2 | 95 | 5 | 25.5 | 0 | 0 | 0.68 |
| EP-3 | 100 | 0 | 24.3 | 4.4 | 0.25 | 0 |
| EP-4 | 95 | 5 | 24.5 | 4.4 | 0.25 | 0.66 |
| EP-5 | 100 | 0 | 23.5 | 8.9 | 0.50 | 0 |
| EP-6 | 95 | 5 | 23.8 | 8.9 | 0.50 | 0.64 |
2.3 Measurements
1H and 31P NMR spectra of D-bp were recorded on a Bruker AVANCE III HD 600 NMR instrument, and DMSO-d6 was used as the solvent.TGA was carried out on a Netzsch STA449F3 thermogravimetric analyzer with the temperature range from 30 °C to 800 °C at a heating rate of 10 °C min−1 under nitrogen and air atmosphere.
Flexural and tensile properties were studied in accordance with ASTM D638-08 and D790-07e using a Z010 universal testing machine. Samples were tested at a crosshead speed of 5 mm min−1 and the average value was adopted for each set of six specimens. Dynamic mechanical analysis (DMA) was conducted on a Netzsch DMA242C analyzer from 30 °C to 225 °C at a heating rate of 3 °C min−1 and a frequency of 10 Hz with three-point bending mode.
LOI measurement was conducted on an Fire Testing Technology FTA-SC48 oxygen index instrument with the sheet dimension of 150 × 6.5 × 3.2 mm3 according to ASTM D2863-97. Vertical burning test was carried out on a Fire Testing Technology UL94-SC50 UL-94 flammability meter with the sheet dimension of 130 × 13 × 3.2 mm3 according to ANSL UL 94-1985. Cone calorimeter test was carried out on a Fire Testing Technology FTT0007 cone calorimeter with the sheet dimension of 100 × 100 × 5 mm3 according to ISO5660 under an external heat flux of 50 kW m−2.
The char residues after cone calorimetry test were collected to investigate the condensed phase of hybrid composites. X-ray photoelectron spectroscopy (XPS) was carried out on a Kratos Axis Ultra-DLD X-ray photoelectron spectrometer with Al Kα radiation of 1486.6 eV.
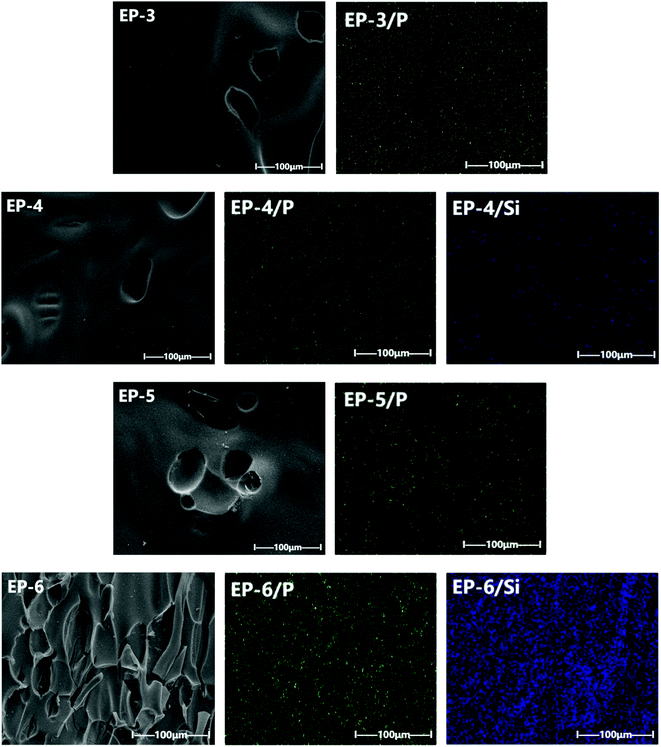
The morphology of char residues after cone calorimeter test were observed by a FEI-NOVA NANOSEM 230 (EDS X-MAX50) scanning electron microscope (SEM) with an accelerating potential of 15 kV. The elemental analysis was conducted by the energy dispersive X-ray spectrometer (EDX) in the surface scanning model. The surface of char residues was sprayed with platinum before test.
3. Results and discussion
3.1 Flame retardancy of POSS/D-bp/DGEBA hybrid composites
| Samples | LOI (%) | UL-94 | ||
|---|---|---|---|---|
| t1 + t2 (s) | Dripping | Rating | ||
| a t1: total combustion time after the first 10 s ignition.b t2: total combustion time after the second 10 s ignition. | ||||
| EP-1 | 24.2 ± 0.9 | Lasting burning | Yes | No rating |
| EP-2 | 25.5 ± 1.2 | 61.9 ± 3.1 | No | No rating |
| EP-3 | 30.5 ± 1.4 | 14.5 ± 3.1 | No | V-1 |
| EP-4 | 30.7 ± 0.8 | 8.6 ± 1.1 | No | V-0 |
| EP-5 | 39.7 ± 0.8 | 6.7 ± 1.7 | No | V-0 |
| EP-6 | 39.6 ± 1.1 | 5.1 ± 1.4 | No | V-0 |
| Samples | TTI (s) | P-HRR (kW m−2) | THR (MJ m−2) | av-EHC (MJ kg−1) | P-SPR (m2 s−1) | Residues (wt%) |
|---|---|---|---|---|---|---|
| a P-HRR: under the preset incident heat flux intensity, the maximum value of heat release rate per unit area after the material is ignited.b THR: the sum of the heat released by the material from ignition to flame extinction under the preset incident heat flow intensity.c EHC: the ratio of measured heat release rate to mass loss rate at a certain time reflects the combustion degree of volatile gas in gas phase flame.d P-SPR: the maximum value of specific extinction area (SEA) to mass loss rate (MLR). | ||||||
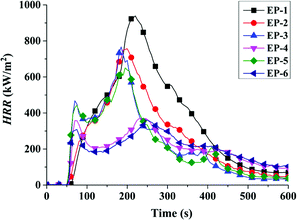
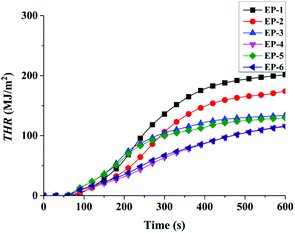
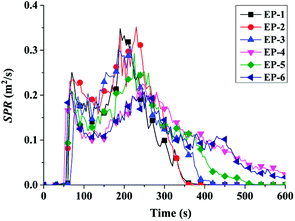
| EP-1 | 53 | 939 | 202 | 31.6 | 0.35 | 13.5 |
| EP-2 | 48 | 753 | 175 | 29.2 | 0.33 | 17.1 |
| EP-3 | 53 | 767 | 134 | 29.0 | 0.30 | 17.3 |
| EP-4 | 54 | 371 | 116 | 23.9 | 0.22 | 25.9 |
| EP-5 | 49 | 651 | 130 | 23.6 | 0.29 | 18.1 |
| EP-6 | 51 | 361 | 115 | 21.3 | 0.20 | 28.5 |
3.2 TGA of POSS/D-bp/DGEBA hybrid composites
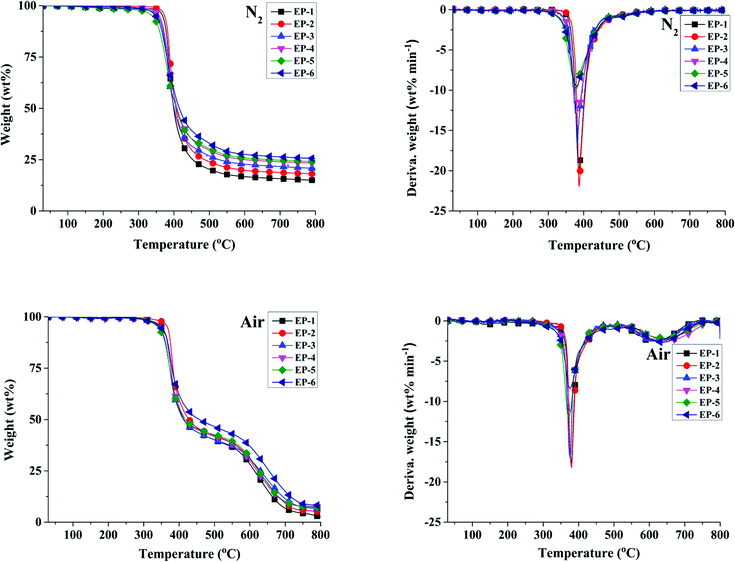
Fig. 5 shows the TG and DTG curves of POSS/D-bp/DGEBA hybrid composites under nitrogen and air atmospheres, respectively. The related decomposition data, including the initial decomposition temperature, which is defined as the temperature at 5% weight loss (Td5%), the temperature at maximum decomposition rate (Tdmax) and the residual mass at 800 °C (R800) are summarized in Table 4, respectively. It can be observed from the TG curves of POSS/D-bp/DGEBA hybrid composites under nitrogen atmosphere that the thermal degradation process of all samples exhibits only one stage. Compared with EP-1, Td5% and Tdmax values of EP-3 and EP-5 decrease concurrently following the introduction of flame retardant D-bp. The reasonable explanation is attributed to the fact that the bond energy of O![[double bond, length as m-dash]](https://www.rsc.org/images/entities/char_e001.gif) P–O is less than that of C–C bond so that the phosphorus-containing group first decomposes and generates phosphate or polyphosphate in a lower temperature. Nonetheless, Td5% are still maintained in the high range of above 330 °C. On the contrary, for the same content of phosphorus, incorporation of G-POSS brings about an improvement in the Td5% and Tdmax values, as shown from EP-4 and EP-6 whose Td5% are 4.8 °C and 10.6 °C respectively higher than that of EP-3 and EP-5, and the same situation also appears on the Tdmax values which attributed to G-POSS possesses excellent thermal stability. Furthermore, the R800 values of POSS/D-bp/DGEBA hybrid composites are significantly increased following the flame retardation, with EP-6 exhibits the highest value of 25.6 wt%.
P–O is less than that of C–C bond so that the phosphorus-containing group first decomposes and generates phosphate or polyphosphate in a lower temperature. Nonetheless, Td5% are still maintained in the high range of above 330 °C. On the contrary, for the same content of phosphorus, incorporation of G-POSS brings about an improvement in the Td5% and Tdmax values, as shown from EP-4 and EP-6 whose Td5% are 4.8 °C and 10.6 °C respectively higher than that of EP-3 and EP-5, and the same situation also appears on the Tdmax values which attributed to G-POSS possesses excellent thermal stability. Furthermore, the R800 values of POSS/D-bp/DGEBA hybrid composites are significantly increased following the flame retardation, with EP-6 exhibits the highest value of 25.6 wt%.
| Samples | Nitrogen | Air | ||||
|---|---|---|---|---|---|---|
| Td5% (°C) | Tdmax (°C) | R800 (wt%) | Td5% (°C) | Tdmax (°C) | R800 (wt%) | |
| EP-1 | 368.0 | 386.6 | 14.9 | 351.1 | 378.9 | 2.6 |
| EP-2 | 373.6 | 387.0 | 18.1 | 367.1 | 379.7 | 5.1 |
| EP-3 | 353.6 | 382.9 | 20.8 | 342.3 | 376.3 | 6.8 |
| EP-4 | 358.4 | 384.5 | 23.3 | 349.6 | 376.5 | 7.5 |
| EP-5 | 338.4 | 379.9 | 24.1 | 340.1 | 372.1 | 7.2 |
| EP-6 | 349.0 | 380.4 | 25.6 | 346.8 | 375.8 | 8.2 |
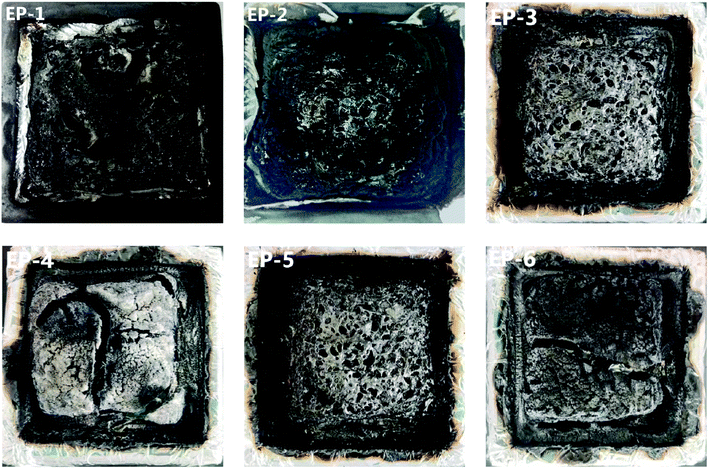
Under air atmosphere, the TG curves of POSS/D-bp/DGEBA hybrid composites exhibit two stages decomposition. The first stage attributes to the degradation of epoxy chains, and the second one corresponds to the decomposition between char residue and oxygen.28,29 Compared with the unmodified EP-1, Td5% and Tdmax values of EP-4 and EP-6 are reduced slightly, which means POSS/D-bp/DGEBA hybrid composites maintain good thermal stability in the air atmosphere. Additionally, combine with the DTG curves under nitrogen and air atmospheres that the mass loss rate of POSS/D-bp/DGEBA hybrid composites also significantly inhibited. The above results indicate the early degradation of phosphorus-containing group catalyzes the formation of carbon layer and G-POSS tends to stabilize the layer, which combine an effective barrier layer and improve the thermal properties and flame retardancy of POSS/D-bp/DGEBA hybrid composites.
3.3 Analysis of char residues of POSS/D-bp/DGEBA hybrid composites
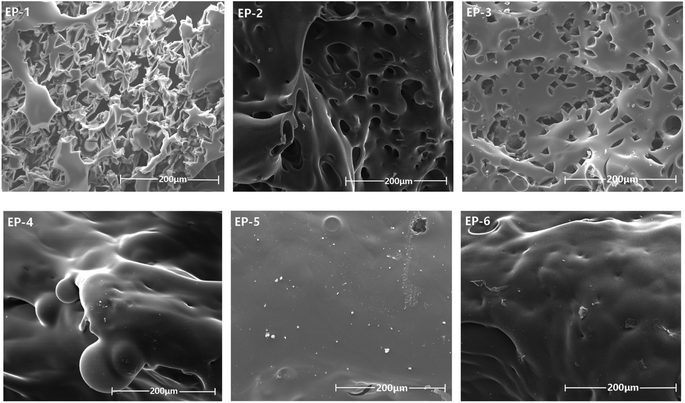 | ||
| Fig. 7 SEM photographs of POSS/D-bp/DGEBA hybrid composites after cone calorimeter test (scale bar size: 200 μm). | ||
| Samples | C (wt%) | N (wt%) | O (wt%) | P (wt%) | Si (wt%) |
|---|---|---|---|---|---|
| EP-1 | 80.89 | 4.20 | 14.91 | 0 | 0 |
| EP-2 | 82.56 | 2.78 | 9.94 | 0 | 4.72 |
| EP-3 | 82.79 | 13.11 | 3.77 | 0.33 | 0 |
| EP-4 | 78.18 | 4.08 | 13.97 | 0.31 | 3.46 |
| EP-5 | 85.88 | 9.77 | 3.61 | 0.74 | 0 |
| EP-6 | 53.49 | 2.38 | 25.67 | 1.47 | 16.99 |
3.4 Mechanical properties of POSS/D-bp/DGEBA hybrid composites
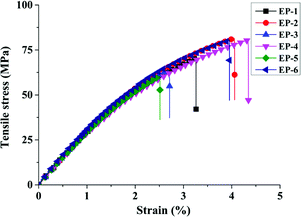
In addition, tensile and flexural strength tests are used to evaluate the mechanical properties of POSS/D-bp/DGEBA hybrid composites. Fig. 10 shows their tensile stress/strain curves and the corresponding tensile and flexural properties data are also listed in Table 6. Due to the phosphorus-containing groups would greatly reduce the crosslink density of cured epoxy resin, the tensile strength and the integral area of discharge based on the tensile stress/strain curve are obviously declined with the incorporation of D-bp. On the contrary, tensile strength and integral area of discharge have a considerable ameliorated with the introduction of G-POSS and tensile modulus has further enhanced. It is worth noting that EP-4 have a synergistic flame retardation effect between D-bp and G-POSS for the tensile properties, which is reflected in the tensile strength and the integral area of discharge are increased by 14.5% and 54.8% on the basis of EP-1, respectively. The similar tendency also can be found in flexural properties test with the flexural strength of EP-4 reaches the maximum value of 125.8 MPa, which is increased by 20.2 MPa compared with EP-1. Besides, the tensile and flexural modulus of POSS/D-bp/DGEBA hybrid composites are enhanced which depend on the collective effect of rigidity D-bp and G-POSS structure. The above results indicated that the rigid inorganic Si–O–Si core of G-POSS serves as highly functional anchors and the flexible organic branches plays a toughening effect on the DGEBA matrix, which effectively eliminate the influence of D-bp. On the whole, the mechanical properties of POSS/D-bp/DGEBA hybrid composites are elevated after the addition of G-POSS.| Samples | Tensile strength (MPa) | Tensile modulus (GPa) | Flexural strength (MPa) | Flexural modulus (GPa) |
|---|---|---|---|---|
| EP-1 | 70.3 ± 1.3 | 2.88 ± 0.08 | 105.6 ± 3.1 | 2.78 ± 0.13 |
| EP-2 | 81.5 ± 4.0 | 3.60 ± 0.14 | 119.7 ± 2.6 | 2.79 ± 0.07 |
| EP-3 | 63.7 ± 1.7 | 3.05 ± 0.11 | 99.8 ± 1.5 | 3.05 ± 0.05 |
| EP-4 | 80.5 ± 1.2 | 3.71 ± 0.06 | 125.8 ± 2.5 | 3.19 ± 0.09 |
| EP-5 | 60.5 ± 2.8 | 3.61 ± 0.18 | 94.7 ± 2.3 | 3.21 ± 0.11 |
| EP-6 | 80.5 ± 1.0 | 4.07 ± 0.16 | 123.1 ± 1.8 | 3.31 ± 0.12 |
3.5 DMA of POSS/D-bp/DGEBA hybrid composites
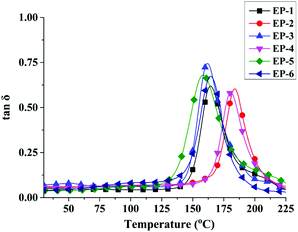
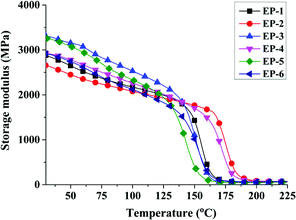
To further demonstrate the influence of curing behavior by D-bp and G-POSS, DMA is used to determine the crosslinking density of POSS/D-bp/DGEBA hybrid composites. Fig. 11 and 12 are exhibited the loss tangent (tan![[thin space (1/6-em)]](https://www.rsc.org/images/entities/char_2009.gif) δ) and storage modulus curves of POSS/D-bp/DGEBA hybrid composites, respectively. Besides, the relation data of DMA are listed in Table 7 while Tg is obtained from the peak temperature of tan
δ) and storage modulus curves of POSS/D-bp/DGEBA hybrid composites, respectively. Besides, the relation data of DMA are listed in Table 7 while Tg is obtained from the peak temperature of tan![[thin space (1/6-em)]](https://www.rsc.org/images/entities/char_2009.gif) δ in Fig. 11. Compared with EP-1, Tg of EP-3 and EP-5 decline obviously following the introduction of D-bp alone, which is attributed to the phosphorus-containing group would reduce the crosslink densities of cured epoxy resins. In contrast, due to the introduction of G-POSS owns superior thermal stability, EP-2 shows an obviously increase in Tg and reaches up to 183.9 °C, which is increased by 19.4 °C than that of EP-1. The similar trend also can be observed from EP-4, which considerably increased by 16.2 °C compared with EP-1. In the condition of the same phosphorus content, POSS/D-bp/DGEBA hybrid composites exhibit a higher Tg than that only modified by D-bp. The above results reflect the significant reinforcement effect on Tg by G-POSS.
δ in Fig. 11. Compared with EP-1, Tg of EP-3 and EP-5 decline obviously following the introduction of D-bp alone, which is attributed to the phosphorus-containing group would reduce the crosslink densities of cured epoxy resins. In contrast, due to the introduction of G-POSS owns superior thermal stability, EP-2 shows an obviously increase in Tg and reaches up to 183.9 °C, which is increased by 19.4 °C than that of EP-1. The similar trend also can be observed from EP-4, which considerably increased by 16.2 °C compared with EP-1. In the condition of the same phosphorus content, POSS/D-bp/DGEBA hybrid composites exhibit a higher Tg than that only modified by D-bp. The above results reflect the significant reinforcement effect on Tg by G-POSS.
| Samples | Tg (°C) | tan![[thin space (1/6-em)]](https://www.rsc.org/images/entities/char_2009.gif) δ δ |
E′ (MPa) | νe (.103 mol m−3) |
|---|---|---|---|---|
| EP-1 | 164.5 | 0.62 | 60.8 | 5.11 |
| EP-2 | 183.9 | 0.60 | 72.4 | 5.84 |
| EP-3 | 161.8 | 0.74 | 53.4 | 4.51 |
| EP-4 | 180.7 | 0.58 | 79.8 | 6.48 |
| EP-5 | 158.5 | 0.67 | 48.8 | 4.15 |
| EP-6 | 164.4 | 0.67 | 63.1 | 5.30 |
The variation of Tg is associated with crosslink density (νe). According to the literature, νe values can be calculated by the rubber elasticity theory30,31 with the eqn (1):
| νe = E′/3RT | (1) |
The calculation results of νe according to the above formulation also listed in Table 7. Clearly, it is consistent with the tendency of tan![[thin space (1/6-em)]](https://www.rsc.org/images/entities/char_2009.gif) δ that the calculation results of νe are transformed progressively to a higher value with the introduction of G-POSS. It is noteworthy that in the condition of same phosphorus content, νe of EP-4 reaches the maximum value of 6.48 × 10³ mol m−3 which increased by 30.4% compared with EP-3. The reasonable explanation is that the reactive glycidyl group of rigid G-POSS participates in the crosslinking reaction of epoxy resin, which hinders the movement of the polymer chains and then significantly increases νe of hybrid composites. Besides, the storage modulus of EP-4 and EP-6 are higher than that of EP-1 at room temperature, illustrating the rigidity of POSS/D-bp/DGEBA hybrid composites are enhanced. The above results indicated that G-POSS acts as reactive reinforcement, which enhances the dynamic mechanical properties of POSS/D-bp/DGEBA hybrid composites effectively.
δ that the calculation results of νe are transformed progressively to a higher value with the introduction of G-POSS. It is noteworthy that in the condition of same phosphorus content, νe of EP-4 reaches the maximum value of 6.48 × 10³ mol m−3 which increased by 30.4% compared with EP-3. The reasonable explanation is that the reactive glycidyl group of rigid G-POSS participates in the crosslinking reaction of epoxy resin, which hinders the movement of the polymer chains and then significantly increases νe of hybrid composites. Besides, the storage modulus of EP-4 and EP-6 are higher than that of EP-1 at room temperature, illustrating the rigidity of POSS/D-bp/DGEBA hybrid composites are enhanced. The above results indicated that G-POSS acts as reactive reinforcement, which enhances the dynamic mechanical properties of POSS/D-bp/DGEBA hybrid composites effectively.
4. Conclusion
A series of high-performance hybrid epoxy composites were prepared via crosslinking reaction among flame retardant co-curing agent D-bp, reinforcement agent G-POSS and matrix DGEBA. Probably owing to the phosphorus–silicon synergistic flame retardation effect and nano-enhancement effect by incorporation of G-POSS that POSS/D-bp/DGEBA hybrid composites exhibit excellent comprehensive performance, in which the V-0 grade of UL-94 classification is achieved and P-HRR is significantly decreased from 939 kW m−2 to 371 kW m−2 when the phosphorus content is only 0.25 wt%. What's more, G-POSS can effectively compensate the decrease of thermal stability and mechanical properties influenced by D-bp. Compared with the neat sample, Tg is increased by 16.2 °C meanwhile the tensile and flexural strengths have obviously improved, which are increased by 12.7% and 16.1% respectively. Therefore, POSS/D-bp/DGEBA hybrid composites are expected to be used as high-performance composite materials in semiconductor encapsulation applications.Conflicts of interest
There are no conflicts to declare.Acknowledgements
This research was supported by Guangxi Natural Science Foundationunder Grant No. 2019GXNSFBA185020 and The Open Fund for Key Lab of Guangdong High Property and Functional Macromolecular Materials, China (20190019).References
- S. Levchik, A. Piotrowski, E. Weil and Q. Yao, Polym. Degrad. Stab., 2005, 88, 57–62 CrossRef CAS
.
- F. L. Jin, X. Li and S. J. Park, J. Ind. Eng. Chem., 2015, 29, 1–11 CrossRef CAS
.
- S. Q. Huo, P. A. Song, B. Yu, S. Y. Ran, V. S. Chevali, L. Liu, Z. P. Fang and H. Wang, Prog. Polym. Sci., 2021, 114, 101366 CrossRef CAS
.
- H. Wang, S. Li, Z. M. Zhu, X. Z. Yin, L. X. Wang, Y. X. Weng and X. Y. Wang, Polym. Degrad. Stab., 2021, 183, 109426 CrossRef CAS
.
- M. M. Velencoso, A. Battig, J. C. Markwart, B. Schartel and F. R. Wurm, Angew. Chem., Int. Ed., 2018, 57, 1–18 CrossRef PubMed
.
- P. Wang, L. Xia, R. K. Jian, Y. F. Ai, X. L. Zheng, G. L. Chen and J. S. Wang, Polym. Degrad. Stab., 2018, 149, 69–77 CrossRef CAS
.
- P. Wang and Z. Cai, Polym. Degrad. Stab., 2017, 137, 138–150 CrossRef CAS
.
- X. Lu, M. Yu, D. Wang, P. Xiu, C. Xu, A. F. Lee and X. Gu, Mater. Today Chem., 2021, 22, 100562 CrossRef CAS
.
- S. Q. Huo, J. Wang, S. Yang, C. Li, X. L. Wang and H. P. Cai, Polym. Degrad. Stab., 2019, 159, 79–89 CrossRef CAS
.
- X. Han, R. Chen, M. Yang, C. B. Sun, K. Wang and Y. S. Wang, High Perform. Polym., 2022, 34, 173–183 CrossRef CAS
.
- W. Q. Xie, S. W. Huang, D. L. Tang, S. M. Liu and J. Q. Zhao, RSC Adv., 2020, 10, 8054 RSC
.
- A. Wirasaputra, X. H. Yao, Y. M. Zhu, S. M. Liu, Y. C. Yuan, J. Q. Zhao and Y. Fu, Macromol. Mater. Eng., 2016, 301, 982–991 CrossRef CAS
.
- D. M. Min, H. Z. Cui, Y. L. Hai, P. X. Li, Z. J. Xing, C. Zhang and S. T. Li, Compos. Sci. Technol., 2020, 199, 108329 CrossRef CAS
.
- Y. H. Zhang, L. Li, K. M. Nie and S. X. Zheng, Mater. Chem. Phys., 2020, 240, 122183 CrossRef CAS
.
- J. L. Li, H. Y. Wang and S. C. Li, High Perform. Polym., 2019, 31, 1217–1225 CrossRef CAS
.
- B. R. Zeng, R. R. Zhou, X. H. Zheng, J. Y. Ye, J. M. Chen, Y. T. Xu, C. H. Yuan and L. Z. Dai, Polym. Adv. Technol., 2021, 32, 2339–2351 CrossRef CAS
.
- X. Han, X. H. Zhang, Y. Guo, X. Y. Liu, X. J. Zhao, H. Zhou, S. L. Zhang and T. Zhao, Polymers, 2021, 13, 1363 CrossRef CAS PubMed
.
- L. C. Liu, W. C. Zhang and R. J. Yang, Polym. Adv. Technol., 2020, 31, 2058–2074 CrossRef CAS
.
- J. M. Luo, R. Li, H. W. Zou, Y. Chen and M. Liang, High Perform. Polym., 2018, 31, 800–809 CrossRef
.
- X. M. Ye, J. J. Li, W. C Zhang, R. J. Yang and J. R. Li, Composites, Part B, 2020, 191, 107961 CrossRef CAS
.
- Y. Q. Shi, B. Yu, Y. Y. Zheng, J. Guo, B. H. Chen, Z. M. Pan and Y. Hu, Polym. Adv. Technol., 2018, 29, 1242–1254 CrossRef CAS
.
- C. Liu, T. Chen, C. Yuan, Y. Chang, G. Chen, B. Zeng, Y. Xu, W. Luo and L. Dai, RSC Adv., 2017, 7, 46139–46147 RSC
.
- W. C. Zhang, X. M. Li and R. J. Yang, Polym. Degrad. Stab., 2012, 97, 1314–1324 CrossRef CAS
.
- W. C. Zhang, X. M. Li and R. J. Yang, Polym. Degrad. Stab., 2011, 96, 2167–2173 CrossRef CAS
.
- W. C. Zhang, G. Camino and R. J. Yang, Prog. Polym. Sci., 2017, 67, 77–125 CrossRef CAS
.
- C. Liu, T. Chen, C. H. Yuan, C. F. Song, Y. Chang, G. R. Chen, Y. T. Xu and L. Z. Dai, J. Mater. Chem. A, 2016, 4, 3462–3470 RSC
.
- W. H. Xu, A. Wirasaputra, S. M. Liu, Y. C. Yuan and J. Q. Zhao, Polym. Degrad. Stab., 2015, 122, 44–51 CrossRef CAS
.
- J. Wang, C. Ma, P. Wang, S. Qiu, W. Cai and Y. Hu, Polym. Degrad. Stab., 2018, 149, 119–128 CrossRef CAS
.
- Y. Q. Shi, T. Fu, Y. J. Xu, D. F. Li, X. L. Wang and Y. Z. Wang, Chem. Eng. J., 2018, 354, 208–219 CrossRef CAS
.
- P. H. Henna and R. C. Larock, Macromol. Mater. Eng., 2007, 292, 1201–1209 CrossRef CAS
.
- B. Francia, S. Thomas, R. Sadhana, N. Thuaud, R. Ramaswamy, S. Jose and L. Rao, J. Polym. Sci., Part B: Polym. Phys., 2007, 45, 2481–2496 CrossRef
.
| This journal is © The Royal Society of Chemistry 2022 |

