 Open Access Article
Anaerobic digestion of urea pretreated water hyacinth removed from Lake Abaya; bio-methane potential, system stability, and substance conversion
Demissie Dawana Kechea,
Zemed Menberu Fetanub,
Wudinesh Zawuga Babisob and
Akiber Chufo Wachemo *b
*b
aArba Minch University Water Resource Research Center, P. O. Box 21, Arba Minch, Ethiopia
bFaculty of Water Supply and Environmental Engineering, Arba Minch Water Technology Institute (AWTI), Arba Minch University, P. O. Box 21, Arba Minch, Ethiopia. E-mail: akiberchufo@yahoo.com; Tel: +251911813633
First published on 17th March 2022
Abstract
Water hyacinth (Eichhornia crassipes) is characterized as an aquatic plant that can grow very rapidly and freely float over water, and covers the top surface of water. It prevents the penetration of sunlight and reduces nutrients and oxygen from water bodies, and can adversely affect the aquatic ecosystem; however, it can be used in the biogas production as the sole feedstock for anaerobic digestion due to high contents of carbohydrates and biodegradable matter. Thus, this study was aimed to remove water hyacinth from Lake Abaya as a renewable energy resource for biogas production through anaerobic digestion. A lab-scale anaerobic batch reactor was applied to assess its biogas and methane generation potential. The results showed that the total solids of 91.9% at dry basis and volatile solids of 84.82% of TS. The biogas and methane production potential of 474.92 mL g−1 VS and 213.92 mL g−1 VS was recorded during 45 days HRT at 37 ± 1 °C. The daily methane production discloses accelerated increment starting from day 8 up to the peak point on day 12 (2170 mL d−1). The biochemical conversion of substances in water hyacinth to biogas was recorded as follows: total volatile solids (96.1%), cellulose (92.5%), hemicellulose (88.2%), and chemical oxygen demand (99.3%). Based on results, E. crassipes can be the sole feedstock for the anaerobic reactor to produce biomethane, while the effluents can be applied as organic fertilizers.
1. Introduction
Green energy is one of the significant factors to global wealth. The continuous use of fossil fuels as the main energy source has led to worldwide weather change, environmental degradation, and human health problems.1 The exploration of alternative energy sources is associated with several urgent issues, including energy independence, fluctuation of petroleum fuel costs, the threat of climate change, and the foreseen depletion of non-renewable fuel sources.2 These resources are draining very fast in most areas where societies have no access to alternative renewable energy sources. There are renewable sources, including wood, plants, dung, falling water, geothermal sources, solar, wind, and wave energy. But each has its own economic, health, and environmental costs, benefits, and risk factors that interact strongly with other governmental and global priorities. Choices must be made, but in the certain knowledge that choosing an energy strategy inevitably means choosing an environmental strategy.3 Green energy is often supposed to be the next great technology that will one day replace mankind's dependency on fossil fuels.Now a day's serious socio-economic and environmental problems are the encroachment of invasive plants, such as water hyacinths, in lakes, ponds, and rivers. Water hyacinth (WH) is an aquatic plant that can grow very rapidly and free-floating over the water’ surface. This is due to the leaves and stem containing air-filled sacs, which help them to stay afloat on water. The invasive potential of this plant has created massive environmental problems in many areas. It has shown an extremely high growth rate and the coverage of the whole body of water by forming a thick compact carpet. This thick carpet prevents the penetration of sunlight underwater, and thus the oxygen level in water decreases4 and numerous problems, including damage of aquatic plants and animals, irrigation problems preventing water transportation, and a breeding place for mosquitoes leading to rise in the mosquito population.5
Ethiopia is one of the countries facing the existence of WH in its water bodies.6 The invasion of water hyacinth on the water bodies in Ethiopia was noticed in 2012 on Lake Tana. Since then, the plant has shown tremendous expansion on Lake Tana. Due to its quick expansion, it is becoming a serious challenge for society to get rid of it, which is now not only in Lake Tana, but also in Lake Abaya. Ethiopia is endowed with huge resources of water and wetland ecosystems such as rivers, lakes, swamps, floodplains, and man-made reservoirs.7 These bodies of water are in danger of being infected by WH due to its rapid propagation if the condition remains unchanged. Attempts to control the weed have caused high costs and labor requirements, leading to nothing but temporary removal of the water hyacinths.8 Therefore, this leads to the search for another alternative method of water hyacinth management, which can be easily implemented locally.
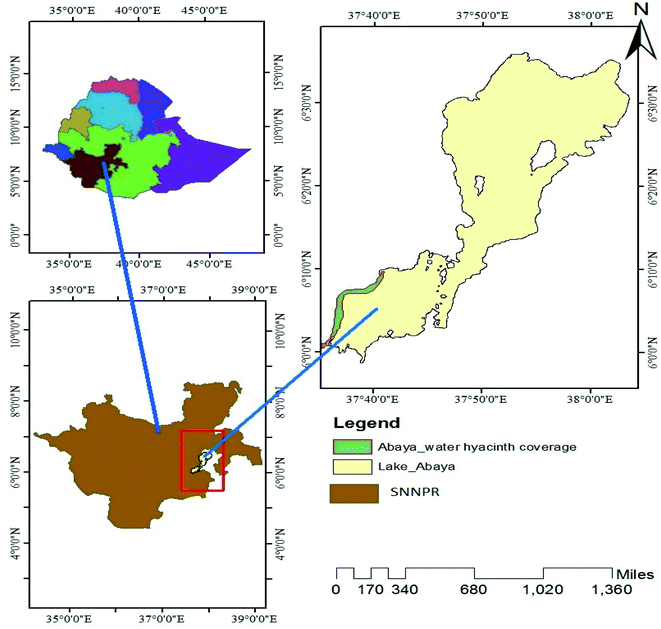
WH is rich in essential nutrients, nitrogen, and has a high content of fermentable matter and hence the locally grown WH is a potential biomass for biogas production. Apart from bio-gas, the digestate obtained after AD is rich in macronutrients needed for the healthy growth of plants; hence, it is a useful soil conditioner and manure with no detrimental effects on the environment.9 Thus, the application of WH as a source of renewable energy to substitute fossil fuels will provide effective management of this invasive plant on water bodies, and in the meantime, the effluent after AD could be used as a suitable organic fertilizer for plant nourishment. Therefore, this study aims to determine the biomethane potential and substance conversion during anaerobic digestion while analyzing the gradual changes in system stability from the water hyacinth collected from Lake Abaya, Ethiopia.
2. Materials and methods
2.1 Feedstock and inoculum
| Parameters | Water hyacinth | Inoculum |
|---|---|---|
| Total solids of dry basis (%) | 91.9 ± 0.12 | 3.0 ± 0.07 |
| Total volatile solids (%) | 84.82 ± 13.04 | 56 ± 0.21 |
| Ash contents (%) | 18.49 ± 0.07 | 0.72 ± 0.04 |
| Total nitrogen contents (%) | 1.82 ± 0.32 | 1.96 ± 1.19 |
| Total organic carbon (TOC)% | 37.73 ± 2.00 | — |
| COD (mg L−1) | 11![[thin space (1/6-em)]](https://www.rsc.org/images/entities/char_2009.gif) 780 ± 56.57 780 ± 56.57 |
182 ± 14.14 |
| pH | _____ | 7.6 |
| Ammonia nitrogen (NH3–N), mg L−1 | 767.2 | 641.2 |
Preliminary tests were conducted before doing the main research to know about the optimum pretreatment chemical dose and optimum pretreatment time intervals that would be used. Four preliminary tests were conducted using urea pretreatment applied for hydrolysis of long chained lignocellulosic compounds in water hyacinth. Organic loading of 65 g L−1 water hyacinth was mixed using distilled water in the ratio of 1![[thin space (1/6-em)]](https://www.rsc.org/images/entities/char_2009.gif) :
:![[thin space (1/6-em)]](https://www.rsc.org/images/entities/char_2009.gif) 10 (w/w) to make a slurry according to the pervious study of ref. 11. Then, the urea solution with a different concentration was added to the slurry to make an optimum concentration for pretreatment ahead of the AD process. This was done by measuring the drop of pH until its changes became approximately constant. This hydrolysis experiment was done using 2%, 3%, 4%, and 6% urea solution based on the dry matter content of water hyacinth. Daily changes in pH were measured to increase the accuracy of preliminary alkaline hydrolysis experimental results. In this study, urea was used as a pretreatment reagent because it has an additional benefit in improving the C/N ratio in AD reactors, increases digestate quality to use as fertilizer, and is less corrosive to the equipment.12
10 (w/w) to make a slurry according to the pervious study of ref. 11. Then, the urea solution with a different concentration was added to the slurry to make an optimum concentration for pretreatment ahead of the AD process. This was done by measuring the drop of pH until its changes became approximately constant. This hydrolysis experiment was done using 2%, 3%, 4%, and 6% urea solution based on the dry matter content of water hyacinth. Daily changes in pH were measured to increase the accuracy of preliminary alkaline hydrolysis experimental results. In this study, urea was used as a pretreatment reagent because it has an additional benefit in improving the C/N ratio in AD reactors, increases digestate quality to use as fertilizer, and is less corrosive to the equipment.12
Based on the preliminary results of the experiment, the optimum pretreatment time and optimum dose of urea suitable to hydrolyze lignin bond was found to be five days and 4% urea. Accordingly, the required amount of urea was dissolved in distilled water prior to the actual experiment. The solution was then added into different 1.5 L anaerobic digesters and thoroughly mixed with water hyacinth in the prepared digesters. These digesters were then sealed and kept in the laboratory at ambient temperature for five days.
2.2 Experimental design
The experimental design of this study was structured to measure the daily base biogas and methane production in an anaerobic reactor while determining substance conversion in lab-scale batch digesters. Based on a ref. 14, 15 g MLSS L−1 inoculum was added to start up the anaerobic digestion system. After transferring the substrate, inoculum, and required amount of dilution, the reactor was closed with a thick butyl rubber stopper, which is held in place by sealing with a hot glue gun to maintain the anaerobic condition. The anaerobic digestion of WH was carried out with the glass bottle reactors having 1.5 L total volume, and the active working volume was 80% of the total volume. The remaining volume of the reactors was left empty. The reactor was worked in mesophilic conditions at 37 ± 1 °C and the hydraulic retention time of the AD process was 45 days. The reactors were flushed with N2 gas for 5 min to create an anaerobic condition inside the digesters, and the digesters were maintained in a temperature-controlled water bath at 37 ± 1 °C. The homogeneity of the substrate was maintained by shaking the reactors manually once per day. The experiment was based on the previous study that showed high mesophilic temperatures had better digestion performance for lignocellulosic substance conversion.15The system was checked for airtightness before starting the experiment in order to prevent the leakage of gas into and out of the reactor system, and it was fed and withdrawn once in the entire reaction period.
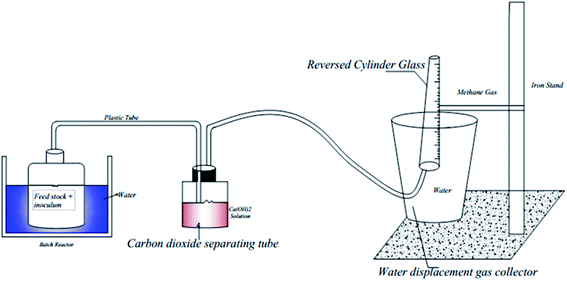
Fig. 2 shows the experimental set-up used to measure the volume of biochemical methane potential in the anaerobic reactor through adsorption of CO2 in alkaline solution; in the reactor, a 1 L graduated measuring cylinder was inverted in the container, and in the intermediate container filled with 0.1 M Ca(OH)2, which traps CO2 to produce CaCO3 precipitate and allow CH4 to pass through the glass bottle having a volume of 1.5 L. Ca(OH)2 was used to trap CO2 because of its economic feasibility and less corrosive nature for the testing environment.
2.3 Analytical methods
The pH and temperature of the substrate and inoculum were measured using Jenway 3510 pH meter, USA and mercury thermometer, Germany, respectively. The analytical procedures for the parameters were based on ref. 16 standard method. The total solids (TS) and total volatile solids (TVS) were gravimetrically determined using the standard method, whereas the measurement of COD was based on the “open reflux, colorimetric method” described in Standard Methods, and also total phosphorous was analyzed using molybdate ascorbic acid method according to ref. 16.Moisture content in the sample was determined gravimetrically by hot air oven-drying at 80 °C, according to ref. 17.
 | (1) |
Analysis of lignocellulosic components was conducted using the direct method adapted from ref. 18. Two g of sample was taken and boiled with ethanol (4 times) for 15 min, after that thoroughly washed with distilled water, and retained in the oven for dry weight at 40 °C overnight, then allocated into two parts in which one part was considered as fraction “A”. The other part of the residue was treated with 24% potassium hydroxide for 4 h at 25 °C, washed thoroughly with distilled water, dried at 80 °C overnight, and the dry weight was taken as fraction “B”. 2 g of samples was taken again and treated with 72% H2SO4 for 3 h to hydrolyze the cellulose and refluxed by 5% H2SO4 for 2 h. Distilled water was used to remove H2SO4 by washing it completely, dried at 80 °C in the oven overnight, and the dry weight was taken as fraction “C”.
| Cellulose = B − C | (2) |
| Hemicellulose = A − B | (3) |
| Lignin = C itself | (4) |
The determination of organic carbon (OC) in the sample was performed using Walkley & Black chromic acid wet oxidation method ref. 19. Total organic carbon content in the sample was determined using eqn (5) as shown below:
 | (5) |
Total nitrogen content was determined by digestion with strong sulfuric acid in the presence of a catalyst within Kjeldahl digestion setup, and ammonium nitrogen was distilled. Ammonium nitrogen was measured using acid titration from the distillate.20
The content of crude protein was determined using the modified micro-Kjeldahl method using the formula below ref. 21.
| Crude protein content (%) = micro-Kjeldahl nitrogen content (%) × 6.25 (based on the assumptions that nitrogen contains 16% of protein) | (6) |
2.4 Biogas measurement techniques
The daily biogas production from each reactor was measured using the liquid displacement method. In this method, the biogas produced is allowed to replace water at an equal volume of water displaced, and this was used to quantify the volume of biochemical methane potential produced daily. The volume of biochemical methane potential was measured using barrier solution through adsorption of CO2 in alkaline solution as shown in Fig. 2, using the method adapted from ref. 22.The method consists of allowing the biogas produced to pass through a 0.1 M Ca(OH)2 solution, which was filled in a separate container in order to capture and convert the CO2 fraction present in the biogas into CaCO3, and then, the measuring cylinder was submerged in a container having the same liquid, inside of the measuring cylinder was attached a plastic tube, which was connected with a separate reactor at the other end through which volumetrically the fraction of methane produced bubbles in the liquid and filled the cylinder, replacing the liquid, and the gas volume can then be read as shown in Fig. 2. Moreover, the cylinder was supported by an iron stand. The amount of liquid replaced corresponds to the volume of methane produced.23 Furthermore, phenolphthalein solution was added to the barrier solution. Phenolphthalein imparts pink color in alkaline solutions, and a change in color indicates whether Ca(OH)2 is available to absorb CO2 or not.22
Once the cumulative biogas and methane production were determined, then the composition of biogas was calculated stoichiometrically as CH4 and CO2 in liters and converted to normalized volume using standard temperature and pressure (STP).24 The CH4 yield was calculated to measure the volume of methane produced relative to the amount of volatile solids added (VS) based on the formula given in (eqn (5)).
 | (7) |
3. Results and discussion
3.1 Continuous trends of biogas, bio-methane, and CO2 production
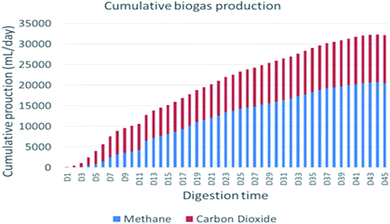
The primary indicator of the quality of biogas is CH4 contents, i.e., higher CH4 content in biogas indicates good quality of biogas produced during AD. In this study, carbon dioxide and the methane contents of the produced biogas were measured daily throughout the digestion period. The biogas composition from WH in this study consisted of 63.2% CH4 and 36.7% CO2, and the methane production potential was higher than reported by a similar study,25 which were 58% CH4 and 42% CO2. This methane production increment is due to the selection of a suitable pretreatment approach using urea before the actual test, so it shows pretreatment of this substrate is important to improve methane production potential, and also it was comparable with H2SO4 pretreated water hyacinth reported by ref. 26, which is 64.38% of methane.Mineralization of lignocellulose takes place in an anaerobic digestion process under complex biochemical conditions. In this work, evaluation of the daily performance of the anaerobic reactor showed that there were irregularities in process routines, which caused fluctuating biogas production trends. Anaerobic digestion of urea pretreated water hyacinth at mesophilic conditions (37 ± 1 °C) was performed to assess continuous gas production trends and related featuring objects during the process. Fig. 3 shows daily biogas production, and Fig. 4 shows cumulative biogas yield of water hyacinth.
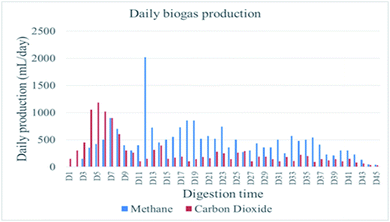 | ||
| Fig. 3 The average daily volume of biogas and methane gas generated from day 1 to day 45 at STP. The experiment was conducted at 37 °C. | ||
The daily biogas production fluctuates during the entire digestion period, and the system achieves biogas production in between two major peak points. The daily biogas production showed rapid increment on the first day to the 5th day and then reached a minor peak point on the 7th day. The change continued, and it decreased from the 8th day to the 11th day before it reached a major peak point on the 12th day, and then it was gradually decreased up to a stable point. More specifically, the first minor peak biogas production (1800 ± 28.28 mL d−1) was recorded on the 7th day of the anaerobic digestion period. However, the reactor performance directly came down after 4 days to the biogas production volume of 500 ± 70.71 mL d−1 on day 11. The good thing was the process recovered quickly from the shocking decrease in biogas production and raised the production up to the major peak point (2170 ± 28.28 mL d−1) of daily biogas production on day 12. The daily methane yield followed the same style in the parallel way like daily biogas production except in the first six days, where the methane production was very slow compared to the rest of the digestion periods. Carbon dioxide is the 2nd abundant gas constituent in biogas produced from AD of lignocellulose.27 In the present study, the composition of CO2 dominated in the initial stage of digestion periods to reach the highest value on day five (1180 mL d−1), but after day 6, the CO2 concentration gradually decreased in biogas and became relatively constant after the 35th day of digestion time.
The cumulative biogas production within the digestion period is shown in Fig. 4. Thus, the biogas production was continued up to 45 days. The total volume of methane gas production within 45 days' digestion period was 12![[thin space (1/6-em)]](https://www.rsc.org/images/entities/char_2009.gif) 000 mL at STP. Whereas the corrected cumulative biogas yield of the experiment was 474.92 (mL g−1 VS−1), while the cumulative methane potential yield of the experiment was 213.92 (mL g−1 VS−1). This result was comparable with a similar study reported by ref. 28, and it was done in the Silpakorn University of Thailand where biogas and methane yields (458.44 L kg−1 of VS and 237.37 L kg−1 VS, respectively) and the components of CH4 and CO2 were 63.2% and 36.7%, respectively, from water hyacinth. The percentage composition of this study is comparable with a similar study reported by ref. 29 with the composition of CH4 and CO2 (68.89% and 29.08%, respectively).
000 mL at STP. Whereas the corrected cumulative biogas yield of the experiment was 474.92 (mL g−1 VS−1), while the cumulative methane potential yield of the experiment was 213.92 (mL g−1 VS−1). This result was comparable with a similar study reported by ref. 28, and it was done in the Silpakorn University of Thailand where biogas and methane yields (458.44 L kg−1 of VS and 237.37 L kg−1 VS, respectively) and the components of CH4 and CO2 were 63.2% and 36.7%, respectively, from water hyacinth. The percentage composition of this study is comparable with a similar study reported by ref. 29 with the composition of CH4 and CO2 (68.89% and 29.08%, respectively).
3.2 Evaluating system sensitivity during anaerobic digestion period
pH is one of the significant parameters used to evaluate the performance of anaerobic microorganisms during the process of bio-methane production. There are different kinds of microbial groups taking parts in the AD process, which have varied optimum pH values for their optimal-growth rates. For example, a pH range of 5.0 to 6.0 is suitable for acidogens, while pH from 6.5 to 8.5 is more convenient for the methanogens group.30 In most cases, pH value generally drops after a few days of microbial incubation. The pH of WH was in the acidic range, whereas inoculum was in the neutral range, so the pH of the substrate was adjusted to the optimum range before AD with 1 N Ca(OH)2 solution.
In this study, pH of the water hyacinth at the initial stage was 5.91, so the initial pH was adjusted before AD by 1 N Ca(OH)2 solution. There was a partial change in the pH value during the digestion period, at the initial AD period, which was in the range of 7.0–7.2. To investigate the system stability, nine additional reactors were arranged in the same condition to check the system sensitivity every five days, discarding one reactor and measuring the sensitive parameters throughout the digestion period.
In the beginning, a slight decrement in pH was shown but the system sustained its stability for methane conversion, and the pH at the end of AD was 7.9. This might be the influence of inoculum and urea pretreatment that played significant roles in sustaining the pH-buffering of the reactor without the addition of alkali to the reactor.
The alkalinity of the anaerobic reactor can be defined as the tendency of the intermediate solutions to maintain stable buffer capacity caused by existing organic acids.31 To achieve the constancy and neutralize VFAs, the total alkalinity of the system must be higher than 2000 mg L−1,32 unless it could affect the action of microbial groups during methane production. In this study, the alkalinity of the system at the beginning was 2200 mg L−1, and it was in the range, but it fluctuated during the digestion period, as shown in Fig. 5.
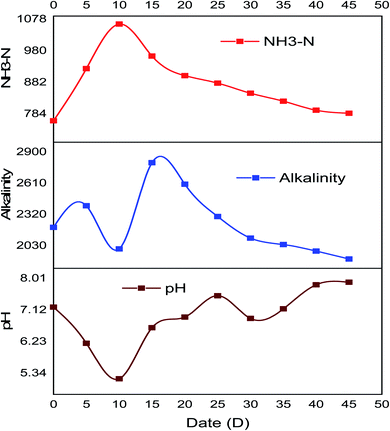 | ||
| Fig. 5 System stability and sensitivity indicating parameters measured every five days during anaerobic digestion periods. | ||
The optimum content of the ammonium ion (as well the ammonia) inside the reactor has a great role in the stability of the AD process. The optimal ammonia concentration increases the stability process by ensuring adequate buffer capacity of the methanogenic medium.33 Due to the use of urea as a pretreatment chemical, it buffers pH drops during digestion periods. In this study, ammonia concentration before AD was 762.5 mg L−1, and it fluctuated during the digestion period and after AD was 785.8 mg L−1, as shown in Fig. 5.
3.3 Characteristics of raw and treated water hyacinth
In this section, the specific characteristics of the starting materials based on dry matter of water hyacinth, inoculum, and the digestate after AD are presented, and then the substance conversion efficiency of the digestion process is discussed. The compositional change of substances in WH before and after urea showed significant changes (Table 4), which indicates the effectiveness of urea pretreatment for the substance degradation.The total solid (TS) and volatile solid (VS) at dry basis of WH and inoculum were 91.9% and 84.82%; and 3.0% and 56%, respectively. Furthermore, the detailed properties of the starting materials are shown in Tables 1 and 2.
| Parameter | Water hyacinth | Literature results | Reported by |
|---|---|---|---|
| Moisture content (%) | 89.31 ± 0.12 | 90.00 ± 5% | 41 |
| Dry matter (DM) (%) | 8.81 ± 0.14 | 8.56 | 26 |
| Total solids of dry basis (%) | 91.90 ± 0.12 | ||
| Total volatile solids (%) as percentage of TS | 84.82 ± 13.04 | 89.13% | 37 |
| Ash content (%) as percentage of TS | 18.49 ± 0.07 | 20.2 | 46 |
| pH | 5.91 ± 1.00 | 5.80 | 41 |
| Cellulose (%) | 25.39 ± 0.73 | 24 | 47 |
| Hemicellulose (%) | 26.89 ± 2.51 | 30 | 47 |
| Lignin (%) | 19.05 ± 2.64 | 16 | 47 |
| Total organic carbon (%) | 37.73 ± 2.00 | 38.4 | 47 |
| C/N | 20.73 ± 1.20 | 25 | 48 |
| Crude protein contents (%) | 11.38 ± 0.70 | 11.8% | 49 |
| Food to microbe ratio, TVS (g kg−1)/inoculum (TVS g kg−1) | 1.51 ± 0.12 | 1.5 | 50 |
| Sodium (%) | 0.78 ± 0.01 | 0.58 ± 0.40 | 18 |
| Potassium (%) | 2.60 ± 0.02 | 2.78 | 47 |
| Calcium (mg L−1) | 32.10 ± 2.20 | — | — |
| Magnesium (mg L−1) | 48.10 ± 4.21 | — | — |
| Chloride (mg L−1) | 728.74 ± 5.89 | — | — |
| Total alkalinity as CaCO3 (mg L−1) | 2200.00 ± 56.50 | — | — |
| Phosphate (PO43−) (%) | 12.00 ± 0.02 | 15.07 | 46 |
| Nitrate-nitrogen (NO3−–N) (%) | 0.37 ± 0.01 | — | — |
| COD (mg L−1) | 11![[thin space (1/6-em)]](https://www.rsc.org/images/entities/char_2009.gif) 780 ± 56.57 780 ± 56.57 |
15![[thin space (1/6-em)]](https://www.rsc.org/images/entities/char_2009.gif) 942 942 |
29 |
The initial physicochemical analysis of the inoculum and substrate are important factors to be analyzed as it influences the overall anaerobic system stability and biogas production.
The high contents of volatile solids and COD of water hyacinth indicate that water hyacinth is favorable for the AD process to biogas production.
Carbon/nitrogen (C/N) is an essential parameter that determines biogas production. The C/N ratio should be in the range of 15 to 30 for biogas production operating at full potential. The carbon/nitrogen ratio of WH in this study was 20.73, and it was found to be in the optimal range for bio-methane production as recommended by ref. 34. This shows that WH collected from Lake Abaya can serve as a sole feedstock for bio-methane production without co-digestion or mixing it with other substrates.
The results showed that the total solids and total volatile solids of the WH were 91.9 ± 0.12 and 84.82 ± 13.04%, respectively. The volatile solid content was higher than the biodegradable range of 75–80% stated by ref. 35. Volatile matter (VM) is the most flammable biomass component.36 This indicates that large content of WH was biodegradable during the AD process, and hence it can serve as an important substrate for bio-methane production. The content of total solids and VS in WH is comparable with a similar study reported by ref. 37, which is 7% and 89.13%, respectively. The contents of total solids and VS of rice straw were 93.90% and 84.31%, respectively, as reported by ref. 38. The ash content of this biomass is the second largest content with the value of 18.49 ± 0.07% in this study. The ash content is influenced by the inorganic elements, which are part of biomass.39 The result obtained in this study was comparable with a similar study reported by ref. 40, which is 20.1%.
Physically, water hyacinth is rich in terms of moisture content. In this study, the moisture content was 89.31 ± 0.12% of its total solids, and it is comparable with a similar study reported by ref. 41, which is 90 ± 5%.
The components of lignocellulosic compounds in WH (lignin, hemicellulose, and cellulose) were measured based on the direct method. From the result, the hemicellulose content is 26.89 ± 2.51%, and hemicellulose is associated with cellulose and contributes to the structural component of the biomass, and cellulose content from the result is 25.39 ± 0.73%. Cellulose is the main structural component in the cell wall, which shows that WH has a good potentiality for biogas production, and it is comparable with a similar study reported by ref. 25, in which the hemicellulose content is 30%, and cellulose content is 24%.
3.4 Substance conversion
The anaerobic digestion process increases the consumption of the feedstock for their metabolic process and development, which decreases the main components of the substrate. The overall removal rates of VS and COD of WH after AD are shown in Table 3. The total solids in the substrate and in the digestate were 91.9% and 4.3%, respectively. The removal efficiency of total solids was 95.3%. The volatile solids in the substrate and in the digestate were 84.82% and 3.3%, respectively. The removal efficiency of volatile solids was 96.1%.| Parameter | After AD | % removal efficiency |
|---|---|---|
| Total solids (%) | 4.30 ± 0.06 | 95.3 |
| Total volatile solids (%) | 3.30 ± 0.11 | 96.1 |
| Cellulose (%) | 1.91 ± 0.09 | 92.5 |
| Hemicellulose (%) | 3.17 ± 0.66 | 88.2 |
| Lignin (%) | 16.59 ± 2.11 | 12.9 |
| Crude protein contents (%) | 0.16 ± 0.02 | 98.6 |
| COD (mg L−1) | 82.00 ± 1.22 | 99.3 |
| Phosphate, PO43− (%) | 5.00 ± 2.02 | 58.3 |
| Nitrate-nitrogen, NO3−–N (%) | 0.23 ± 0.01 | 37.8 |
| Calcium (mg L−1) | 16.03 ± 3.11 | 50.1 |
| Magnesium (mg L−1) | 1.64 ± 0.24 | 96.6 |
| Potassium (%) | 2.10 ± 0.2 | 19.2 |
| Chloride (mg L−1) | 339.40 ± 44.00 | 53.4 |
| Total alkalinity as CaCO3 (mg L−1) | 420.00 ± 11.02 | 80.9 |
| Ammonia nitrogen (NH3–N) (mg L−1) | 641.20 ± 12.03 | 16.4 |
| pH | 7.89 ± 0.01 | — |
| Lignocellulose components | Before pretreatment | After pretreatment |
|---|---|---|
| Cellulose | 25.39 ± 0.73 | 23.41 ± 0.42 |
| Hemicellulose | 26.89 ± 2.51 | 22.67 ± 0.91 |
| Lignin | 19.05 ± 2.64 | 14.24 ± 1.1 |
The removal efficiency of total volatile solids and COD is an essential parameter to determine the stability and efficiency of the AD system. Normally after hydrolysis, cellulose, and hemicellulose of the lignocellulosic substrate are converted into lower molecular mass organic compounds or COD (usually into simple soluble sugars). The higher the removal, the higher the stability of the system.41 In this study, total volatile solid and COD removal efficiencies were 96.1% and 99.3%, respectively. It is indicated that the higher removal rate of COD/TVS had higher methane production.30
The main components of carbonaceous compounds in water hyacinth are cellulose, hemicellulose, and lignin. The effectiveness of the pretreatment applied and AD performance can be evaluated based on the rate of lignocellulose degradation.42 But the hydrolysis and cellulose crystallinity was basically hindered by an unmanageable lignin network. The differences in lignocellulose concentration before and after AD are given in Table 3. The total composition of lignocellulose in water hyacinth was 71.33%. Out of this value, hemicellulose, cellulose, and lignin accounted for 26.89%, 25.39%, and 19.05%, respectively. However, the bio-methane production would be more affected by the accessibility and degradability of hemicellulose, cellulose, and the extent of lignin inter cross-linkage. In the present study, the conversion rate of hemicellulose, cellulose, and lignin were 88.2%, 92.5%, and 12.9%, respectively. The substance conversion efficiency of AD of WH was calculated as per the equation below:
 | (8) |
3.5 Physicochemical characterization of digestate
One of the advantages of anaerobic digestion was the use of digestate as organic fertilizer. As a result, the pH and macronutrients in the digestate from reactors were determined. The pH of the WH digestate after AD was found to be 7.89. The pH of the digestate was between the minimum and maximum accepted values of FAO standard for plant growth, which are 6.0 and 8.5, respectively.All major plant nutrients such as nitrogen, phosphorous, and potassium were retained in the reactor during the AD process. The previous study conducted by ref. 45 has shown that the digestate of WH can be taken as a bio-fertilizer when incorporated into the soil, which increases the performance of plant growth. With high nutrient content, the digestate from AD was considered to be an effective alternative fertilizer and environmentally friendly relating to chemical fertilizer.29
3.6 Bio-fertilizer quality evaluation
Determination of plant responses using WH digestate as bio-fertilizer was managed sideways with the diammonium phosphate (DAP) to tomato vegetable planted in pots and control for comparison.Three different groups were designed, and these were replicated ten times, giving a total of thirty experimental groups. Replication was done to increase the accuracy of the experiment.43 The tomato crop was planted using digestate as organic fertilizer, inorganic fertilizer (DAP), and control. The control treatment was without both bio-fertilizer and DAP application. The performance of water hyacinth as a bio-fertilizer was compared to the chemical fertilizer (DAP). The indicators of physical appearance performance were studied like plant height, the yield of fruit at maturation, and weight of fruits per plant (kg).
The height of the plant increased consistently from week one to week twelve for all the treatments, as shown in Fig. 6. Even though the control had shown the highest increment in height within four weeks, but the stem was very thin and had a probability of breaking compared with both treatments, having an average height of 80 cm. After week four, the treatment (using bio-fertilizer) had shown an increment in growth stage up to 124 cm, and it proved to be more effective with high strength, branched, and high yield than using chemical fertilizer. Application of bio-fertilizer statistically led to improvement of the plant height and strength.
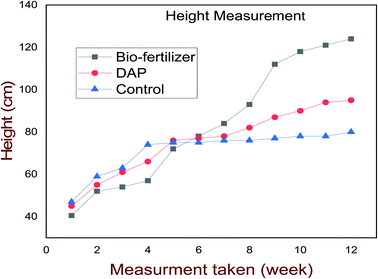 | ||
| Fig. 6 Comparison of the growth performance among bio-fertilizer, DAP, and control on tomato height. | ||
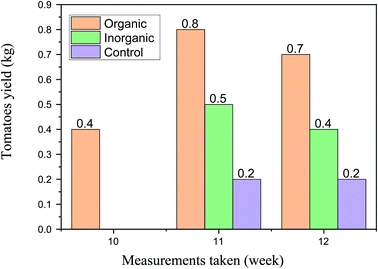
The harvesting stage of the tomato plant started in the 10th week. The average yield of the plant treated by bio-fertilizer per plant was 0.4 kg, whereas the yield of the plant treated with DAP and control started in week eleven. In week eleven, the yields treated with bio-fertilizer, DAP, and neutral were 0.8, 0.5, and 0.2 kg, respectively, per plant and also in week twelve, the yields treated with bio-fertilizer, DAP, and neutral were 0.7, 0.4, and 0.2, respectively, as shown in Fig. 7.
In general, the result related to physical appearance (Fig. 8) and the product yield showed that the application of digestate from water hyacinth significantly influenced the plant height and production yield among the treatment performance of tomato plants in all the parameters evaluated. In general, the performance of the crops using digestate was very good.
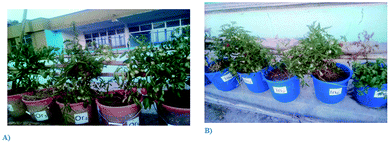 | ||
| Fig. 8 Experimental pots with tomato plants after ten weeks: (A) bio-fertilizer and (B) inorganic fertilizer. | ||
4. Conclusions
Based on the results of this study, it can be concluded that urea pretreated water hyacinth collected from Lake Abaya can be applied as a suitable substrate for anaerobic digestion. The water hyacinth pretreated with 4% urea and solid loading rate of 65 g L−1 of total solid produced cumulative biogas yield of 474.92 mL g−1 VS and cumulative methane yield of 213.92 mL g−1 VS, whereas biogas composition from WH in this study consist of 63.2% CH4 and 36.7% CO2. From the result, the volatile solid content of the WH was 84.82% of TS. The process of anaerobic digestion has converted a significant amount of the raw materials (96.1% of TS and 99.3% of COD) into biogas. Additionally, the digestate used as organic fertilizer produced a higher yield of tomatoes than the inorganic fertilizer. Therefore, this study tried to solve the water hyacinth management problem in Lake Abaya as well as produce renewable sources of energy in the form of biogas and soil-friendly bio-fertilizer.Conflicts of interest
There are no conflicts to declare.Acknowledgements
The authors are thankful to the Arba Minch University Renewable Energy Research Center for funding and all involved individuals for the success of this project.References
- B. Budiyono, I. N. Widiasa, S. Johari and S. Sunarso, The kinetic of biogas production rate from cattle manure in batch mode, World Academy of Science, Engineering and Technology, 2010, 37(1), 983–988, DOI:10.5281/zenodo.1074968.
- M. Rashed, A. Mamun and S. Torii, Removal of H2S and H2O by Chemical Treatment to Upgrade Methane of Biogas Generated from Anaerobic Co-digestion of Organic Biomass Waste, IPASJ International Journal of Mechanical Engineering, 2015, 3(12), 42–52 Search PubMed.
- F. Tasnim, S. A. Iqbal and A. R. Chowdhury, Biogas production from anaerobic co-digestion of cow manure with kitchen waste and Water Hyacinth, Renewable Energy, 2017, 109, 434–439, DOI:10.1016/j.renene.2017.03.044.
- A. K. Forrest, J. Hernandez and M. T. Holtzapple, Effects of temperature and pretreatment conditions on mixed-acid fermentation of water hyacinths using a mixed culture of thermophilic microorganisms, Bioresour. Technol., 2010, 101(19), 7510–7515, DOI:10.1016/j.biortech.2010.04.049.
- B. Sornvoraweat and J. Kongkiattikajorn, Separated hydrolysis and fermentation of water hyacinth leaves for ethanol production, KKU Research Journal, 2010, 15(9), 794–802 Search PubMed . http://resjournal.kku.ac.th/article/15_09_794.pdf.
- E. Ingwani, T. Gumbo and T. Gondo, The general information about the impact of water hyacinth on Aba Samuel dam, Addis Ababa, Ethiopia: Implications for ecohydrologists, Ecohydrol. Hydrobiol., 2010, 10(2–4), 341–345, DOI:10.2478/v10104-011-0014-7.
- I. P. Menbere and T. P. Menbere, Wetland ecosystems in Ethiopia and their implications in ecotourism and biodiversity conservation, J. Ecol. Nat. Environ., 2018, 10(6), 80–96, DOI:10.5897/JENE2017.0678.
- C. C. Gunnarsson and C. M. Petersen, Water hyacinths as a resource in agriculture and energy production: A literature review, Waste Management, 2007, 27(1), 117–129, DOI:10.1016/j.wasman.2005.12.011.
- W. Su, Q. Sun, M. Xia, Z. Wen and Z. Yao, The resource utilization of water hyacinth (Eichhornia crassipes [Mart.] Solms) and its challenges, Resources, 2018, 7(3), 46, DOI:10.3390/resources7030046.
- Y. N. Guragain, J. De Coninck, F. Husson, A. Durand and S. K. Rakshit, Comparison of some new pretreatment methods for second generation bioethanol production from wheat straw and water hyacinth, Bioresour. Technol., 2011, 102(6), 4416–4424, DOI:10.1016/j.biortech.2010.11.125.
- J. Li, A. C. Wachemo, H. Yuan, X. Zuo and X. Li, Evaluation of system stability and anaerobic conversion performance for corn stover using combined pretreatment, Waste Management, 2019, 97, 52–62, DOI:10.1016/j.wasman.2019.07.025.
- Z. Xie, H. Zou, Y. Zheng and S. F. Fu, Improving anaerobic digestion of corn straw by using solid-state urea pretreatment, Chemosphere, 2022, 293, 133559, DOI:10.1016/j.chemosphere.2022.133559.
- S. Astals, K. Koch, S. Weinrich, S. D. Hafner, S. Tait and M. Peces, Impact of storage conditions on the methanogenic activity of anaerobic digestion inocula, Water, 2020, 12(5), 1–12, DOI:10.3390/W12051321.
- S. Azizi, I. Kamika and M. Tekere, Evaluation of the digestibility of attached and suspended growth sludge in an aerobic digester for a small community, Water, 2018, 10(2), 161, DOI:10.3390/w10020161.
- X. Guo, K. Kang, G. Shang, X. Yu, L. Qiu and G. Sun, Influence of mesophilic and thermophilic conditions on the anaerobic digestion of food waste: Focus on the microbial activity and removal of long chain fatty acids, Waste Manage. Res., 2018, 36(11), 1106–1112, DOI:10.1177/0734242X18801195.
- APHA, Standard Methods for the Examination of Water and Wastewater, 21st edn, American Public Health Association/American Water Works Association/Water Environment Federation, Washington DC, 2005 Search PubMed.
- B. C. O'Kelly, Accurate Determination of Moisture Content of Organic Soils Using the Oven Drying Method, Drying Technol., 2004, 22(7), 1767–1776, DOI:10.1081/DRT-200025642.
- D. Brindha, S. Vinodhini, K. Alarmelumagai and N. S. Malathy, Physico-chemical properties of fibers from banana varieties after scouring, Indian Journal of Fundamental and Applied Life Sciences, 2012, 2(1), 217–221 Search PubMed.
- E. V. Shamrikova, B. M. Kondratenok and E. A. Tumanova, Transferability between soil organic matter measurement methods for database harmonization, Geoderma, 2022, 412, 115547, DOI:10.1016/j.geoderma.2021.115547.
- M. Zaklouta, M. Hilali El-Dine, A. Nefzaoui and H. Mohammad, Animal Nutrition and Product Quality Laboratory Manual International Center for Agricultural Research in the Dry Areas, 2011 Search PubMed.
- H. K. Mæhre, L. Dalheim, G. K. Edvinsen, E. O. Elvevoll and I. J. Jensen, Protein determination method matters, Foods, 2018, 7(1), 5, DOI:10.3390/foods7010005.
- P. Thapa, Anaerobic Conversion of Glycol Rich Industrial Wastewater to Biogas, June 2012 Search PubMed.
- T. Selvankumar, C. Sudhakar and M. Govindaraju, Process optimization of biogas energy production from cow dung with alkali pre-treated coffee pulp, 3 Biotech., 2017, 7(4), 1–8, DOI:10.1007/s13205-017-0884-5.
- M. Y. Nurliyana, P. S. H'ng and H. Rasmina, et al., Effect of C/N ratio in methane productivity and biodegradability during facultative co-digestion of palm oil mill effluent and empty fruit bunch, Ind. Crops Prod., 2015, 76, 409–415, DOI:10.1016/j.indcrop.2015.04.047.
- V. P. Rathod, P. V. Bhale and R. S. Mehta, Biogas Production from Water Hyacinth in the Batch type Anaerobic Digester, Mater. Today: Proc., 2018, 5(11), 23346–23350, DOI:10.1016/j.matpr.2018.11.072.
- S. Sarto, R. Hildayati and I. Syaichurrozi, Effect of chemical pretreatment using sulfuric acid on biogas production from water hyacinth and kinetics, Renewable Energy, 2019, 132, 335–350, DOI:10.1016/j.renene.2018.07.121.
- C. Liu, J. Liu and G. Sun, et al., Thermogravimetric analysis of (co-)combustion of oily sludge and litchi peels: combustion characterization, interactions and kinetics, Thermochim. Acta, 2018, 667, 207–218, DOI:10.1016/j.tca.2018.06.009.
- T. Hudakorn and N. Sritrakul, ScienceDirect Biogas and biomass pellet production from water hyacinth, Energy Reports, 2020, 6, 532–538, DOI:10.1016/j.egyr.2019.11.115.
- Y. Unpaprom, T. Pimpimol, K. Whangchai and R. Ramaraj, Sustainability assessment of water hyacinth with swine dung for biogas production, methane enhancement, and biofertilizer, Biomass Convers. Biorefin., 2021, 11(3), 849–860, DOI:10.1007/s13399-020-00850-7.
- R. Guan, X. Li and A. C. Wachemo, et al., Enhancing anaerobic digestion performance and degradation of lignocellulosic components of rice straw by combined biological and chemical pretreatment, Sci. Total Environ., 2018, 637–638, 9–17, DOI:10.1016/j.scitotenv.2018.04.366.
- F. Raposo, C. J. Banks, I. Siegert, S. Heaven and R. Borja, Influence of inoculum to substrate ratio on the biochemical methane potential of maize in batch tests, Process Biochem., 2006, 41(6), 1444–1450, DOI:10.1016/j.procbio.2006.01.012.
- T. Zhao, Y. Chen and Q. Yu, Enhancement of performance and stability of anaerobic co-digestion of waste activated sludge and kitchen waste by using bentonite, PLoS One, 2019, 14(7), 1–20, DOI:10.1371/journal.pone.0218856.
- A. Nsair, S. O. Cinar, A. Alassali, H. A. Qdais and K. Kuchta, Operational Parameters of Biogas Plants: A Review and Evaluation Study, Energies, 2020, 13(15), 3761, DOI:10.3390/en13153761.
- R. Chandra, H. Takeuchi and T. Hasegawa, Methane production from lignocellulosic agricultural crop wastes: a review in context to second generation of biofuel production, Renewable Sustainable Energy Rev., 2012, 16(3), 1462–1476, DOI:10.1016/j.rser.2011.11.035.
- A. M. Asnakew, Characterisation Peal of Fruit and Leaf of Vegetable Waste with Cow Dung for Maximizing the Biogas Yield, Int. J. Energy Power Eng., 2017, 6(2), 13, DOI:10.11648/j.ijepe.20170602.12.
- D. K. Shen, S. Gu, K. H. Luo, A. V. Bridgwater and M. X. Fang, Kinetic study on thermal decomposition of woods in oxidative environment, Fuel, 2009, 88(6), 1024–1030, DOI:10.1016/j.fuel.2008.10.034.
- T. Kunatsa, L. Madiye, T. Chikuku, C. Shonhiwa and D. Musademba, Feasibility Study of Biogas Production from Water Hyacinth, Int. J. Eng. Technol., 2013, 3(2), 119–128 Search PubMed.
- A. Chufo, H. Tong, H. Yuan, X. Zuo, R. Mustafa and X. Li, Science of the total environment continuous dynamics in anaerobic reactor during bioconversion of rice straw: rate of substance utilization, biomethane production and changes in microbial community structure, Sci. Total Environ., 2019, 687, 1274–1284, DOI:10.1016/j.scitotenv.2019.05.411.
- C. Liu, J. Liu and G. Sun, et al., Thermogravimetric analysis of (co-)combustion of oily sludge and litchi peels: combustion characterization, interactions and kinetics, Thermochim. Acta, 2018, 667, 207–218, DOI:10.1016/j.tca.2018.06.009.
- B. Feedstock, S. Sukarni, Y. Zakaria, S. Sumarli and R. Wulandari, Physical and Chemical Properties of Water Hyacinth (Eichhornia crassipes) as a Sustainable Physical and Chemical Properties of Water Hyacinth (Eichhornia crassipes) as a Sustainable Biofuel Feedstock, 2019, doi: DOI:10.1088/1757-899X/515/1/012070.
- V. Bharati and A. S. Kalamdhad, Biogas production from water hyacinth in a novel anaerobic digester: a continuous study, Process Saf. Environ. Prot., 2019, 127, 82–89, DOI:10.1016/j.psep.2019.05.007.
- J. MacLellan, R. Chen, R. Kraemer, Y. Zhong, Y. Liu and W. Liao, Anaerobic treatment of lignocellulosic material to co-produce methane and digested fiber for ethanol biorefining, Bioresour. Technol., 2013, 130, 418–423, DOI:10.1016/j.biortech.2012.12.032.
- M. A. Abebe, Characterization of Sludge from a Biogas Reactor for the Application Bio-Fertilizer, International Journal of Scientific Engineering and Science, 2017, 1(3), 12 Search PubMed . http://ijses.com/.
- S. Govere, B. Madziwa and P. Mahlatini, The Nutrient Content of Organic Liquid Fertilizers in Zimbabwe The Nutrient Content of Organic Liquid Fertilizers in Zimbabwe, May 2018 Search PubMed.
- K. Blessy and M. Lakshmi Prabha, Application of water hyacinth vermicompost on the growth of Capsicum annum, Int. J. Pharma Sci. Res., 2014, 5(05), 198–203 Search PubMed.
- V. Patel, M. Desai and D. Madamwar, Thermochemical pretreatment of water hyacinth for improved biomethanation, Appl. Biochem. Biotechnol., 1993, 42(1), 67–74, DOI:10.1007/BF02788902.
- V. P. Rathod, P. V. Bhale, R. S. Mehta, K. Harmani, S. Bilimoria, A. Mahida and H. Champaneri, ScienceDirect Biogas Production from Water Hyacinth in the Batch type Anaerobic Digester, Mater. Today: Proc., 2018b, 5(11), 23346–23350, DOI:10.1016/j.matpr.2018.11.072.
- B. A. Adelekan and A. I. Bamgboye, Comparison of biogas productivity of cassava peels mixed in selected ratios with major livestock waste types, Afr. J. Agric. Res., 2009, 4(7), 571–577 Search PubMed.
- E. V. Casas, J. G. Raquid, K. F. Yaptenco and E. K. Peralta, Optimized drying parameters of water hyacinths (Eichhornia crassipes. L), Sci. Diliman, 2012, 24(2), 28–49 Search PubMed.
- V. B. Barua and A. S. Kalamdhad, Anaerobic biodegradability test of water hyacinth after microbial pretreatment to optimise the ideal F/M ratio, Fuel, 2018, 217, 91–97, DOI:10.1016/j.fuel.2017.12.074.
| This journal is © The Royal Society of Chemistry 2022 |

