 Open Access Article
Performance study of μDMFC with foamed metal cathode current collector
Fan Zhang a,
Yanhui Zhang
 a,
Chuan Luoa,
Dacheng Zhangab and
Zhengang Zhao
 *ab
*ab
aFaculty of Information Engineering and Automation, Kunming University of Science and Technology, Kunming 650500, China. E-mail: zhaozhengang@kust.edu.cn
bYunnan Key Laboratory of Green Energy, Electric Power Measurement Digitalization, Control and Protection, Kunming, China
First published on 2nd February 2022
Abstract
Micro Direct Methanol Fuel Cells (μDMFCs) often have application in moveable power due to their green and portable nature. In a μDMFC's structure, a current collector of the μDMFC needs to have high corrosion resistance such that the μDMFC can work for a long time in a redox reaction and respond to variable environmental conditions. To this end, four cathode current collectors were prepared. The materials selected were foam stainless steel (FSS) and foam titanium (FT), with fields of hole type and grid type. The performance of μDMFC with different cathode collector types was investigated by I–V–P polarization curves, Electrochemical Impedance Spectroscopy (EIS), and discharge test. The experimental results show that the maximum power density of the hole-type FSS cathode current collector μDMFC (HFSS-μDMFC) is 49.53 mW cm−2 at 70 °C in the methanol solution of 1 mol L−1, which is 70.15% higher than that of the hole-type FT cathode current collector μDMFC (HFT-μDMFC). The maximum power density of the grid-type FSS cathode current collector μDMFC (GFSS-μDMFC) is 22.60 mW cm−2, which is 11.99% higher than that of the grid-type FT cathode current collector μDMFC (GFT-μDMFC). The performance of the HFSS-μDMFC is optimal in the methanol solution of 1 mol L−1.
1 Intorduction
A μDMFC is a portable and removable power source while it has high energy conversion efficiency, simple structure, easy operating conditions, low pollution, and is economical.1–3 It relies on the conversion of chemical energy of redox reactions into electrical power. In this process, the function of the current collector is to distribute the reaction gases and collect the incoming electrons. Therefore, the current collector material should have high electrical conductivity, corrosion resistance, hydrophobicity, permeability, etc.4–6 The different materials and field structures have a significant impact on the performance of the μDMFC. Researchers did a lot on the materials and flow field structures of this. In 2000, Makkus et al.7 prepared a stainless steel collector plate, and the experimental results showed that contamination occurs between the stainless steel collector and the membrane electrode assembly (MEA) on the anode side. In 2010, Zhang et al.8 designed an experiment using titanium-coated stainless steel as a collector plate, and the TiN coating could reduce corrosion and contact resistance. In 2018, Li et al.9 used stainless steel to prepare a current collector for fuel cells with improved discharge stability. In 2021, Choi et al.10 proposed a Gas Diffusion Layer (GDL) of FT as an anode and improved the performance of the cells in accelerated corrosion tests. Stainless steel and titanium are thus highly represented in the preparation of collector plates. To further enhance the performance of fuel cells, many scholars have used foam metals to prepare current collectors. In 2003, Kumar et al.11 used foam metals to prepare bipolar plates for fuel cells and investigated the effect of foam metal permeability on fuel cell performance. In 2018, Park et al.12 used graphene foam metals to prepare current collectors and investigated their effect on mass transport of reactants and products. The experimental results showed that graphene foam metal collectors exhibited lower mass-transport resistance than conventional collectors. In 2018, Shin et al.13 embedded foam metals in collectors, which significantly enhanced the maximum power of fuel cells. In 2021, Sun et al.14 used foam metals to prepare collectors and demonstrated that foam metals have great potential for battery applications. Also, scholars have studied the flow field extensively. In 2010, Spernjak et al.15 investigated the effect of different flow fields on the cell performance. The experimental results showed that the serpentine flow field had a more stable output, and the parallel and staggered flow fields exhibited a higher water content and lower differential pressure. To improve the performance of μDMFC, the researchers tried many fields in collectors. In 2012, Friess et al.16 designed a radial flow field structure, and the cell with this structure outperformed the cell with parallel flow field structure under the same experimental conditions. In 2013, Guo et al.17 prepared an optimized needle flow field and improved the performance of the cells by this design. In 2019, Wilberforce et al.18 investigated the performance of the cells with different flow field structures. The type of flow field is related to the mass transfer and current density of the cell. Thus, it is important to choose a suitable flow field.19,20In summary, stainless steel and titanium have good potential for current collector fabrication. Also, foam metals can effectively increase the oxygen transport channels and the reaction area in the cathode collector. And the wettability of the collector material directly affects the performance of μDMFC. Therefore, the material selections are hydrophilic FT and hydrophobic FSS for preparing the cathode collector. In this study, four μDMFC with different cathode collectors (HFSS-μDMFC, GFSS-μDMFC, HFT-μDMFC, and GFT-μDMFC) were assembled. The performance of the μDMFC was evaluated by I–V–P polarization curves, EIS, and discharge test. Finally, the influence of material, wettability, and flow field on cathode gas–liquid flow were analyzed to find a suitable cathode current collector.
2 Materials and methods
2.1 μDMFC structure
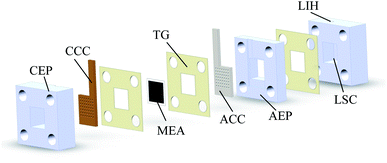
μDMFC consists of Cathode Current Collector (CCC), Anode Current Collector (ACC), Membrane Electrode Assembly (MEA), Teflon Gaskets (TG), Cathode Extremity Plate (CEP) and Anode Extremity Plate (AEP), and Liquid Storage Cavity (LSC).21 The chemical reaction equation within μDMFC is as follows,total chemical reaction:
 | (1) |
anode reaction:
| CH3OH + H2O → CO2 + 6H+ + 6e− | (2) |
cathodic reaction:
 | (3) |
As shown in Fig. 1, to observe the internal reaction of μDMFC during operation, the CEP, AEP, and the LSC are prepared from acrylic plates. Its open window frame is 1.44 cm2. The effective liquid storage area of LSC is 2.5 cm3 and the effective area of the MEA is 1 cm2. The TG is placed between the LSC and the AEP to prevent methanol liquid leakage from the reservoir chamber. The TG is placed between the current collector and the MEA to make close contact and prevent the methanol liquid on the anode side leak to the cathode. The AEP and CEP press the current collector closely to the MEA to reduce its contact resistance. A 3 mm diameter Liquid Injection Hole (LIH) is located above the LSC for liquid injection and CO2 venting.22
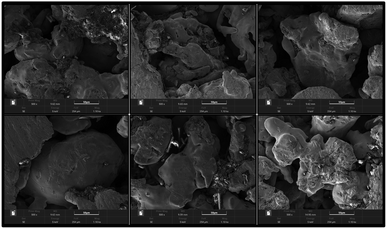
For the MEA preparation, the proton exchange membrane of choice is Nafion 117 (DuPont, Wilmington, DE, USA). The anode catalyst is 50% Pt and 25% Ru, and the cathode catalyst was 60% Pt. The catalyst loadings for the anode and cathode are 4 mg cm−2 and 2 mg cm−2, respectively. Finally, the carbon paper with catalyst is hot-pressed together with the proton exchange membrane to obtain the MEA. For the CCC preparation, the selected materials are FSS and FT to prepare the cathode collector.23 The foam metal is sintered under vacuum conditions using the powder metallurgy method. Their surface form is shown in Fig. 2. It can be seen that the foam metal has a three-dimensional porous structure, which can provide a path to solutions for problems in materials and flow fields.24–27 Further, the sintered foam metal is cleaned and placed on the laser cutting platform (Model 6060L to 1000W) to cut according to the design. Finally, different types of foam metal CCC are prepared.
The opening ratio of the cathode collector is calculated as follows:
 | (4) |
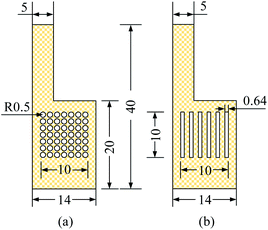 | ||
| Fig. 3 Specification and flow field structure of cathode collector, unit: mm. (a) Hole type (b) grid type. | ||
2.2 Preparation and experiment of μDMFC
For the μDMFC preparation:22(1) Milled the LSC, AEP, and CEP. Then, cut the TG according to the endplate shape. Cut the foam metal plate according to the cathode current collector and the flow field size. Finally, polish the surface of the current collector smoothly.
(2) Put the processed parts of μDMFC into the ultrasonic cleaning machine and ultrasonically clean them with CH3OH, C2H5OH, and deionized water in turn for 15 min to remove the oil on the surface. Then, put them into the oven at 100 °C to dry.
(3) Place a TG between the LSC and the AEP, between the MEA and the endplate to prevent fuel leakage and provide support protection for the MEA.
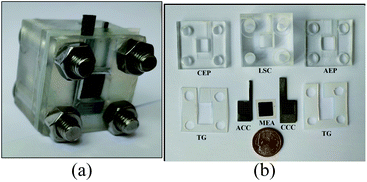
(4) Assembled the μDMFC and fixed it with screws to obtain μDMFC, as shown in Fig. 5.
The four different types of μDMFC were HFT-μDMFC, HFSS-μDMFC, GFT-μDMFC, and GFSS-μDMFC. They use the same components. A hydraulic press is used to control the pressure of the battery assembly.
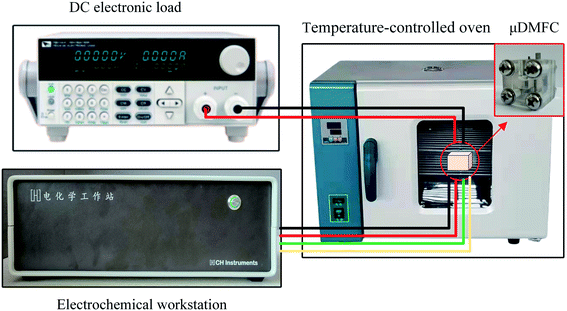
The test setup in this study consists of a DC electronic load (Model IT8511A+), an electrochemical workstation (Model CHI660E), and a temperature-controlled oven, as shown in Fig. 6. The test temperature is 70 °C.
During the experiment, the μDMFC was placed in a oven. The electronic load was attached to the cathode and anode of μDMFC. The three electrodes of the electrochemical workstation were respectively to the cathode and anode of μDMFC according to the actual test needs. The DC electronic load was used to discharge test the μDMFC and record the voltage–current data. The electrochemical workstation was used to test the EIS and record the related data.
3 Results and discussion
3.1 Analysis of polarization characteristics
To investigate the effect of four different types of cathode current collectors on the performance of μDMFC. The power density tests of μDMFC with various concentrations of methanol solutions (0.5–5 mol L−1) were carried out at 70 °C. Their polarization curves are as in Fig. 7.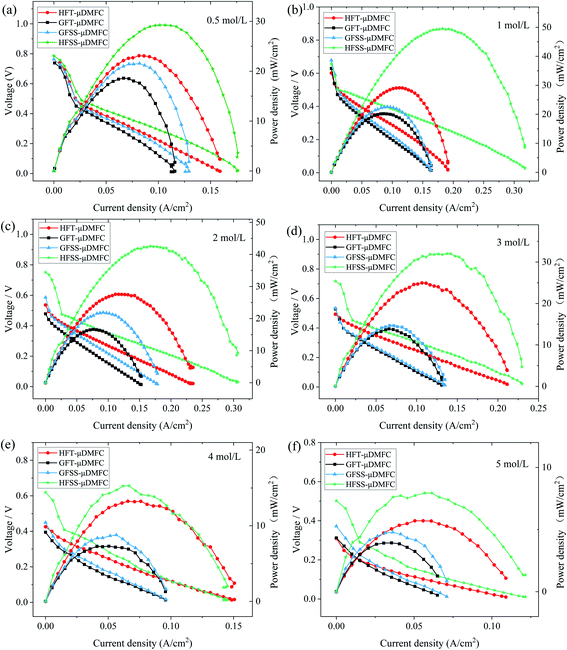 | ||
| Fig. 7 Polarization curves of μDMFC at different methanol solution concentrations. (a) 0.5 mol L−1 (b) 1 mol L−1 (c) 2 mol L−1 (d) 3 mol L−1 (e) 4 mol L−1 (f) 5 mol L−1. | ||
The power density, current density, and operating voltage of the FSS μDMFC are higher than those of the FT μDMFC at methanol concentrations of 0.5 mol L−1 to 5 mol L−1. The electrochemical and ohmic polarization of μDMFC for four cathode current collectors is essentially the same at low concentrations of methanol solution. The concentration difference polarization of μDMFC with FSS cathode collectors is superior to that of μDMFC with FT cathode collectors. Differences in polarization properties appear with the increasing concentration of methanol solution. As the concentration increases, the power density of μDMFC increases and then decreases.
The difference in the concentration polarization of μDMFC for the four cathode collectors at 0.5–1 mol L−1 methanol solution appeared. This is because of an increase in the reaction rate at the high potential region, resulting in insufficient oxygen supply. The electrochemical polarization, ohmic polarization, and concentrated polarization of μDMFC for four cathodic current collectors at 2–5 mol L−1 methanol solution concentrations are different. At the low potential region, the electrochemical polarization of FSS μDMFC is less. It indicates that the molecular activation performance of FSS μDMFC is better than that of FT μDMFC. The concentration polarization of the hole-type flow field μDMFC at the methanol concentration of 3–5 mol L−1 was significantly smaller than that of the grid-type flow field μDMFC.
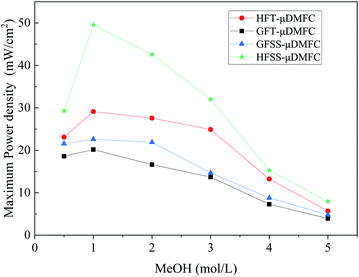
The power densities of μDMFC with different types of cathode current collectors at various methanol concentration solutions are shown in Table 1 and Fig. 8. The maximum power density of HFSS-μDMFC is 49.53 mW cm−2 at 70 °C in 1 mol L−1 methanol solution concentration, which is 70.15% higher than that of HFT-μDMFC and 119.16% higher than that of GFSS-μDMFC. The maximum power density of GFSS-μDMFC is 22.60 mW cm−2, which is 11.99% higher than that of GFT-μDMFC. HFT-μDMFC achieves a maximum power density of 29.11 mW cm−2, which is 44.25% higher than that of GFT-μDMFC. It implies that, under the same flow field structure, the performance of the FSS μDMFC is better than that of the FT μDMFC. Under the same collector plate material, the performance of the hole-type flow field μDMFC is better than that of the grid-type flow field μDMFC. In addition, compared to previously published work, the μDMFC in this study has some enhancements in terms of maximum power density, as shown in Table 2.
| Concentration (mol L−1) | HFT-μDMFC (mW cm−2) | GFT-μDMFC (mW cm−2) | HFSS-μDMFC (mW cm−2) | GFSS-μDMFC (mW cm−2) |
|---|---|---|---|---|
| 0.5 | 23.11 | 18.61 | 29.26 | 21.55 |
| 1 | 29.11 | 20.18 | 49.53 | 22.60 |
| 2 | 27.58 | 16.63 | 42.56 | 21.89 |
| 3 | 24.89 | 13.69 | 32.01 | 14.66 |
| 4 | 13.23 | 7.29 | 15.29 | 8.78 |
| 5 | 5.70 | 3.93 | 7.94 | 4.78 |
The power density of the HFSS-μDMFC at the methanol solution concentrations of 0.5–5 mol L−1 is the highest, and the GFT-μDMFC is the lowest. At 0.5–1 mol L−1 methanol solution, the power density enhancement of the hole-type flow field μDMFC is significantly higher than that of the grid-type flow field μDMFC. As the concentration of methanol solution increases, the power density of μDMFC starts to decrease. The main reason is that as the concentration of methanol solution increases, the electrochemical reaction rate and the methanol permeation increase,35–37 resulting in the power density of the μDMFC decreasing. The decrease of the power density of the μDMFC is more visible at 1–4 mol L−1 methanol solution. And the μDMFC is more alleviated at 4–5 mol L−1 methanol solution. High methanol solution concentration destroys less for the power density of the μDMFC. This indicates that the excess methanol permeation severely affects the reduction reaction on the cathode side of μDMFC.
3.2 Analysis of electrochemical impedance spectroscopy
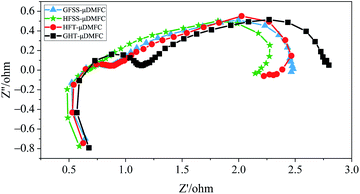
To further investigate different flow field structures and materials, the EIS measurements of the μDMFC at 70 °C in a methanol solution concentration of 1 mol L−1 were performed.38,39 Fig. 9 gives the EIS at a discharge current density of 80 mA cm−2. In the EIS, the size of the semicircular in the high-frequency region indicates the magnitude of the Charge Transfer Resistance (CTR) of the μDMFC. The larger this semicircular is, the greater the CTR.14 The size of the semicircular in the low-frequency region indicates the magnitude of the mass transfer impedance of the μDMFC. The larger the semicircular is, the higher the mass transfer impedance. In other words, the CTR and mass transfer impedance is small, the corresponding semicircular almost disappears.40In the Nyquist plot, the total impedance of the HFSS-μDMFC is the smallest, and the GFT-μDMFC is the largest. The CTR of HFSS-μDMFC is the smallest, and the GFT-μDMFC is the largest. The total impedance of the GFSS-μDMFC is higher than that of the HFT-μDMFC, but the CTR is the same. The transfer impedance of the HFSS-μDMFC is lower than that of the HFT-μDMFC. The transfer impedance of the GFSS-μDMFC is lower than the GFT-μDMFC.
Under the same flow field structure, the total impedance of the FSS μDMFC is smaller than that of the FT μDMFC. Among them, the difference in the CTR between the FSS cathode collector μDMFC and the FT cathode collector μDMFC is higher. But the difference in transfer impedance is lower. It is mainly because the charge transfer conductivity of the FSS is higher than that of the FT. The value of the interfacial capacitance due to the charge accumulation effect at the interface between the electrode substrate and electrolyte affects the CTR. The larger the interfacial capacitance, the greater the CTR. The larger the CTR value, the more severe the polarization during the electrode reaction,35 and the polarization loss of the FT is greater than that of the FSS. The selected current collectors all have a three-dimensional porous structure with the same effective opening ratio, but the contact angle of FT is lower than that of FSS. At a discharge process, the water generated by the cathode is easily infiltrated into the microporous structure of the FT, which reduces the oxygen channel of the cathode and increases the impedance in the oxygen mass transfer process. It implies that the oxygen transfer rate of μDMFC of the FSS cathode current collector is better than that of the FT cathode current collector. The FSS has better hydrophobicity, the H2O produced by the cathode being less to clog the micropores on the current collector. But the experiment is conducted at 70 °C, the water is easy to volatilize, resulting in the phenomenon of clogging the microporous is alleviated. Then, the difference is reduced between the mass transfer impedance of the FT cathode collector μDMFC and the FSS cathode collector μDMFC. The HFSS-μDMFC has the highest velocity constant and the charge conduction reaction rate. The high-frequency semicircular arc of the HFSS-μDMFC disappears. It implies that the charge reaction rate is faster than the mass transfer rate. At this moment, the porous dynamics process is dominated by diffusion processes.
Under the same material, the total impedance of the hole-type flow field μDMFC is smaller than that of the grid-type flow field μDMFC. This is because the oxygen transfer rate of the hole-type flow field μDMFC is better than that of the grid-type flow field μDMFC. The hole-type flow field has more even oxygen distribution.41–43 The hole-type flow field is more suitable than the cathode flow field structure. Among them, the CTR and mass transfer impedance of the hole-type flow field μDMFC are smaller than those of the grid-type flow field μDMFC. The flow field of the hole-type is distributed more uniformly.22 It causes the distribution of the electrochemical reaction area and the charge conduction reaction to be greater. Compared with the grid-type flow field, the cathode oxygen distribution in the hole-type flow field is more uniform, resulting in the oxygen transfer process having less resistance.
3.3 Constant current discharge
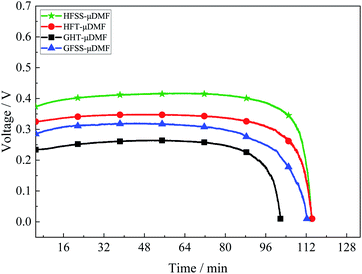
A constant current discharge test was conducted at a current density of 80 mA cm−2, and the test results are as in Fig. 10. The experimental temperature was 70 °C, the volume of methanol solution was 2 ml, and the concentration was 1 mol L−1.At the discharge process, the losses at the same current density are different due to the different total impedance magnitudes of the μDMFC, resulting in different durations.
The HFSS-μDMFC has the highest discharge voltage and the longest discharge duration, and the GFT-μDMFC has the lowest discharge voltage and the lowest discharge duration. The total impedance of the GFT-μDMFC during the discharge process is highest while the duration and voltage are lowest. It is mainly because the GFT-μDMFC has a higher loss due to impedance. The total impedance of HFSS-μDMFC is the least, the loss due to impedance is lower, the longest discharge time and the highest voltage during the discharge process. The voltage and duration of the HFT-μDMFC during the discharge process are better than those of the GFSS-μDMFC. The total impedance and CTR of the HFT-μDMFC and the GFSS-μDMFC are the same, and the difference in transfer impedance is higher slightly. During the discharge process, the transfer loss of the GFSS-μDMFC is higher due to the influence of the cathode on the oxygen mass transfer efficiency of the current collector. Thus, the voltage and duration of the HFT-μDMFC during the discharge process are better than those of the GFSS-μDMFC.
4 Conclusions
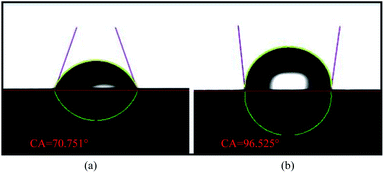
In this work, the effects of different types of cathode current collectors on the performance of the μDMFC were investigated. The impact of various materials and flow field structures on the gas–liquid two-phase flow of the μDMFC cathodes were analyzed by performing polarization characteristics, EIS, and constant current discharge test on the μDMFC.For both materials, the FSS has a contact angle of 96.525°, which is hydrophobic, and the FT has a contact angle of 70.751°, which is hydrophilic. The maximum power density of the HFSS-μDMFC is 49.53 mW cm−2, which is 70.15% higher than that of the HFT-μDMFC. The maximum power density of the GFSS-μDMFC is 22.60 mW cm−2, which is 11.99% higher than that of the GFT-μDMFC. The hydrophobic FSS prevents water generated by the cathode from adhering to the foam metal. This reduces the concentration polarization and mass transfer impedance and enhances the oxygen transfer rate.
For both flow fields, the maximum power density of the HFSS-μDMFC is 119.16% higher than that of the GFSS-μDMFC. The maximum power density of the HFT-μDMFC is 44.25% higher than that of the GFT-μDMFC. The hole-type flow field has a more uniform structural distribution and oxygen distribution. This improves the effective current collection efficiency of the cathode collector. During the discharge process, the HFSS-μDMFC has the highest discharge voltage and the longest discharge duration. By reducing the total impedance of the μDMFC, energy losses can be reduced, thus improving the μDMFC performance.
Author contributions
Conceptualization; Zhengang Zhao and Fan Zhang; methodology, Zhengang Zhao and Fan Zhang; software, Fan Zhang and Yanhui Zhang; validation, Fan Zhang and Yanhui Zhang; formal analysis, Dacheng Zhang; investigation, Fan Zhang and Yanhui Zhang; resources, Zhengang Zhao and Dacheng Zhang; data curation, Fan Zhang; writing – original draft preparation, Fan Zhang and Yanhui Zhang; writing – review and editing, Zhengang Zhao and Dacheng Zhang; visualization, Chuan Luo; supervision, Zhengang Zhao and Dacheng Zhang; project administration, Zhengang Zhao and Dacheng Zhang; funding acquisition, Zhengang Zhao and Dacheng Zhang.Conflicts of interest
There are no conflicts to declare.Acknowledgements
This work is partly supported by National Natural Science Foundation of China (Grant No. 62162035, 62103174) and Applied Basic Foundation of Yunnan Province (Grant No. 202001AU070046, 202101AT070131).Notes and references
- B. M. Sudaroli and A. K. Kolar, Energy, 2016, 98, 204–214 CrossRef CAS.
- G. Ramasamy and S. Somasundaram, Processes, 2020, 8, 796 CrossRef.
- T. Noor, S. Pervaiz, N. Iqbal, H. Nasir and E. Pervaiz, Nanomaterials, 2020, 10, 1601 CrossRef CAS PubMed.
- C. E. Damian-Ascencio, A. Saldaa-Robles, A. Hernandez-Guerrero and S. Cano-Andrade, Energy, 2017, 133, 306–316 CrossRef CAS.
- L. Rostami, P. Nejad and A. Vatani, Energy, 2016, 97, 400–410 CrossRef CAS.
- M. Herranen, U. Wiklund, J. O. Carlsson and S. Hogmark, Surf. Coat. Technol., 1998, 99, 191–196 CrossRef CAS.
- R. C. Makkus, A. Janssen, F. Bruijn and R. Mallant, J. Power Sources, 2000, 86, 274–282 CrossRef CAS.
- D. Zhang, L. Duan, G. Lu and W. H. Tuan, Int. J. Hydrogen Energy, 2010, 35, 3721–3726 CrossRef CAS.
- L. Yang, X. Zhang, W. Yuan, Y. Zhang and X. Liu, Energy, 2018, 157, 599–607 CrossRef.
- H. Choi, O. H. Kim, M. Kim, H. Choe, Y. H. Cho and Y. E. Sung, ACS Appl. Mater. Interfaces, 2014, 6, 7665–7671 CrossRef CAS PubMed.
- A. Kumar and R. G. Reddy, J. Power Sources, 2003, 114, 54–62 CrossRef CAS.
- J. E. Park, J. Lim, S. Kim, I. Choi, C. Y. Ahn, W. Hwang, M. S. Lim, Y. H. Cho and Y. E. Sung, Electrochim. Acta, 2018, S001346861830238X Search PubMed.
- K. S. Dong, H. Y. Jin, G. K. Dong and S. K. Min, Renewable Energy, 2017, 115, 663–675 Search PubMed.
- X. Sun, X. Xie, S. Wu, Z. Liu and K. Jiao, Int. J. Green Energy, 2021, 18, 1–12 CrossRef.
- D. Spernjak, A. K. Prasad and S. G. Advani, J. Power Sources, 2010, 195, 3553–3568 CrossRef CAS.
- B. R. Friess and M. Hoorfar, Int. J. Hydrogen Energy, 2012, 37, 7719–7729 CrossRef CAS.
- N. Guo, C. L. Ming and U. O. Koylu, Int. J. Hydrogen Energy, 2013, 38, 6750–6761 CrossRef CAS.
- T. Wilberforce, Z. E. Hassan, E. Ogungbemi, O. Ijaodola, F. N. Khatib, A. Durrant, J. Thompson, A. Baroutaji and A. G. Olabi, Renewable Sustainable Energy Rev., 2019, 111, 236–260 CrossRef CAS.
- X. Li and I. Sabir, Int. J. Hydrogen Energy, 2005, 30, 359–371 CrossRef CAS.
- S. A. Atyabi, E. Afshari, S. Wongwises, W. M. Yan and M. S. Shadloo, Energy, 2019, 179, 490–501 CrossRef CAS.
- Z. Yuan, W. Fu, Y. Zhao, Z. Li, Y. Zhang and X. Liu, Energy, 2013, 55, 1152–1158 CrossRef CAS.
- Z. Zhao, F. Zhang, Y. Zhang and D. Zhang, Energies, 2021, 14, 6608 CrossRef CAS.
- A. M. Oladoye, J. G. Carton and A. G. Olabi, J. Mater., 2014, 2014, 1–10 Search PubMed.
- S. S. Hsieh, C. C. Ho and L. C. Hung, Renewable Energy, 2016, 90, 28–37 CrossRef CAS.
- I. Sharma and M. Ghangrekar, Water Sci. Technol., 2018, 77, 999–1006 CrossRef CAS PubMed.
- L. Li, W. Fan, J. Xuan, M. K. H. Leung, K. Zheng and Y. She, Energy Procedia, 2017, 105, 1557–1563 CrossRef CAS.
- N. V. Demeneva, D. V. Matveev, V. V. Kharton and S. I. Bredikhin, Russ. J. Electrochem., 2016, 52, 678–684 CrossRef CAS.
- Y. Wei, T. Yong, Q. Wang and Z. Wan, Appl. Energy, 2011, 88, 1671–1680 CrossRef.
- T. Yong, Y. Wei, M. Pan, B. Tang, Z. Li and Z. Wan, J. Power Sources, 2010, 195, 5628–5636 CrossRef.
- Y. Wei, T. Yong, Z. Wan and M. Pan, Int. J. Hydrogen Energy, 2011, 36, 2237–2249 CrossRef.
- C. C. Roberts, R. R. Rao, M. Loewenberg, C. F. Brooks, P. Galambos, A. M. Grillet and M. B. Nemer, Lab Chip, 2012, 12, 1540–1547 RSC.
- R. Xue, Y. Zhang and X. Liu, Energy, 2017, 139, 535–541 CrossRef CAS.
- X. Chao, A. Faghri, X. Li and T. Ward, Int. J. Hydrogen Energy, 2010, 35, 1769–1777 CrossRef.
- A. Aricò, V. Baglio, A. Stassi and V. Antonucci, Adv. Crop Sci. Technol., 2010, 72, 271–276 Search PubMed.
- Y. Zhang, X. Rui, X. Zhang, J. Song and X. Liu, Energy, 2015, 91, 1081–1086 CrossRef CAS.
- T. S. Zhao, C. Xu, R. Chen and W. W. Yang, Prog. Energy Combust., 2009, 35, 275–292 CrossRef CAS.
- Z. Yuan and J. Yang, J. Power Sources, 2015, 285, 318–324 CrossRef CAS.
- A. Frignani, C. Monticelli, M. Tassinari and G. Trabanelli, AEIT Conference-from Research to Industry: the Need for A More Effective Technology Transfer, 2002 Search PubMed.
- D. Chun, D. Kim, Z. R. Williamson, T. Lee and C. W. Squibb, Appl. Therm. Eng., 2013, 50, 293–301 CrossRef CAS.
- T. Chasen, Y. Q. Liang, X. Xie, L. I. Lincai, Z. Liu, D. U. Qing and K. Jiao, Sci. China: Technol. Sci., 2021, 64, 13 Search PubMed.
- I. Alaefour, S. Shahgaldi, A. Ozden, X. Li and F. Hamdullahpur, Fuel, 2018, 230, 98–103 CrossRef CAS.
- M. Ashrafi, H. Kanani and M. Shams, Energy, 2018, 147, 317–328 CrossRef.
- B. H. Lim, E. H. Majlan, W. Daud, M. I. Rosli and T. Husaini, Int. J. Hydrogen Energy, 2016, 42, 9210–9218 CrossRef.
| This journal is © The Royal Society of Chemistry 2022 |

