 Open Access Article
Creative Commons Attribution 3.0 Unported Licence
Preparation of calcium carbonate microrods from the gypsum scale layer of evaporation equipment
Xinsong Yuan†
 *a,
Xiaolong Chenb,
Shan Gaoa,
Yanping Wanga,
Liang Yanga,
Qi Zhanga,
Yiwen Chenb,
Bainian Wangb and
Baojun Yang†*b
aSchool of Chemistry and Chemical Engineering, Hefei Normal University, Hefei 230601, China
bSchool of Chemistry and Chemical Engineering, Hefei University of Technology, Hefei 230009, China. E-mail: yuanxs@zju.edu.cn; bj_yang@hfut.edu.cn
First published on 6th April 2022
Abstract
The difficult-to-remove CaSO4 scale layer attached to an evaporator wall is a major problem in related industries. How to efficiently remove the CaSO4 scale layer and convert it into fine chemicals with high added value, so as to turn waste into treasure, is a current research hotspot. In this study, a CaSO4 scale layer was removed by 15 min rotary washing via a phase transfer route. Further, using the eluted calcium gluconate solution as a raw material and polyethylene glycol as the crystal control agent, CaCO3 was prepared by a CO2 carbonization method. The preparation conditions of CaCO3 were optimized by single factor experiments, and the phase and morphology of the prepared samples were characterized by XRD and FESEM. The results show that the optimized conditions are as follows: reaction temperature 80 °C, reaction time 1 h, polyethylene glycol addition 3%, and a stirring rate of 400 rpm. The samples prepared under these conditions are pure-phase calcite-type CaCO3 microrods with lengths of 1–2 μm and diameters of 300–500 nm.
1 Introduction
The use of industrial and agricultural wastes to produce high value-added chemical products is an inherent requirement for realizing atomic economy and green chemistry. Scaling is a common problem faced by water treatment processes such as seawater desalination and evaporation and concentration of high-salt wastewater. In chemical engineering processes including the evaporative concentration of lime-treated hemicellulose dilute sulfuric acid hydrolysate,1,2 and the distillation of ammonia3 in the ammonia-alkali system, a large amount of gypsum waste residue is generated, and the hard-to-remove CaSO4 scale layer on the evaporator wall is a major problem. These CaSO4 form an insulating layer, reduce evaporation efficiency, waste steam, and reduce equipment utilization. This kind of gypsum scale layer is difficult to remove by common chemical methods, and can only be removed by mechanical methods. Mechanical treatment is not only labor-intensive, but also easy to cause damage to equipment, and at the same time produces a large amount of gypsum waste residue, which is a major disadvantage of lime treatment. In addition, the accumulation of these CaSO4 forms a large amount of solid waste residue, which is likely to cause environmental pollution problems.CaCO3 powder is an excellent inorganic filler and reinforcing agent with stable chemical properties and low cost. Due to its diverse polymorphic forms, CaCO3 has broad application prospects in the fields of plastics, rubber, coatings, adhesives, papermaking and cosmetics.4–8 It is known that the performances of materials are closely related to their size, morphology and composition.9–12 The preparation of crystals with specific sizes and morphologies by controlling synthesis conditions is a hotspot in the field of functional material research. Vaterite-type CaCO3 has a particularly large specific surface area and high porosity,13,14 which has a great potential as a drug carrier with high loading.15,16 As a new type of filler, rod-shaped precipitated CaCO3 has good strengthening and toughening effects on rubber and plastics. In the paper industry, compared with heavy and nano-calcium carbonate, CaCO3 microrods as paper filler has better retention rate, smaller reduction rate of paper strength, and higher covering rate.4 As a paper filler and coating, CaCO3 microrods also impart excellent printability to paper. As a paper filler and coating, rod calcium carbonate also imparts excellent printability to paper.17 Therefore, the technical research and production of rod-shaped calcium carbonate has good economic and social benefits. Herein, we report a method for removing the gypsum scale layer of an evaporator by a phase transfer method,18 and a process for preparing calcite-type CaCO3 microrods by CO2 carbonization using this phase transfer liquid as a raw material.
2 Experimental
2.1 Sample preparation
2.2 Characterization
3 Results and discussion
3.1 Phase and morphology analysis of evaporation flask scale layer
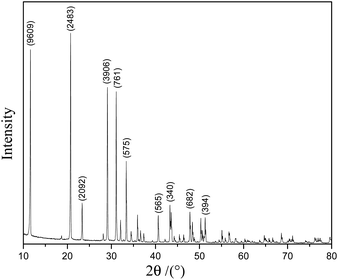
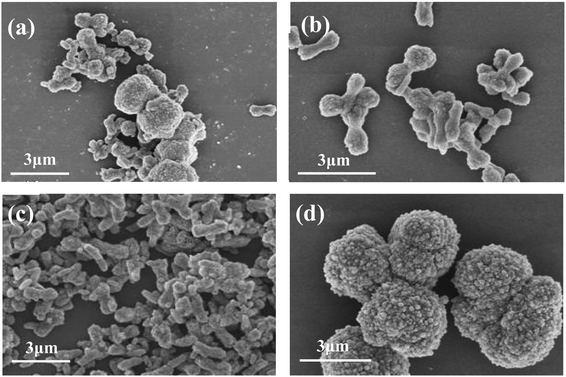
Fig. 1 shows the XRD pattern of the scale layer on the inner wall of the evaporating flask during the concentration of the lime-neutralized hydrolysate. All the strong and sharp diffraction peaks of the XRD pattern can be indexed as the monoclinic phase CaSO4·2H2O (JCPDS No. 33-0311), which shows that the main component of the precipitate from the lime neutralized hydrolysate is gypsum.In order to further analyze the morphology of the evaporation flask scale layer samples, we performed FESEM analysis on the samples. It can be seen from Fig. 2a and b that most of the samples are agglomerated cuboid block particles with particle sizes ranging from several microns to tens of microns.
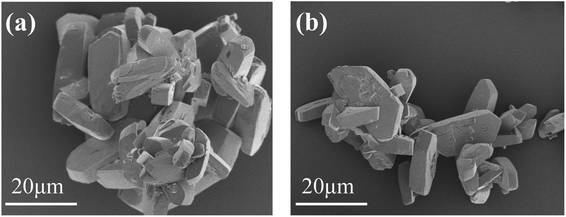 | ||
| Fig. 2 FESEM image of the scale layer sample of the evaporation flask: typical morphology of agglomerated bulk particles (a); morphology of relatively dispersed region (b). | ||
3.2 The effect of phase transfer agent on removing scale layer
Using sodium gluconate as the phase transfer agent, the gypsum scale layer on the inner wall of the evaporating flask was completely removed after rotary washing for 15 minutes (as shown in Fig. 3).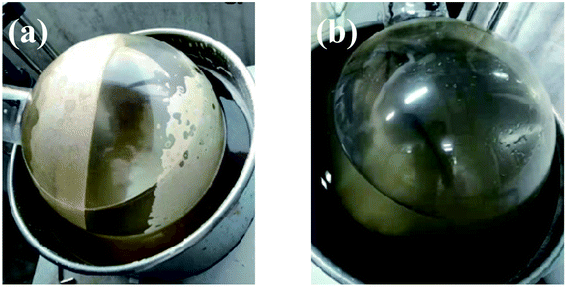 | ||
| Fig. 3 The photo of scaling on the inner wall of the rotary flask (a) and after washing with sodium gluconate solution for 15 min (b). | ||
In order to completely remove the scale layer, the sodium gluconate was in appropriate excess to the stoichiometric ratio, to a molar ratio of sodium gluconate per Ca2+ of 3.0. In this study, the amount of Ca2+ was determined based on the amount of calcium gluconate determined in subsequent chemical titration. However, because it is difficult to accurately predict the amount of CaSO4 in industry, the amount of calcium gluconate needs to be roughly estimated according to the thickness and area of the scale layer.
We have compared and analyzed the phase transfer method and sonication, base wash and soaking in carbonate or organic solution followed by acid wash. It is inconvenient to sonicate the CaSO4 scale layer adhering to the walls of industrial evaporators. The solubility of CaSO4 in aqueous solution is very small, and its chemical properties are relatively stable, and the effect of acid washing/alkali washing is not good. In addition, high concentrations of acid and alkali are easy to corrode equipment. Acids tend to corrode metals, and alkalis tend to corrode glass. Sodium citrate, sodium gluconate and EDTA are all commonly used chelating agents, and we compared their treatment effects through experiments. Under the same experimental conditions for 15 minutes, sodium gluconate can completely remove the CaSO4 scale layer, sodium citrate can remove about 90% of the CaSO4 scale layer, and EDTA can only remove about half. Therefore, sodium gluconate was chosen as the phase transfer agent in this study.
3.3 Influence of synthesis conditions on the crystal form and morphology of the prepared CaCO3 samples
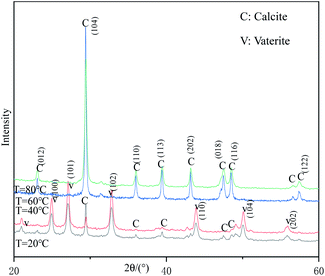
Fig. 5 shows the XRD patterns of samples prepared at different reaction temperatures. When the reaction temperature is 60 °C or 80 °C, all the strong peaks in the figure can be indexed as the diffraction peaks of calcite-type CaCO3 (JCPDS 99-0022), indicating that the samples prepared under these conditions are pure-phase calcite-type CaCO3. When the reaction temperature is lower than 40 °C, the diffraction peaks appearing at 24.95°, 27.19°, 32.71°, 43.90°, 50.13°, 55.86° can be indexed as (100), (101), (102), (110), (104) and (202) crystal plane characteristic diffraction peaks of vaterite-type CaCO3 (JCPDS 72-0506), respectively. In addition, a strong calcite-type CaCO3 (104) crystal plane diffraction peak appeared at 29.30°, indicating that the samples prepared at this temperature were a mixture of vaterite-type and calcite-type CaCO3. Therefore, the reaction temperature above 60 °C is beneficial to obtain pure calcite-type CaCO3.
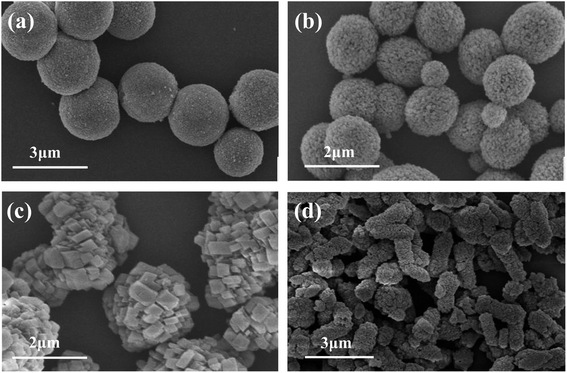
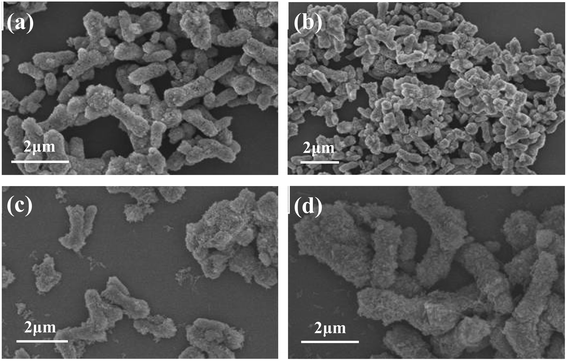
Fig. 6 are the FESEM images of samples prepared at different reaction temperatures. It can be seen that when the reaction temperature is 20 °C (Fig. 6a), the obtained samples are uniform microspheres with particle size of 2–3 μm. When the reaction temperature increased to 40 °C (Fig. 6b), the size and morphology of the sample particles began to change, from the initial uniform spherical shape to different sizes, and the surface became more rough. When the temperature was raised to 60 °C (Fig. 6c), the samples were irregular aggregates formed by many massive or short rod-like small particles. When the reaction temperature was 80 °C (Fig. 6d), the morphology of samples was mainly short rod-like, 1–2 μm long and 500–800 nm in diameter. Therefore, in this experiment, the optimal reaction temperature for preparing pure calcite phase CaCO3 microrods is 80 °C.
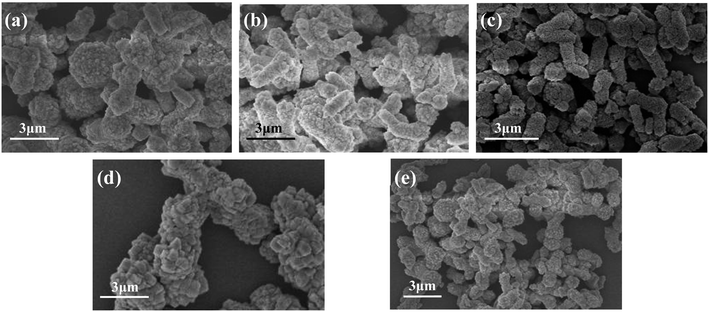
Fig. 8 shows the FESEM images of CaCO3 samples generated with different addition amount of PEG. When the addition amount was 1% (Fig. 8a), the obtained samples were mainly irregularly agglomerated CaCO3 particles, but there were some rod-like structures. When the addition amount was 2% (Fig. 8b), the obtained samples became less agglomerated, the particle size became smaller, and the rod-shaped particles increased. When the addition amount increased to 3% (Fig. 8c), the as prepared CaCO3 samples were mainly rod-shaped, the rods are relatively uniform in length and diameter, and the dispersibility was relatively good. When the addition amount increased to 4% and 5% (Fig. 8d and e), the agglomeration of the sample particles was obvious, although some of the particles still maintained rod-like morphology. The experimental results show that the addition of PEG has a significant effect on the morphology of CaCO3, and the suitable addition of PEG is 3%.
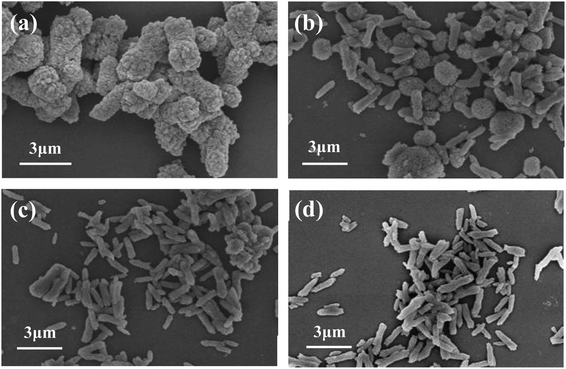 | ||
| Fig. 9 FESEM images of calcium carbonate samples prepared at different stirring rates (a) 200 rpm; (b) 300 rpm; (c) 400 rpm; (d) 500 rpm. | ||
It can be seen from the figure that when the stirring rate is 200 rpm (Fig. 9a), the obtained sample has a rod-like morphology, with a length of 2–3 μm and a diameter of 800–1200 nm, and the particles have obvious agglomeration. When the stirring rate was increased to 300 rpm (Fig. 9b), the obtained sample had a mixed morphology of rod and spherical, but the average particle size of the sample became smaller and the aspect ratio increased. When the stirring rate reached 400 rpm (Fig. 9c) and 500 rpm (Fig. 9d), the obtained samples were mainly short rods with a length of 1–2 μm and a diameter of 300–500 nm, the particle surface was relatively smooth, and the dispersion was good. The above experimental results show that the stirring rate has an effect on the size and morphology of the obtained CaCO3 samples. When the stirring rate is relatively low, the generated sample particles are large and the agglomeration is obvious. When the stirring rate increases, the obtained sample particles become smaller, the surface becomes smoother, the size and morphology of the short rod-shaped particles are uniform, and the dispersibility is also better. Therefore, the appropriate stirring rate was determined to be 400 rpm.
The weight of the calcium sulfate scale was calculated based on the change in the weight of the evaporating flask before and after the phase transfer treatment. Under the above optimized conditions, 11.8 g CaCO3 was obtained from 26.5 g dry scale. Therefore, the yield of the process based on Ca2+ was about 76.7%.
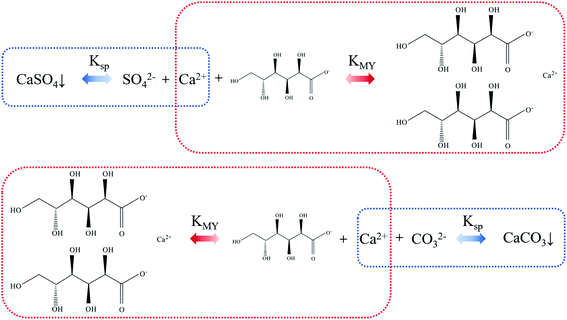
As regard to the formation of calcium carbonate in this study, the possible mechanism was speculated as follows. Sodium gluconate is easily soluble in water and has strong chelating ability for Ca2+, Mg2+ and Fe2+, so it can efficiently remove the gypsum scale layer on the evaporator wall. The solubility product constant Ksp of CaSO4 is less than the stability constant KMY of calcium gluconate. Through the control of reaction conditions, the equilibrium of the mixed solution of SO42−, Ca2+ and gluconate moves to the direction of forming calcium gluconate complex. After the stable complex is formed, its ion and hydration radius increase sharply, and the solubility is better, thereby forming a soluble calcium gluconate solution, which makes the scaled calcium sulfate in the flask continuously dissolve. Under alkaline conditions, CO2 was introduced into the calcium gluconate solution, so that the CO32− concentration in the system was continuously increased. Since KMY of calcium gluconate complex is smaller than Ksp of CaCO3, the balance of the mixed system of CO32−, Ca2+ and calcium gluconate is constantly moving towards the direction of CaCO3 precipitation. The schematic diagram is shown in Fig. 10.
PEG is a water-soluble, non-toxic surfactant, which has a great influence on the morphology of crystals such as CaCO3 and Ca3(PO4)2. PEG is a polymer containing hydrophilic groups and its structure is a zigzag long chain. The “ether bond” oxygen atom (–O–) on the chain has unbonded lone pair electrons, which have high electronegativity and are easy to combine with Ca2+ ions, so that PEG has abundant CaCO3 along the main chain direction crystal nucleation sites. In addition, during the growth of CaCO3 crystals, the steric hindrance of chelated calcium ions is large,20 which makes CaCO3 susceptible to the specification of PEG chains and grows along a specific direction, and thus is beneficial to the formation of CaCO3 rods.
4 Conclusions
CaSO4 scale layer was removed by 15 min rotary washing by using sodium gluconate as the phase transfer agent, which provides an efficient technical route for industrial removal of gypsum scale layer on the evaporator wall. Using the eluted calcium gluconate as raw material and polyethylene glycol as crystal control agent, the process conditions for preparing CaCO3 by CO2 carbonization were studied by single factor experiments. The samples prepared under the optimal conditions are pure-phase calcite-type CaCO3 microrods with length of 1–2 μm and diameter of 300–500 nm.Conflicts of interest
There are no conflicts to declare.Acknowledgements
This work was supported by Key Research Project of Natural Science in Universities in Anhui Province (KJ2021A0932 & KJ2021A0935), Scientific Research Fund for High-Level Talents (2020rcjj33) and Anhui Engineering Laboratory for Medicinal and Food Homologous Natural Resources (2020PT19).References
- D. J. O'Brien, G. E. Senske, M. J. Kurantz and J. C. Craig Jr, Ethanol recovery from corn fiber hydrolysate fermentations by pervaporation, Bioresour. Technol., 2004, 92(1), 15–19 CrossRef PubMed.
- S. Zhu, W. Huang, W. Huang, K. Wang, Q. Chen and Y. Wu, Pretreatment of rice straw for ethanol production by a two-step process using dilute sulfuric acid and sulfomethylation reagent, Appl. Energ., 22015, 154, 190–196 CrossRef.
- T. J. Crossley, Waste treatment advances: lime treatment and ammonia recovery of liquid waste, Chem. Eng. Prog., 1976, 72(10), 81–83 CAS.
- Q. Yu, H. D. Ou, R. Q. Song and A. W. Xu, The effect of polyacrylamide on the crystallization of calcium carbonate: Synthesis of aragonite single-crystal nanorods and hollow vatarite hexagons, J. Cryst. Growth, 2006, 286(1), 178–183 CrossRef CAS.
- H. B. Yao, J. Ge, L. B. Mao, Y. X. Yan and S. H. Yu, 25th anniversary article: artificial carbonate nanocrystals and layered structural nanocomposites inspired by nacre: synthesis, fabrication and applications, Adv. Mater., 2014, 26, 163–187 CrossRef CAS PubMed.
- M. M. M. G. P. G. Mantilaka, D. G. G. P. Karunaratne, R. M. G. Rajapakse and H. M. T. G. A. Pitawala, Precipitated calcium carbonate/poly(methyl methacrylate) nanocomposite using dolomite: Synthesis, characterization and properties, Powder Technol., 2013, 235, 628–632 CrossRef CAS.
- N. K. Dhami, M. S. Reddy and A. Mukherjee, Biomineralization of calcium carbonates and their engineered applications: a review, Front. Microbiol., 2013, 4, 314 Search PubMed.
- L. Zhao, Y. Zhang, Y. Miao and L. Nie, Controlled synthesis, characterization and application of hydrophobic calcium carbonate nanoparticles in PVC, Powder Technol., 2016, 288, 184–190 CrossRef CAS.
- F. Shan, L. Panariello, G. Wu, A. Gavriilidis, H. H. Fielding and I. P. Parkin, A study of the interaction of cationic dyes with gold nanostructures, RSC Adv., 2021, 11(29), 17694–17703 RSC.
- N. Hirata, Y. Katsura, H. Gunji, M. Tona, K. Tsukamoto, M. Eguchi, T. Ando and A. Nakajima, Platinum nanocluster catalysts supported on Marimo carbon via scalable dry deposition synthesis, RSC Adv., 2021, 11(62), 39216–39222 RSC.
- S. Sovova, A. Abalymov, M. Pekar, A. G. Skirtach and B. Parakhonskiy, Calcium carbonate particles: synthesis, temperature and time influence on the size, shape, phase, and their impact on cell hydroxyapatite formation, J. Mater. Chem., 2021, 9(39), 8308–8320 RSC.
- E. Ulkeryildiz, S. Kilic and E. Ozdemir, Rice-like hollow nano-CaCO3 synthesis, J. Cryst. Growth, 2016, 450, 174–180 CrossRef CAS.
- G. Begum, T. N. Reddy, K. P. Kumar, K. Dhevendar, S. Singh, M. Amarnath, S. Misra, V. K. Rangari and R. K. Rana, In Situ Strategy to Encapsulate Antibiotics in a Bioinspired CaCO3 Structure Enabling pH-Sensitive Drug Release Apt for Therapeutic and Imaging Applications, ACS Appl. Mater. Interfaces, 2016, 8, 22056–22063 CrossRef CAS PubMed.
- B. V. Parakhonskiy, A. Haase and R. Antolini, Sub-micrometer vaterite containers: synthesis, substance loading, and release, Angew. Chem., Int. Ed. Engl., 2012, 51, 1195–1197 CrossRef CAS PubMed.
- T. Jin, X. Tian, H. Hong, N. Zhu, L. Han and Q. Suo, Study on preparation and crystalline transformation of nano- and micro-CaCO3 by supercritical carbon dioxide, Powder Technol., 2020, 370, 29–38 CrossRef CAS.
- H. Yang, Y. Wang, T. Liang, Y. Deng, X. Qi, H. Jiang, Y. Wu and H. Gao, Hierarchical porous calcium carbonate microspheres as drug delivery vector, Prog. Nat. Sci., 2017, 27, 674–677 CrossRef CAS.
- M. M. H. Al Omari, I. S. Rashid, N. A. Qinna, A. M. Jaber, and A. A. Badwan, Calcium carbonate, in Profiles of Drug Substances, Excipients and Related Methodology, ed. H. G. Brittain, Academic Press, 2016, vol. 41, pp. 31–132 Search PubMed.
- B. J. Yang, L. Liu, B. N. Wang, X. T. He, and S. N. Zhang, A kind of method for preparing light calcium carbonate by phase transfer-carbonization method, Chinese invention patent, CN2013/103387254A, 2013.
- X. S. Yuan, S. Tu, J. P. Lin, H. H. Shen, L. R. Yang and M. B. Wu, Combination of the CRP mutation and ptsG deletion in Escherichia coli to efficiently synthesize xylitol from corncob hydrolysates, Appl. Microbiol. Biotechnol., 2020, 104, 2039–2050 CrossRef CAS PubMed.
- H. H. Qi, G. Bao, H. B. Tan, C. B. Li, Z. Z. Zhi, H. Wang, X. H. Liu and Q. Yang, Effect of sodium gluconate on molecular conformation of polycarboxylate superplasticizer studied by the molecular dynamics simulation, J. Mol. Model., 2020, 26(3), 1–10 CrossRef PubMed.
Footnote |
| † These authors contributed equally to this study. |
| This journal is © The Royal Society of Chemistry 2022 |

