 Open Access Article
Structural engineering of BiOBr nanosheets for boosted photodegradation performance toward rhodamine B†
Yu Qia,
Jinjiang Zhaoa,
Hongtao Wanga,
Meifang Yana and
Tianyu Guo *ab
*ab
aCollege of Environment Science and Engineering, Taiyuan University of Technology, No. 209 University Street, Jinzhong 030600, Shanxi, PR China. E-mail: tyguo1117x@163.com
bShanxi Key Laboratory of Gas Energy Efficient and Clean Utilization, No. 79 Yingze West Street, Taiyuan 030024, Shanxi, PR China
First published on 22nd March 2022
Abstract
A series of BiOBr nanosheets were synthesized through a facile solvothermal method, whose structures were adjusted by changing solvent ratios. Their photodegradation properties toward rhodamine B (RhB) were further investigated under visible light irradiation. The photocatalytic results indicated that the B-1:3 sample showed superior photoactivity and the RhB removal efficiency attained 97% within 30 min. The outstanding photodegradation activity can be ascribed to the small particle size and thickness, suppressed e−–h+ pair recombination and more active electrons and holes. Moreover, free radical quenching experiments suggest that ·O2− and h+ play a crucial role in improving photoactivity. This work opens a new avenue to boost the removal rate of organic pollutants by engineering the solvent ratios of photocatalysts in the wastewater treatment field.
1. Introduction
With the rapid development of worldwide industrialization, emerging toxic and harmful water-borne contaminants have severely threatened human health and the environment safety.1–3 Of particular concern is high-efficient removal of organic pollutants in water due to mostly high toxicity and potential carcinogenicity.4 Among the kinds of organic pollutants, around 700![[thin space (1/6-em)]](https://www.rsc.org/images/entities/char_2009.gif) 000 tons of textile dyes are released into water bodies annually. Particularly, rhodamine B (RhB), a typical representative of textile dyes, has drawn explosive scientific attention due to irritation of eyes, skin and the nervous system.5 Therefore, developing green and cost-effective technologies to allay environmental RhB levels is critically desirable.
000 tons of textile dyes are released into water bodies annually. Particularly, rhodamine B (RhB), a typical representative of textile dyes, has drawn explosive scientific attention due to irritation of eyes, skin and the nervous system.5 Therefore, developing green and cost-effective technologies to allay environmental RhB levels is critically desirable.
Recently, photocatalytic degradation of organic pollutants via a photocatalyst has been considered as an eco-friendly and low-cost technique by utilizing inexhaustible and clean solar energy as driving force.6–8 Thus, design of visible-light-driven photocatalysts with high charge separation efficiency and outstanding photocatalytic activity will play a key role for practical demand. Up to now, the widely exploited semiconductor photocatalysts mainly focused on metal oxides, modified metal oxides and sulfides such as TiO2,9 ZnO,10 BiOBr/Fe3O4@SiO2,11 Bi4O5Br2/g-C3N4,12 BiOCl@CeO2,13 S-doped ZnO,14 TiO2/C,15 S/Cl-C3N4.16 Unfortunately, high recombination rate of electron–hole pairs, photocorrosion and limited visible light photo-absorptivity restrict its practical application.17 Among the developed impressive semiconductors, bismuth oxybromide (BiOBr), as an important ternary oxide semiconductor, has stimulated considerable attention owing to high conductivity and chemical stability as well as environmental friendliness.18 Its special layered structure consists of [Bi2O2]2+ layers and staggered plates of double Br− ions. Moreover, Bi and O within the [Bi2O2]2+ layers are connected by covalent bonds, and their interaction is due to the van der Waals force.19 It is conducive to generate hole–electron pairs and contribute to high photocatalytic activity.20 Nevertheless, its photodegradation efficiency is still limited by relatively large band gap (∼2.9 eV) of BiOBr and rapid recombination of photoexcited electrons–holes.21 To conquer these shortcoming, considerable efforts have been devoted to boost the photocatalytic property by element doping,22,23 microstructures modulation24 and heterojunctions fabrication.17,25 Encouragingly, the microstructures modulation has been deemed to be one of promising strategies to improve the light absorption ability and charge transfer efficiency.26 The strategy includes various methods, such as microwave-assisted synthesis,27 solvothermal and hydrothermal synthesis,28,29 sol–gel,30 combustion31 and mechano-chemically methods.32 Among them, the solvothermal and hydrothermal synthesis have been deemed to be the promising methods due to easy to control and operate.33 For example, flower-liked Bi4Ti3O12 was prepared by a facile hydrothermal route and exhibited high photocatalytic activity toward RhB due to improved absorption edges and separation rate of photogenerated carrier.29 BiOBr nanosheets were synthesized by a facile solvothermal route in a mixed solvent of n-propanol, water and acetic acid, and displayed enhanced photodegradation performance of salicylic acid and RhB due to exposed (001) facet and small thickness.34 0D/1D g-C3N4 homojunction was synthesized by a hydrothermal route and displayed enhanced photodegradation performance of RhB, which is attributed to enhanced separation efficiency of carriers.35 Hence, it is highly meaningful to design highly efficient BiOBr photocatalyst by constructing the microstructure using a facile method for realizing the practical application.
Herein, we propose a facile solvothermal synthesis approach by adjusting the volume ratios of deionized water/methanol for constructing the microstructure of BiOBr. Furthermore, CTAB was used as surfactant. It is because that its hydrophilic group (ammonium group) can control the morphology and the crystal size, and the hydrophobic functional group (hydrocarbon group) can control the thickness of the nanosheets.36 The photodegradation properties and reusability toward RhB dye were further investigated under visible light. The possible mechanism was also elucidated based on the reactive species capturing experiments and the band structures.
2. Experimental section
2.1. Chemical material
All analytical grade chemicals were used without any additional purification. Bismuth nitrate pentahydrate (Bi(NO3)2·5H2O), potassium bromide (KBr), absolute methanol, cetyl trimethyl ammonium bromide (CTAB), rhodamine B (RhB), isopropanol (IPA), benzoquinone (BQ) and triethanolamine (TEOA) were purchased from Sino pharm Chemical Reagents Co., Ltd., China.2.2. Synthesis of BiOBr photocatalysts
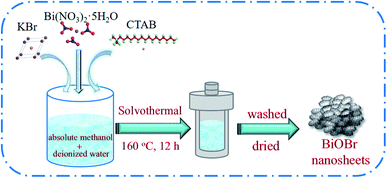
A series of BiOBr photocatalysts were prepared by a solvothermal method (Scheme 1). In a typical process, 30, 45 and 50 mL of absolute methanol was mixed with 30, 15 and 10 mL of deionized water under the magnetic stirring, respectively. Then, 5 mmol of Bi(NO3)2·5H2O was slowly put into the above binary solvent with constantly stirring until dissolved. After that, 5 mmol KBr and 0.5 g CTAB were successively added into the above solution. After magnetic stirred for 30 min, the mixture was transferred into a 100 mL Teflon-lined autoclave and heated at 160 °C for 12 h. Subsequently, the system was cooled to ambient temperature. The resulting precipitates were collected by centrifuge and washed for three times with deionized water and ethanol, respectively. Finally, the product was dried at 70 °C for 12 h. The obtained samples were defined as B-1:1, B-1:3 and B-1:5 according to the volume ratio of deionized water/absolute methanol, respectively. For comparison, the BiOBr photocatalyst was also synthesized in the absence of absolute methanol and denoted as B-W.2.3. Photocatalysts characterization
The crystalline structure of the sample was analyzed by X-ray diffraction (XRD) (Rigaku Mini Flex II, Japan) with Cu Kα radiation (30 kV, 15 mA, λ = 0.1542 nm). The scan range is 10°–80° at 2θ angles with a scan rate of 5° min−1. The morphology of as-prepared material was determined by scanning electron microscopy (SEM, Hitachi, SU8010) and transmission electron microscope (TEM, JEM-2100F) equipped with EDX (accelerating voltage of 200 kV). The X-ray photoelectron spectroscopy (XPS) was investigated on a Thermo Scientific ESCALAB 250Xi X-ray photoelectron spectrometer with a Monochromatic Al Kα (1486.6 eV) X-ray source. The UV-vis diffuse reflectance spectroscopy (UV-vis DRS) was measured on a UV-vis spectrophotometer (UV-1800) to evaluate the optical properties of the catalysts. Photoluminescence (PL) spectrum was assessed through a Hitachi F-4700 spectrophotometer. The electrochemical impedance spectroscopy (EIS) and photocurrent data were investigated via an electrochemical work station with a three-electrode cell (VersaSTAT-3, Ametek Princeton, USA) under 300 W Xe lamp irradiation. The Ag/AgCl electrode and Pt wire acted as the reference electrode and the counter electrode, respectively. The working electrode was obtained by the as-synthesized material coated on an ITO electrode. 0.5 M Na2SO4 solution was used as the electrolyte.2.4. Photocatalytic degradation experiments
Photocatalytic properties of as-prepared catalysts were evaluated by choosing rhodamine B (RhB) as important pollutant under visible light. A cylindrical Pyrex vessel with circulating cooling water was used as photocatalytic reactor (PLS-SXE300, Perfect Light, China). A 300 W xenon lamp was employed as visible light source equipped with a cut-off filter of 420 nm. Typically, 50 mg of photocatalyst was dispersed into 100 mL, 20 mg L−1 RhB solution. Subsequently, the above solution was stirred for 30 min in dark to achieve the adsorption–desorption equilibrium. Then, the light source was switched on to initiate the photodegradation process. At fixed time intervals, 3 mL of the suspension were withdrawn and then filtered using 0.22 μm filter. The RhB concentration was analyzed at maximum absorbance of 552 nm by a UV-vis spectrophotometer (UV752). The removal efficiency of RhB was calculated by the following equation:| Et = (1 − Ct/C0) × 100%, |
2.5. Radical-scavenging experiments
To insight into the photocatalytic mechanism, a series of trapping experiments were performed separately by adding 1 mM capturing agents under similar experiment condition. In here, isopropanol (IPA), benzoquinone (BQ) and triethanolamine (TEOA) were used as hydroxyl radicals (·OH), superoxide radicals (·O2−) and hole (h+) sacrificial agents, respectively.3. Results and discussion
3.1. Morphologies and structures analysis of as-prepared BiOBr materials
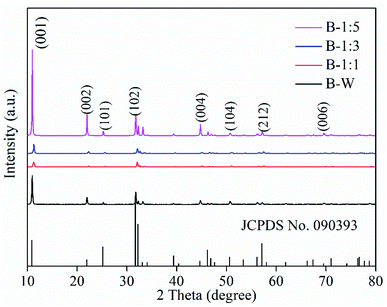
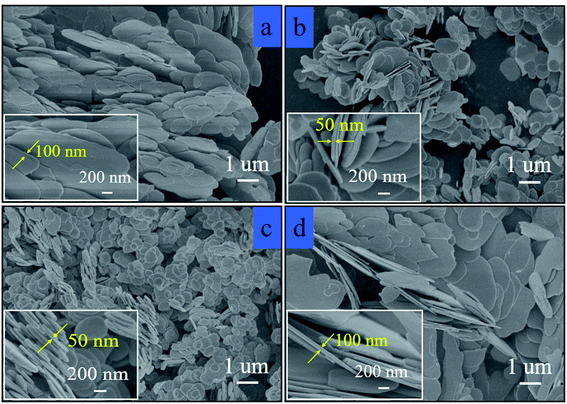
The crystalline phases of the photocatalysts were analyzed by XRD technique. As shown in Fig. 1, the diffraction peaks occurred at 2θ of 11.2°, 21.9°, 25.2°, 31.7°, 44.7°, 57.3° and 69.6° are attributed to the diffraction of (001), (002), (101), (102), (004), (104), (212) and (006) crystal faces of tetragonal BiOBr phase (JCPDS no. 090393), respectively.18,37 Notably, the (001) plane shows stronger diffraction peak than that of others, indicating that as-obtained BiOBr samples are an anisotropic growth along the (001) orientation.38 No impurity peaks can be detected, suggesting that high purity of as-obtained materials. Interestingly, the peak intensity gradually increases with increasing methanol volume, implying that solvent content has a certain influence on the crystallinity of BiOBr.The morphologies of the as-obtained BiOBr materials as studied by SEM are shown in Fig. 2. As could be seen, all materials consist of thin and irregular nanosheets structure and only the size changes (Fig. 2a–d). The particle size of B-1:1, B-1:3, B-1:5 and B-W is 1.37 μm, 0.79 μm, 0.56 μm and 1.48 μm, respectively (Fig. S1†). That is to say, the B-1:3 and B-1:5 exhibit more smaller size than that of B-1:1 and B-W, which will provide more active sites and may contribute to high photocatalytic activity. Magnified images show that the thickness is about 100 nm for B-1:1 and B-W samples, however, the B-1:3 and B-1:5 display the smaller thickness (ca. 50 nm) (inserted in Fig. 2a–d). In addition, the EDS elemental mapping of B-1:3 suggests that Br, O and Bi elements are uniformly distributed in the BiOBr material (Fig. S2a–c†).
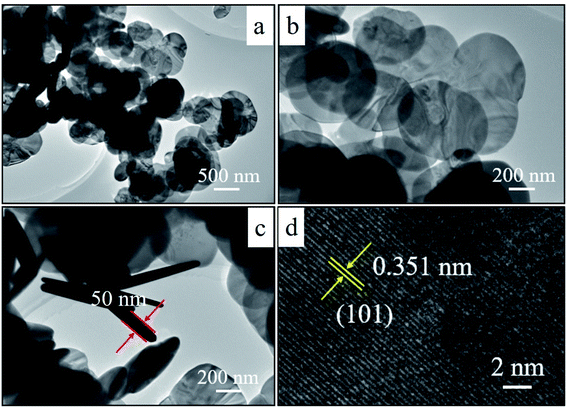
The microstructures of the as-synthesized BiOBr samples were further analyzed by TEM and HRTEM characterization (Fig. 3). TEM images show that the B-1:3 is composed of round nanosheets (Fig. 3a). Magnified image demonstrates the well dispersion with the average diameter of 300 nm (Fig. 3b) and ultrathin structure with the thickness of ca. 50 nm (Fig. 3c), which is consistent with SEM result (inserted in Fig. 2b). Additionally, the lattice spacing is 0.351 nm, attributed to the (101) plane of the BiOBr (Fig. 3d).39
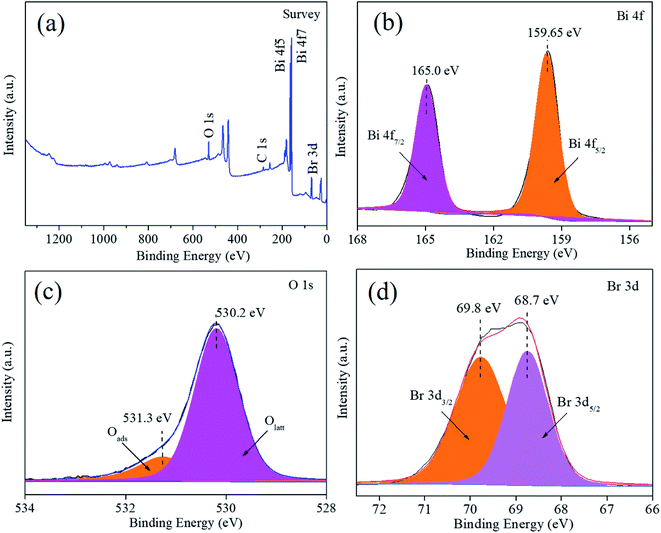
The elemental composition and valence states were determined by XPS technique and the result are exhibited in Fig. 4. From XPS survey spectrum (Fig. 4a), only peaks of Br, O, Bi and C elements can be detected, confirming that the pure BiOBr was successfully prepared. The appearance of C 1s peak around 284.60 eV arises from carbon used for calibration in the equipment. Furthermore, the high resolution XPS spectra of Bi 4f shows that the binding energies located at 165.0 and 160.0 eV correspond to Bi3+ 4f7/2 and Bi3+ 4f5/2 in B-1:3 sample (Fig. 4b).40 Two bands at 531.3 eV and 530.2 eV (Fig. 4c) are assigned to the surface adsorbed oxygen (Oads) and surface lattice oxygen (Olatt) from Bi–O bonds, respectively.41 From Fig. 4d, the two fitting peaks at 69.8 eV and 68.7 eV conform to Br 3d3/2 and Br 3d5/2 of Br− in B-1:3, respectively.42
3.2. Optical and photoelectrical properties
The optical absorption properties of the samples were achieved by using UV-vis DRS spectra (Fig. 5a). It can be observed that the absorption edge of the B-1:3 photocatalyst is the largest (ca. 438 nm). In addition to, the band gap energies can be determined by the equation for indirect band gap semiconductor: (ahv)1/2 = A(hv − Eg), where a, h, v, A, Eg represent absorption coefficient, Planck's constant, irradiation frequency, a constant and band gap energy, respectively.43 The band gap energies of B-W, B-1:1, B-1:3 and B-1:5 are estimated as 2.84, 2.83, 2.82 and 2.90 eV, respectively (Fig. 5b). That is to say, the band gap energy can be simply tuned by changing the solvent ratio. Obviously, the B-1:3 possesses the lowest band gap among them, which improves the optical absorption ability and endows the high photocatalytic property.44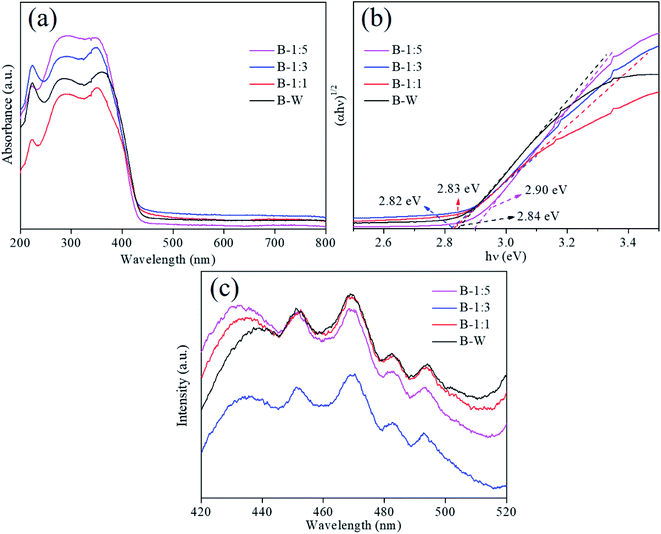 | ||
| Fig. 5 UV-vis diffuse reflectance spectra (a), plots of (αhν)2 versus hν (b) and PL spectra (c) of the as-prepared BiOBr samples. | ||
In order to verify the separation efficiency of photoexcited carriers, photoluminescence (PL) spectra were performed by using 320 nm wavelength ultraviolet light as the excitation source and presented in Fig. 5c. Generally, the weak PL intensity is suggestive of the rapid migration efficiency of photoinduced electron–hole pairs.45 It is clear that B-1:3 photocatalyst exhibits the weakest PL intensity, demonstrating suppressed e−–h+ pairs recombination and enhancement of separation efficiency, thus resulting in the outstanding photocatalytic activity.
The photocurrent transient response and the EIS Nyquist plots were also measured to better verify the separation efficiency of photo-electron hole pairs. As shown in the Fig. 6a, the B-1:3 performs a significantly stronger photocurrent response than that of B-1:1, B-1:5 and B-W, revealing that the suitable solvent ratio notably suppresses the recombination rate of photoinduced carriers and thus improves the photodegradation activity. Additionally, EIS plots (Fig. 6b) show that B-1:3 possesses the smallest arc radius, revealing that B-1:3 has minimal electron transfer resistance, thereby accelerating carrier's transfer and restraining the recombination of photogenerated charge carriers. Given the above facts, the B-1:3 with suitable solvent ratio is beneficial to expedite the mobility and separation of photo-electron hole pairs, then, realizing the outstanding photocatalytic activity.
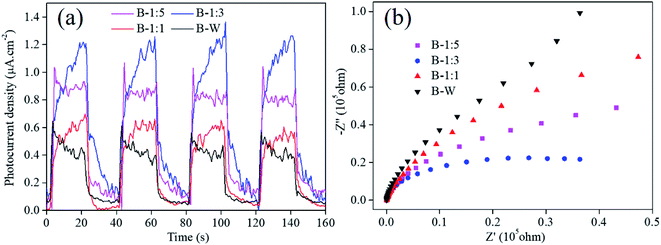 | ||
| Fig. 6 Transient photocurrent responses (a) and EIS Nyquist plots (b) of the as-prepared BiOBr samples. | ||
3.3. Photocatalytic activity
![[thin space (1/6-em)]](https://www.rsc.org/images/entities/char_2009.gif) :
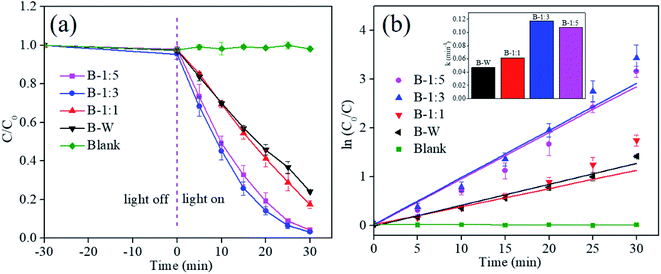
:![[thin space (1/6-em)]](https://www.rsc.org/images/entities/char_2009.gif) 3) can shorten the transfer distance of photoinduced e−–h+ pairs from the interior to the surface of photocatalyst, leading to the efficient separation of e−–h+ pairs and contributes to the excellent photoactivity.34 Impressively, degradation efficiency of the B-1:3 is far superior to that of reported BiOBr and modified BiOBr photocatalysts in the literature (Table S1†). To analyze the reaction kinetics of RhB degradation for BiOBr materials, the data was fitted according to the simplified Langmuir–Hinshelwood model: −ln(C/C0) = kt,46 and the result is presented in Fig. 7b. In here, the corresponding rate constant (k) can be obtained by the slope of the linear fitting curve. Encouragingly, the k value of B-1:3 is 0.117 min−1, which is 1.09, 1.89 and 2.49 times higher that of B-1:5 (1.107 min−1), B-1:1 (0.062 min−1) and B-W (0.047 min−1), respectively (inserted in Fig. 7b). The fact further verifies that the B-1:3 photocatalyst can efficiently photodegrade RhB dye.
3) can shorten the transfer distance of photoinduced e−–h+ pairs from the interior to the surface of photocatalyst, leading to the efficient separation of e−–h+ pairs and contributes to the excellent photoactivity.34 Impressively, degradation efficiency of the B-1:3 is far superior to that of reported BiOBr and modified BiOBr photocatalysts in the literature (Table S1†). To analyze the reaction kinetics of RhB degradation for BiOBr materials, the data was fitted according to the simplified Langmuir–Hinshelwood model: −ln(C/C0) = kt,46 and the result is presented in Fig. 7b. In here, the corresponding rate constant (k) can be obtained by the slope of the linear fitting curve. Encouragingly, the k value of B-1:3 is 0.117 min−1, which is 1.09, 1.89 and 2.49 times higher that of B-1:5 (1.107 min−1), B-1:1 (0.062 min−1) and B-W (0.047 min−1), respectively (inserted in Fig. 7b). The fact further verifies that the B-1:3 photocatalyst can efficiently photodegrade RhB dye.
3.4. Photocatalytic mechanism
In order to understand the underlying reaction mechanism, the scavenging experiments were conducted to identifying the reactive radical species with adding isopropanol (IPA), benzoquinone (BQ) and triethanolamine (TEOA) as hydroxyl radicals (·OH), superoxide radicals (·O2−) and hole (h+) scavengers, respectively. As shown in Fig. 9a, the removal rate significantly reduced in presence of BQ and TEOA, and degradation rate decreases by 73.1% and 88.5%, respectively (Fig. 9b), suggesting that ·O2− and h+ became the main responsible for boosting the degradation ability. Whereas, the effect of IPA on the removal efficiency can be neglected due to the similar result, representing that the reaction don't be controlled by the ·OH species. Consequently, the superoxide radicals (·O2−) and hole (h+) are the main active substances in the RhB photodegradation process.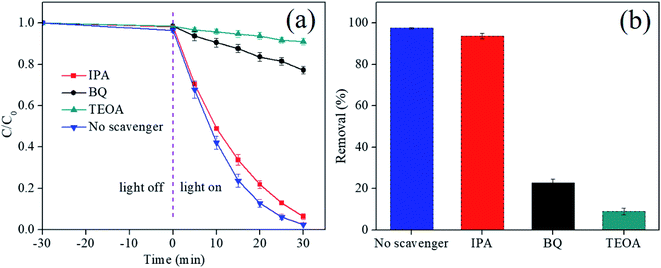 | ||
| Fig. 9 The degradation curves of RhB (a) and removal rates (b) with addition of different scavengers after 30 min illumination. Error bars are based on replicate measurements (nrep = 3). | ||
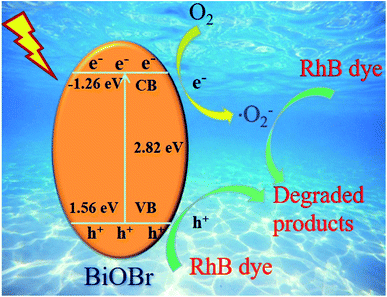
To further elaborate the photocatalytic mechanism, the energy band position of the B-1:3 sample was calculated according to the XPS valence spectrum (Fig. S4†) and the equation: ECB = EVB − Eg,50 where EVB and ECB are denoted as the valence band (VB) and the conduction band (CB) potential, respectively. Eg is the band gap of the semiconductor. As aforementioned, the Eg of B-1:3 is 2.82 eV according to the UV-vis DRS result. The VB-XPS reveals the EVB is 1.56 eV (Fig. S4†). The determined ECB of B-1:3 is −1.26 eV. Based on the above results, the band structure of B-1:3 was depicted in Scheme 2. As excepted, the CB of the B-1:3 is more negative than the reduction potential of E(O2/·O2−) (−0.33 V vs. NHE),51 thereby, O2 molecules can be adsorbed on the surface of BiOBr and further be dissolved to active superoxide radical (·O2−) decomposing the RhB into small molecules. Conversely, the valence band of B-1:3 is more lower than the redox potentials of H2O/·OH (+2.27 eV/NHE),52 signifying that the photogenerated holes can't directly oxidize H2O to produce ·OH radical. Thus, h+ will involve the oxidation process of RhB. The results are verified by the above trapping studies. The corresponding reaction equations are presented as:
| B-1:3 + hv = h+ + e− | (1) |
| e− + O2 = ·O2− | (2) |
| h+ + ·O2− + RhB dye = degraded products | (3) |
4. Conclusion
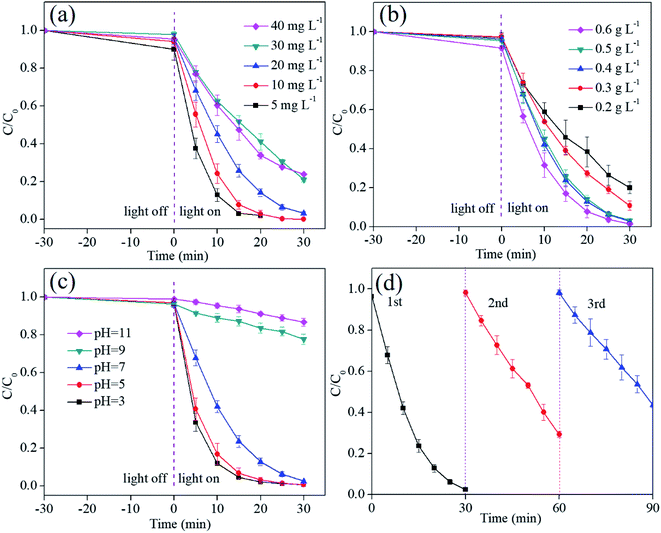
In summary, we constructed a serial of BiOBr nanosheets by tuning solvent ratios using a facile solvothermal method for highly efficient RhB photodegradation. The optimized B-1:3 shows the highest removal efficiency and can photodegrade 97% of RhB within 30 min, which is ascribed to the small particle size and thickness, enhanced light adsorption and accelerated separation of photoinduced electrons–holes. Through a series of parameter experiments, the optimum photodegradation conditions of RhB were determined to be m (B-1:3) = 0.4 g L−1, c (RhB) = 20 mg L−1, initial pH = 3 and 5. Additionally, it was confirmed that the holes and superoxide radical have a central influence on the photodegradation of RhB over B-1:3. The present study suggests that as-synthesized B-1:3 material is an excellent photocatalyst and will has potential application for relative wastewater treatment.Conflicts of interest
The authors declare that they have no known competing financial interests or personal relationships that could have appeared to influence the work reported in this paper.Acknowledgements
The authors thank the National Natural Science Foundation of China (No. 51572185), Natural Science Foundation of Shanxi Province (No. 20210302123176), the Key R&D Program of Shanxi Province (Social Development, No. 201903D321060) and the Key R&D Program of Shanxi Province (International Cooperation, No. 201903D421079) for the financial support.References
- Y. Wang, C. Zhu, G. Zuo, Y. Guo, W. Xiao, Y. Dai, J. Kong, X. Xu, Y. Zhou, A. Xie, C. Sun and Q. Xian, Appl. Catal., B, 2020, 278, 119298 CrossRef CAS.
- L. Li, D. Wei, G. Wei and Y. Du, J. Hazard. Mater., 2013, 262, 48–54 CrossRef CAS PubMed.
- M. Hao, H. Li, L. Cui, W. Liu, B. Fang, J. Liang, X. Xie, D. Wang and F. Wang, Environ. Chem. Lett., 2021, 19, 3573–3582 CrossRef CAS.
- X. Zhang, J. Wang, X. X. Dong and Y. K. Lv, Chemosphere, 2020, 242, 125144 CrossRef CAS PubMed.
- R. Saffari, Z. Shariatinia and M. Jourshabani, Environ. Pollut., 2020, 259, 113902 CrossRef CAS PubMed.
- Q. Zhao, K. Wang, J. Wang, Y. Guo, A. Yoshida, A. Abudula and G. Guan, ACS Appl. Nano Mater., 2019, 2, 2706–2712 CrossRef CAS.
- X. Zhang, G. Xu, J. Hu, J. Lv, J. Wang and Y. Wu, RSC Adv., 2016, 6, 63241–63249 RSC.
- F. Yi, J. Ma, C. Lin, H. Zhang, Y. Qian, H. Jin and K. Zhang, Chem. Eng. J., 2022, 427, 132028 CrossRef CAS.
- E. Garcia-Diaz, D. Zhang, Y. Li, R. Verduzco and P. J. J. Alvarez, Water Res., 2020, 183, 116095 CrossRef CAS PubMed.
- J. He, Y. Zhang, Y. Guo, G. Rhodes, J. Yeom, H. Li and W. Zhang, Environ. Int., 2019, 132, 105105 CrossRef CAS PubMed.
- M. Khan, C. S. L. Fung, A. Kumar and I. M. C. Lo, J. Hazard. Mater., 2019, 365, 733–743 CrossRef CAS PubMed.
- F. Yi, J. Ma, C. Lin, L. Wang, H. Zhang, Y. Qian and K. Zhang, J. Alloys Compd., 2020, 821, 153557 CrossRef CAS.
- H. Wang, B. Liao, T. Lu, Y. Ai and G. Liu, J. Hazard. Mater., 2020, 385, 121552 CrossRef CAS PubMed.
- Z. Mirzaeifard, Z. Shariatinia, M. Jourshabani and S. M. Rezaei Darvishi, Ind. Eng. Chem. Res., 2020, 59, 15894–15911 CrossRef CAS.
- J. Cai, S. Hu, J. Xiang, H. Zhang and D. Men, RSC Adv., 2020, 10, 40830–40842 RSC.
- F. Yi, H. Gan, H. Jin, W. Zhao, K. Zhang, H. Jin, H. Zhang, Y. Qian and J. Ma, Sep. Purif. Technol., 2020, 233, 115997 CrossRef CAS.
- H. Wu, C. Yuan, R. Chen, J. Wang, F. Dong, J. Li and Y. Sun, ACS Appl. Mater. Interfaces, 2020, 12, 43741–43749 CrossRef CAS PubMed.
- C. Gong, J. Chu, S. Qian, C. Yin, X. Hu, H. Wang, Y. Wang, X. Ding, S. Jiang, A. Li, Y. Gong, X. Wang, C. Li, T. Zhai and J. Xiong, Adv. Mater., 2020, 32, e1908242 CrossRef PubMed.
- M. M. Obeid, C. Stampfl, A. Bafekry, Z. Guan, H. R. Jappor, C. V. Nguyen, M. Naseri, D. M. Hoat, N. N. Hieu, A. E. Krauklis, T. V. Vu and D. Gogova, Phys. Chem. Chem. Phys., 2020, 22, 15354–15364 RSC.
- B. Zhang, M. Zhang, L. Zhang, P. A. Bingham, W. Li and S. Kubuki, Appl. Surf. Sci., 2020, 530, 147233 CrossRef CAS.
- Y. Liu, Z. Hu and J. C. Yu, Chemosphere, 2021, 278, 130376 CrossRef CAS PubMed.
- M. Huang, J. Li, W. Su, X. Huang, B. Li, M. Fan, L. Dong and H. He, CrystEngComm, 2020, 22, 7684–7692 RSC.
- Z. Wang, S. Shen, Z. Lin, W. Tao, Q. Zhang, F. Meng, L. Gu and W. Zhong, Adv. Funct. Mater., 2022, 2112832, DOI:10.1002/adfm.202112832.
- J. Sun, X. Li, Q. Zhao and B. Liu, Appl. Catal., B, 2021, 281, 119478 CrossRef CAS.
- Z. Wang, B. Xiao, Z. Lin, Y. Xu, Y. Lin, F. Meng, Q. Zhang, L. Gu, B. Fang, S. Guo and W. Zhong, Angew. Chem., 2021, 133, 23576–23581 CrossRef.
- X. Zou, Y. Yang, H. Chen, X. L. Shi, G. Suo, X. Ye, L. Zhang, X. Hou, L. Feng and Z. G. Chen, J. Colloid Interface Sci., 2020, 579, 463–469 CrossRef CAS PubMed.
- K. Bijanzad, A. Tadjarodi, M. Moghaddasi Khiavi and O. Akhavan, Phys. B, 2015, 475, 14–20 CrossRef CAS.
- T. Narenuch, T. Senasu, T. Chankhanittha and S. Nanan, J. Solid State Chem., 2021, 294, 121824 CrossRef CAS.
- S. Niu, R. Zhang, X. Zhang, J. Xiang and C. Guo, Ceram. Int., 2020, 46, 6782–6786 CrossRef CAS.
- S. Wu, C. Wang, Y. Cui, W. Hao, T. Wang and P. Brault, Mater. Lett., 2011, 65, 1344–1347 CrossRef CAS.
- M. Gao, D. Zhang, X. Pu, K. Ding, H. Li, T. Zhang and H. Ma, Sep. Purif. Technol., 2015, 149, 288–294 CrossRef CAS.
- A. Tadjarodi, O. Akhavan, K. Bijanzad and M. M. Khiavi, Monatsh. Chem., 2016, 147, 685–696 CrossRef CAS.
- T. Narenuch, T. Senasu, T. Chankhanittha and N. Suwat, J. Solid State Chem., 2021, 294, 121824 CrossRef CAS.
- Y. Mi, H. Li, Y. Zhang, N. Du and W. Hou, Catal. Sci. Technol., 2018, 8, 2588–2597 RSC.
- Y. Zheng, Y. Liu, X. Guo, W. Zhang, Y. Wang, M. Zhang, R. Li, Z. Peng, H. Xie and Y. Huang, Appl. Surf. Sci., 2021, 563, 150317 CrossRef CAS.
- E. Bárdos, V. Márta, L. Baia, M. Todea, G. Kovács, K. Baán, S. Garg, Z. Pap and K. Hernadi, Appl. Surf. Sci., 2020, 518, 146184 CrossRef.
- D. Liu, D. Chen, N. Li, Q. Xu, H. Li, J. He and J. Lu, Angew. Chem., 2020, 59, 4519–4524 CrossRef CAS PubMed.
- Z. Liu, B. Wu, D. Xiang and Y. Zhu, Mater. Res. Bull., 2012, 47, 3753–3757 CrossRef CAS.
- Z. Shi, Y. Zhang, X. Shen, G. Duoerkun, B. Zhu, L. Zhang, M. Li and Z. Chen, Chem. Eng. J., 2020, 386, 124010 CrossRef CAS.
- X. Hu, Y. Zhang, B. Wang, H. Li and W. Dong, Appl. Catal., B, 2019, 256, 117789 CrossRef CAS.
- X. Ding, K. Zhao and L. Zhang, Environ. Sci. Technol., 2014, 48, 5823–5831 CrossRef CAS PubMed.
- C. Liu, S. Mao, M. Shi, F. Wang, M. Xia, Q. Chen and X. Ju, J. Hazard. Mater., 2021, 420, 126613 CrossRef CAS PubMed.
- Y. Li, Z. Lai, Z. Huang, H. Wang, C. Zhao, G. Ruan and F. Du, Appl. Surf. Sci., 2021, 550, 149342 CrossRef CAS.
- S. Dong, L. Cui, W. Zhang, L. Xia, S. Zhou, C. K. Russell, M. Fan, J. Feng and J. Sun, Chem. Eng. J., 2020, 384, 123279 CrossRef CAS.
- X. Lv, D. Y. S. Yan, F. L.-Y. Lam, Y. H. Ng, S. Yin and A. K. An, Chem. Eng. J., 2020, 401, 126012 CrossRef CAS.
- H. Liu, C. Han, C. Shao, S. Yang, X. Li, B. Li, X. Li, J. Ma and Y. Liu, ACS Appl. Nano Mater., 2019, 2, 4879–4890 CrossRef CAS.
- F. Hayati, A. A. Isari, B. Anvaripour, M. Fattahi and B. Kakavandi, Chem. Eng. J., 2020, 381, 122636 CrossRef CAS.
- P. Li, M. Guo, Q. Wang, Z. Li, C. Wang, N. Chen, C.-C. Wang, C. Wan and S. Chen, Appl. Catal., B, 2019, 259, 118107 CrossRef CAS.
- C.-W. Chang and C. Hu, Chem. Eng. J., 2020, 383, 123116 CrossRef CAS.
- G. U. Rehman, M. Tahir, P. S. Goh, A. F. Ismail, A. Samavati, A. K. Zulhairun and D. Rezaei, Environ. Pollut., 2019, 253, 1066–1078 CrossRef PubMed.
- Y. Yang, G. Zeng, D. Huang, C. Zhang, D. He, C. Zhou, W. Wang, W. Xiong, B. Song, H. Yi, S. Ye and X. Ren, Small, 2020, 16, e2001634 CrossRef PubMed.
- A. N. Kadam, C. Bathula and S. W. Lee, Chemosphere, 2021, 275, 130086 CrossRef CAS PubMed.
Footnote |
| † Electronic supplementary information (ESI) available. See DOI: 10.1039/d2ra00375a |
| This journal is © The Royal Society of Chemistry 2022 |

