 Open Access Article
A comparative study of Cd(II) adsorption on calcined raw attapulgite and calcined aluminium hydroxide-modified attapulgites in aqueous solution
Qinhu Zhang ,
Run Chu,
Yuzhen Wei and
Liqun Cai*
College of Resources and Environment, Gansu Agricultural University, Lanzhou, 730070, China. E-mail: zhangqh@gsau.edu.cn; cailq@gsau.edu.cn
First published on 6th May 2022
Abstract
In this study, raw attapulgite and two aluminium hydroxide-modified attapulgites prepared using different aluminium salts were calcined at 600 °C to successfully prepare three novel adsorbents (C-ATP, C-ATP-SO42− and C-ATP-Cl−). The three adsorbents were characterized by transmission electron microscopy (TEM), Fourier transform infrared spectroscopy (FTIR), X-ray diffraction (XRD), Brunauer–Emmett–Teller (BET) analysis and X-ray photoelectron spectroscopy (XPS). Batch experiments revealed that the Cd(II) adsorption capacity of the three adsorbents increased with increasing pH, increasing the initial concentration of Cd(II) in solution, and with longer adsorption times. The order of adsorption capacity was always C-ATP > C-ATP-Cl− > C-ATP-SO42−. C-ATP and C-ATP-Cl− were better described by the Langmuir model, while C-ATP-SO42− was better described by the Freundlich model. The three adsorbents reached adsorption equilibrium within 2 h, and all followed pseudo-second order kinetics. The adsorption of Cd(II) onto the three adsorbents was physisorption, as suggested by the calculated thermodynamic parameters. Although the adsorption of Cd(II) on C-ATP and C-ATP-Cl− was exothermic, the adsorption on C-ATP-SO42− was endothermic. Ion exchange and cadmium precipitation were the primary mechanisms of cadmium adsorption on the three adsorbents analysed by XPS. The presence of SO42− in C-ATP-SO42− may result in weaker binding of Cd(II) by the adsorbent than C-ATP-Cl−.
1. Introduction
Cadmium is an element toxic to the environment.1 It cannot be degraded into harmless products, and it can readily accumulate in the human body.2 Additionally, even a very low dose can damage the liver, lungs, and kidneys, cause bone fractures, and destroy red blood cells.3 In the past several decades, an increasing amount of cadmium has been released into the environment through industrial wastewaters, mining operations and the burning of coal and oil.4 Water bodies are experiencing increasingly widespread cadmium pollution. Cadmium has become a primary water pollutant.5Attapulgite is used as an adsorbent for Cd(II) removal due to its nontoxicity, low cost and stability.6 However, it has a weak cadmium adsorption performance due to its small binding constants and selectivity.7 To enhance the adsorption performance of attapulgite, some researchers have coated metal hydroxides onto attapulgite and calcinated them at high temperatures to obtain metal oxide-modified attapulgite,8,9 which showed good results for removing Cd(II). However, these studies only mentioned the effect of the metal cations in metal salts on modified attapulgite, while the influence of the accompanying anions has rarely been discussed.10
Other researchers have analysed the influence of anions on adsorption considering the target pollutant solution medium. Wang used a modified composite material of chitosan/acrylic acid/attapulgite to adsorb Cd(II) from Cd(CH3COO)2, Cd(NO3)2, CdCl2 and CdSO4 solutions. Modified attapulgite significantly adsorbs Cd(II) from various cadmium salt solutions, and the adsorbent has the maximum Cd(II) adsorption capacity in Cd(CH3COO)2 solution.11 In solution, the anions that accompany the target pollutant affect adsorption. Minkina researched the adsorption of zinc from zinc nitrate, zinc acetate, zinc chloride, and zinc sulfate solutions on chernozem and found that the adsorption isotherms followed different adsorption equations. For example, zinc chloride conforms to Henry's equation, zinc sulfate conforms to Freundlich's equation, and zinc acetate and zinc nitrate conform to Langmuir and Freundlich's equations, respectively.12 Thus, anions have different effects on adsorption in the target heavy metal solution.
The role of the anions cannot be ignored as well as how the anions accompanied by the metal salts affect the modification effect in the study of metal oxide-modified attapulgite. These topics warrant further investigation. Wu found that the morphology of γ-AlOOH depends on the anion type, not the cation type. The anions affect the morphology, including the specific surface area.13 Therefore, we aimed to use metal salts that accompany different anions to modify attapulgite and for Cd(II) removal studies. While studying the adsorption capacity of the modified attapulgite for Cd(II), we gained insight into the effect of the different anions accompanied by the metal salts on the modification effect during the modification process.
In this study, we used two aluminium salts (Al2(SO4)3·18H2O and AlCl3·6H2O) to prepare aluminium hydroxide-modified attapulgite and calcined it at high temperature. Through a series of experiments, including adsorption kinetics and adsorption isotherm experiments, the effect of modified attapulgite on Cd(II) in aqueous solution was determined. Characterization methods, such as transmission electron microscopy (TEM), Fourier transform infrared spectroscopy (FTIR), X-ray diffraction (XRD), Brunauer–Emmett–Teller (BET) analysis and X-ray photoelectron spectroscopy (XPS), were analysed and discussed.
The main contents are listed below:
(1) calcined attapulgite (C-ATP) and calcined aluminium hydroxide-modified attapulgites (C-ATP-SO42−, C-ATP-Cl−) were successfully prepared at high temperatures;
(2) the adsorption performance of the adsorbents at different calcination temperatures was studied. The calcination temperature of 600 °C was deemed the preparation temperature of the adsorbent, and further studies were performed for Cd(II) adsorption;
(3) a series of factors, such as the initial pH, initial concentration of Cd(II), adsorption time and adsorbent dose, were used for performance analysis and comparison of the three adsorbents;
(4) C-ATP, C-ATP-SO42− and C-ATP-Cl− were analysed by TEM, FTIR, XRD, BET and XPS characterization methods to determine the differences in their microstructure and surface groups.
2. Materials and methods
2.1 Materials
Raw attapulgite was acquired from Jincheng Attapulgite Clay Co. Ltd (Gansu Province, China). The main reagents (AlCl3·6H2O, Al2(SO4)3·18H2O and Cd(NO3)2·4H2O) were all of analytical grade and came from Tianjin Damao Chemical Reagent Co. Ltd (Tianjin Province, China). Aqueous solutions were prepared using deionized water.2.2 Apparatus
The pH of the solution was determined using a Sartorius pH meter (PB-10, Germany). The Cd(II) content was determined by ICP-OES (ICP-5000, China). FTIR spectra were measured using a spectrophotometer (Nicolet IS50 FT-IR, USA). TEM images were acquired using a transmission electron microscope (JEM-1230, Japan). The XRD patterns were determined using a diffractometer (XD3, China). The surface areas were determined using the analyser on the N2 adsorption–desorption isotherms at 77 K (ASAP2460, USA). The interactions between the adsorbents and Cd(II) were probed using XPS (Thermo 250X, USA).2.3 Preparation of modified attapulgite
The preparation mainly included two processes. The first process was the preparation of aluminium hydroxide-modified attapulgite, which has been described in our previous work.14 Briefly, raw attapulgite (5.0 g) was mixed with 400 mL of deionized water. Next, 100 mL of a solution containing 3.58 g of AlCl3·6H2O (0.4 g Al) was added to the deionized water and stirred for 10 min. The solution pH was then increased to 7 by the dropwise addition of NaOH (1 mol L−1). The resulting suspension was stirred at 25 °C for 6 hours and allowed to stand for 12 hours. Next, the suspension was filtered and washed with deionized water several times until a white precipitate did not appear after adding AgNO3 solution to the filtrate. The filtered solids were dried at 110 °C for 24 hours and ground to a particle size of 200 mesh. The resulting powder was labelled ATP-Cl−. ATP-SO42− was prepared from Al2(SO4)3·18H2O using the same procedure.The second process was the calcination of raw ATP, ATP-SO42− and ATP-Cl− at different temperatures (200 °C, 300 °C, 400 °C, 500 °C, 600 °C, 700 °C, 800 °C) in a muffle furnace for 2 h at a heating rate of 50 °C per minute to prepare C-ATP, C-ATP-SO42− and C-ATP-Cl−, respectively.
2.4 Batch adsorption experiments
The adsorption experiments with C-ATP, C-ATP-SO42− and C-ATP-Cl− were performed simultaneously. Each solution was shaken in a thermostatic shaker bath (THZ-82A) at 160 rpm and 30 °C for 24 h. ICP-OES was used to determine the remaining Cd(II) concentration. We repeated each experiment three times.Eqn (1) was used to calculate the Cd(II) adsorption capacity of the adsorbents:
 | (1) |
3. Results and discussion
3.1 Removal rates of Cd(II) by calcined adsorbents
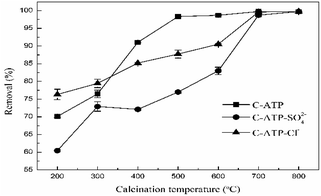
The Cd(II) removal rates of attapulgite modified with aluminium hydroxide at different calcination temperatures are shown in Fig. 1. As the calcination temperature increased, the removal rate of Cd(II) by C-ATP, C-ATP-SO42− and C-ATP-Cl− increased. High-temperature calcination of attapulgite also enhances the adsorption of Cd(II).15,16 Calcination removes some of the adsorbed water, and impurities such as dolomite from the attapulgite, increasing the number of micropores, the specific surface area and adsorption sites of the attapulgite.17When the calcination temperature was in the range of 200–300 °C, the removal rate of Cd(II) on the three adsorbents was C-ATP-Cl− > C-ATP > C-ATP-SO42−, and the removal rate of C-ATP-Cl− was above 75%. Thus, in the calcination temperature range of 200∼300 °C, C-ATP-Cl− can adsorb more Cd(II) than C-ATP and C-ATP-SO42−. This result was similar to that of a previous study on uncalcined aluminium hydroxide-modified attapulgite.14 Because the active sites of C-ATP-Cl− included silanol groups on the surface of the attapulgite and hydroxyl groups loaded on the surface after modification, which increases the number of adsorption sites, the removal rate of C-ATP-Cl− was higher than that of C-ATP. However, the removal rate of C-ATP-SO42− was low. One reason is that some SO42− formed clusters with Al, blocked the ATP pores and inhibited the ingress of Cd(II),18 resulting in a decrease in the adsorption performance.
Another reason is that SO42− affects the binding strength of Cd(II) on the surface of attapulgite.12
At calcination temperatures in the range of 400–600 °C, the removal rates of C-ATP noticeably increased and reached 99% above 500 °C. The removal rates of C-ATP-Cl− also increased and reached approximately 90% at 600 °C, which was lower than that of C-ATP. The removal by C-ATP-SO42− was always lower than that by C-ATP and C-ATP-Cl−. When the calcination temperature was above 600 °C, the Cd(II) removal rates of the three adsorbents reached a maximum and were similar. Thus, a higher calcination temperature can noticeably improve the adsorption performance of the three adsorbents. Because of the low concentration of Cd(II), the removal rates of the three adsorbents all reached saturation.
To further examine the differences among the three adsorbents, we chose a calcination temperature of 600 °C as the best calcination temperature of the material. This temperature is consistent with the results of other studies. Calcined attapulgite exhibited the best adsorption of heavy metals when the calcination temperature was between 500 and 700 °C.19,20 In subsequent batch sorption experiments, C-ATP, C-ATP-SO42− and C-ATP-Cl− were all prepared at a calcination temperature of 600 °C.
3.2 Effect of the pH
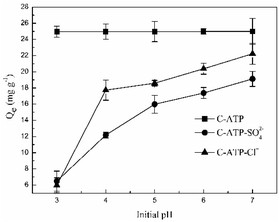
The effect of the initial pH on Cd(II) adsorption is shown in Fig. 2. The adsorption capacities of C-ATP-SO42− and C-ATP-Cl− for Cd(II) increased with increasing initial pH of the solution, reaching a maximum at pH 7. The adsorption capacity of C-ATP-Cl− was always higher than that of C-ATP-SO42−.However, the adsorption capacity of C-ATP for Cd(II) had already reached saturation and was higher than that of C-ATP-Cl− and C-ATP-SO42− in the pH range of 3–7. This result indicated that C-ATP has a very good adsorption effect even when the pH varies.
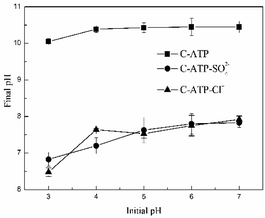
When the adsorption reached equilibrium, the changes in the solution pH of the three adsorbents are shown in Fig. 3. The final pH of the C-ATP-SO42− and C-ATP-Cl− solutions increased under different initial pH conditions. The change curves of C-ATP-SO42− and C-ATP-Cl− were very similar in the pH range of 3–7. However, the final pH of the C-ATP solution exceeded 10, which is significantly different from that of C-ATP-SO42− and C-ATP-Cl−. One reason for the high final pH is that CaO was formed after calcination of the raw attapulgite, and the dissolution of the CaO caused the pH of the solution to increase.21 Another reason is that the silanol groups of C-ATP were easily protonated to form SiOH2+, which caused the solution pH to increase.14
The final pH of the C-ATP-SO42− and C-ATP-Cl− solutions did not increase much after adsorption. However, SO42− and Cl− can decrease the solution pH.12 Therefore, the pH changes of C-ATP-SO42− and C-ATP-Cl− are quite different from that of C-ATP.
An excessively high pH causes Cd(II) to precipitate out of the solution, likely explaining why the adsorption capacity of C-ATP was higher than that of C-ATP-SO42− and C-ATP-Cl−. Therefore, in subsequent experiments, the optimum pH for Cd(II) adsorption by C-ATP, C-ATP-SO42− and C-ATP-Cl− was pH 6.0. The pH change of the solution was controlled throughout the process.
3.3 Adsorption isotherms
Fig. 4 shows the adsorption isotherms of Cd(II) adsorption onto C-ATP, C-ATP-SO42− and C-ATP-Cl− at different adsorption temperatures (293 K, 303 K and 313 K). As the equilibrium concentration of Cd(II) increases, the adsorption capacity of the three adsorbents also increases. When the equilibrium Cd(II) concentration reaches a certain value, the adsorption capacity reaches equilibrium. At this time, the adsorption site is completely occupied by Cd(II), so the adsorption capacity no longer increases.22 | ||
| Fig. 4 Equilibrium isotherms for Cd(II) adsorption at different temperatures by the three adsorbents: (a) 293 K, (b) 303 K, and (c) 313 K. | ||
However, in the temperature range of 293–313 K, the order of the adsorption capacity was C-ATP > C-ATP-Cl− > C-ATP-SO42−. Thus, C-ATP displayed a better adsorption performance than C-ATP-SO42− and C-ATP-Cl−.
Adsorption isotherm models can help researchers perform in-depth analysis and discussion of changes in the adsorption process and better elucidate the adsorption mechanism. This analysis lays a solid theoretical foundation for the wide application of adsorption. The most commonly used adsorption models include the Langmuir model and Freundlich model.
The Langmuir model states that the adsorption of pollutant molecules on the surface of the adsorption material is limited to single-layer adsorption on the surface, the adsorption sites are uniformly distributed on the surface of the material, and the interaction between molecules can be ignored.23 This model obeys Henry's law, which describes dilute solutions, when the adsorbate concentration is low, and its equation is eqn (2):
 | (2) |
The Freundlich model indicates that adsorption occurs on a heterogeneous surface.24 The equation is as shown in eqn (3):
| Qe = KfC1/ne | (3) |
The fitting parameters of the two models are presented in Table 1.
| T (K) | Langmuir | Freundlich | |||||
|---|---|---|---|---|---|---|---|
| Qmax (mg g−1) | KL (L mg−1) | r2 | Kf (mg g−1) (L mg−1)1/n | 1/n | r2 | ||
| C-ATP | 293 | 172.66 | 0.0065 | 0.986 | 1.297 | 0.897 | 0.981 |
| 303 | 108.09 | 0.0110 | 0.991 | 1.505 | 0.827 | 0.981 | |
| 313 | 71.16 | 0.0179 | 0.992 | 2.075 | 0.708 | 0.982 | |
| C-ATP-SO42− | 293 | 11.74 | 0.0589 | 0.960 | 1.648 | 0.388 | 0.962 |
| 303 | 13.29 | 0.0529 | 0.953 | 1.867 | 0.384 | 0.955 | |
| 313 | 18.76 | 0.0229 | 0.977 | 1.256 | 0.499 | 0.983 | |
| C-ATP-Cl− | 293 | 20.02 | 0.0876 | 0.959 | 2.987 | 0.399 | 0.936 |
| 303 | 17.83 | 0.1022 | 0.967 | 3.041 | 0.370 | 0.921 | |
| 313 | 15.23 | 0.0678 | 0.989 | 2.281 | 0.381 | 0.946 | |
The correlation coefficients (r2) of the Langmuir and Freundlich models for C-ATP, C-ATP-SO42− and C-ATP-Cl− were compared at different temperatures. C-ATP and C-ATP-Cl− are better described by the Langmuir model at all three temperatures, suggesting that a single layer of Cd(II) covered the surface of the adsorbent.
However, C-ATP-SO42− fits the Freundlich model better than the Langmuir model, showing that Cd(II) adsorption occurred on a heterogeneous surface, which can be explained by Cd(II) having a higher polarizability.25 Hence, when the temperature increases, the adsorption of C-ATP-SO42− becomes more intense because of the strong vibrations of the bonds.16
The Qm of C-ATP, C-ATP-SO42− and C-ATP-Cl− was calculated at different temperatures by the Langmuir model. As the adsorption temperature increased, the maximum adsorption capacity of C-ATP-SO42− increased, while the maximum adsorption capacity of C-ATP and C-ATP-Cl− decreased. The reason may be that the presence of SO42− affects certain properties of the attapulgite, resulting in a higher polarisation of C-ATP-SO42−. However, at the same temperature, the order of maximum adsorption capacity remains C-ATP > C-ATP-Cl− > C-ATP-SO42−.
3.4 Adsorption kinetics
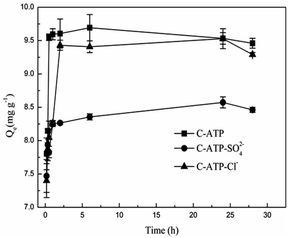
Fig. 5 shows the effect of the adsorption time on Cd(II) adsorption by C-ATP, C-ATP-SO42− and C-ATP-Cl−. As the adsorption time increased, the adsorption capacity of the three adsorbents on Cd(II) increased rapidly, and the adsorption reached equilibrium within 2 h. The adsorption capacities of C-ATP and C-ATP-Cl− were relatively similar, while the Cd(II) adsorption capacity of C-ATP-SO42− was significantly lower than that of the other two adsorbents. Throughout the process, the order of the adsorption capacities was C-ATP > C-ATP-Cl− > C-ATP-SO42−.Generally, the adsorption of the target pollutant by the adsorbent can be simulated using pseudo-first-order (eqn (4)) and pseudo-second-order (eqn (5)) kinetics. We used the linearized forms of these two kinetic models to fit the experimental data.
 | (4) |
 | (5) |
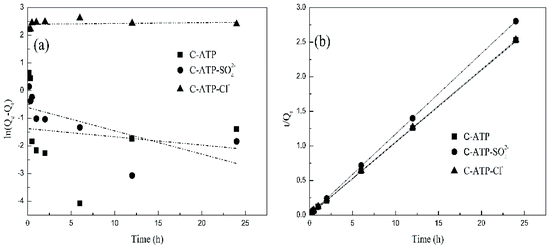 | ||
| Fig. 6 Kinetic fitting of Cd(II) adsorption on the three adsorbents: (a) pseudo-first-order model; (b) pseudo-second-order model. | ||
The calculated parameters are shown in Table 2. The pseudo-first-order models of C-ATP, C-ATP-SO42− and C-ATP-Cl− had low correlation coefficients. The correlation coefficients of the three adsorbents in the pseudo-second-order model were all 0.999. Additionally, the Qe (Qe,cal) values calculated by the pseudo-second-order kinetic model were closer to the Qe,exp values than those from the experiment. Hence, the adsorption of Cd(II) on C-ATP, C-ATP-SO42− and C-ATP-Cl− is best described by the pseudo-second-order model.
| Qe,exp (mg g−1) | Pseudo-first-order | Pseudo-second-order | |||||
|---|---|---|---|---|---|---|---|
| Qe,cal (mg g−1) | k1 (h−1) | r2 | Qe,cal (mg g−1) | k2 (g mg−1 min−1) | r2 | ||
| C-ATP | 9.71 | 0.245 | 0.040 | 0.018 | 9.47 | −7.43 | 0.999 |
| C-ATP-SO42− | 8.62 | 0.595 | 0.171 | 0.699 | 8.48 | 3.96 | 0.999 |
| C-ATP-Cl− | 9.69 | 10.972 | −0.004 | 0.026 | 9.35 | 4.45 | 0.999 |
The sum of the squares of errors (SSE) and Chi-square test (χ2) were used to verify the best fit between the above two kinetic models.26 The equations describing χ2 and the SSE are shown in eqn (6) and eqn (7), respectively. The inspection parameters are shown in Table 3.
 | (6) |
| SSE = ∑(qe,theor − qe,meas)2 | (7) |
| Pseudo-first-order | Pseudo-second-order | ||
|---|---|---|---|
| C-ATP | χ2 | 365.65 | 0.0060 |
| SSE | 89.58 | 0.0576 | |
| C-ATP-SO42− | χ2 | 108.23 | 0.0023 |
| SSE | 64.40 | 0.0196 | |
| C-ATP-Cl− | χ2 | 0.149 | 0.0123 |
| SSE | 1.643 | 0.1156 |
The χ2 and SSE values of the three adsorbents are lower in the pseudo-second-order model than in the pseudo-first-order model. This result suggests that the pseudo-second-order model better describes the adsorption of Cd(II) on C-ATP, C-ATP-SO42− and C-ATP-Cl−, a finding that is consistent with the previous kinetic fitting results.
3.5 Adsorption thermodynamics
Whether the process is endothermic or exothermic can be evaluated by the change in the adsorption rate at different temperatures. The thermodynamic parameters, including the Gibbs free energy change (ΔG°), entropy change (ΔS°) and enthalpy change (ΔH°), were calculated by eqn (8)–(10):
ΔG° = −RT![[thin space (1/6-em)]](https://www.rsc.org/images/entities/char_2009.gif) ln ln![[thin space (1/6-em)]](https://www.rsc.org/images/entities/char_2009.gif) Kc Kc
| (8) |
 | (9) |
| Kc = 1000 Kd | (10) |
![[thin space (1/6-em)]](https://www.rsc.org/images/entities/char_2009.gif) Kd values are obtained by plotting ln(qe/ce) versus Ce and extrapolating Ce to zero, and the Kd (L g−1) values calculated from the ln
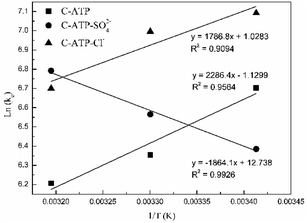
Kd values are obtained by plotting ln(qe/ce) versus Ce and extrapolating Ce to zero, and the Kd (L g−1) values calculated from the ln![[thin space (1/6-em)]](https://www.rsc.org/images/entities/char_2009.gif) Kd can be converted into KC (as imestionless) by multiplying Kd by a factor of 1000.27 KC and Kd is the equilibrium constant and distribution coefficient, respectively. The ln(Kc) value and 1/T were used as the vertical and horizontal coordinates, respectively, to plot a straight line (Fig. 7), and ΔH° and ΔS° were calculated from the slope and intercept of the line.
Kd can be converted into KC (as imestionless) by multiplying Kd by a factor of 1000.27 KC and Kd is the equilibrium constant and distribution coefficient, respectively. The ln(Kc) value and 1/T were used as the vertical and horizontal coordinates, respectively, to plot a straight line (Fig. 7), and ΔH° and ΔS° were calculated from the slope and intercept of the line.
Table 4 lists the thermodynamic parameters of Cd(II) adsorption on C-ATP, C-ATP-SO42− and C-ATP-Cl−. The ΔG° values of the three adsorbents are all negative at 293, 303 and 313 K, indicating that the adsorption processes are spontaneous.28 This result also shows that the three adsorbents mainly adsorb Cd(II) via physisorption because the ΔG° values are in the range of −20 to 0 kJ mol−1.29
| T (K) | ln![[thin space (1/6-em)]](https://www.rsc.org/images/entities/char_2009.gif) Kd Kd |
Kd (L g−1) | ln![[thin space (1/6-em)]](https://www.rsc.org/images/entities/char_2009.gif) Kc Kc |
ΔH° (kJ mol−1) | ΔS° (J mol−1 K−1) | ΔG° (kJ mol−1) | |
|---|---|---|---|---|---|---|---|
| C-ATP | 293 | −0.2044 | 0.8151 | 6.7033 | −19.00 | −9.39 | −16.32 |
| 303 | −0.5531 | 0.5751 | 6.3546 | −15.47 | |||
| 313 | −0.7010 | 0.4960 | 6.2067 | −15.11 | |||
| C-ATP-SO42− | 293 | −0.5226 | 0.5929 | 6.3851 | 15.49 | 105.90 | −15.54 |
| 303 | −0.3427 | 0.7098 | 6.5650 | −15.99 | |||
| 313 | −0.1154 | 0.8910 | 6.7923 | −16.54 | |||
| 293 | 0.1843 | 1.2023 | 7.0920 | −17.27 | |||
| C-ATP-Cl− | 303 | 0.0884 | 1.0924 | 6.9961 | −14.85 | 8.54 | −17.04 |
| 313 | −0.2077 | 0.8124 | 6.7000 | −16.32 |
The ΔH° values of C-ATP, C-ATP-SO42− and C-ATP-Cl− for Cd(II) adsorption are −19.00, 15.49 and −14.85 kJ mol−1, respectively. Thus, the adsorption of Cd(II) on C-ATP and C-ATP-Cl− is exothermic, and the adsorption of Cd(II) on C-ATP-SO42− is endothermic. Therefore, the adsorption of C-ATP and C-ATP-Cl− on Cd(II) becomes weaker as the temperature increases.16 The ΔS° values of Cd(II) adsorption on C-ATP, C-ATP-SO42− and C-ATP-Cl− are −9.39, 105.90 and 8.54 J mol−1 K−1, respectively, indicating that the adsorption of Cd(II) on C-ATP proceeds with decreasing entropy, while Cd(II) adsorption on C-ATP-SO42− and C-ATP-Cl− proceeds with increasing entropy.30
3.6 Effect of the adsorbent dose
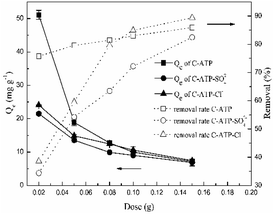
The effect of the doses of C-ATP, C-ATP-SO42− and C-ATP-Cl− on the adsorption of Cd(II) is illustrated in Fig. 8. The removal rate of Cd(II) increased with increasing doses of the three adsorbents. This result may be due to an increasing number of adsorption sites.16 By contrast, the adsorption capacity (Qe) decreased with increasing doses of the three adsorbents.When the three adsorbent doses were in the range of 0.02–0.1 g per 25 mL, the order of the removal rate was C-ATP > C-ATP-Cl− > C-ATP-SO42−. However, when the doses were greater than 0.1 g, the removal rate order was C-ATP-Cl− > C-ATP > C-ATP-SO42−. Thus, with increasing dose, the adsorption of Cd(II) by C-ATP and C-ATP-Cl− is obvious and almost reaches adsorption equilibrium at 0.1 g. When cost-effectiveness and adsorption performance were considered, the selected optimal dose of the three adsorbents was 0.1 g of adsorbent per 25 mL of solution.
3.7 Adsorbent characterization
Fig. 9c shows that the rod-like crystals of C-ATP-Cl− are also broken, and agglomeration was observed. The degree of agglomeration is lower than that of C-ATP-SO42−, and there are also fibrous flocs around it. Generally, the rod-like crystal morphology of the three modified attapulgites treated at 600 °C is still maintained, and the crystal structure is not completely destroyed. However, the degree of agglomeration of the three adsorbents is different, particularly between C-ATP-SO42− and C-ATP-Cl−, and the difference in the degree of agglomeration of the rod crystals is obvious.
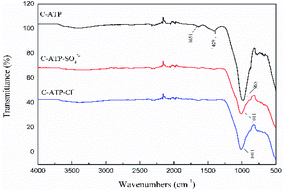
The bands at 1651 cm−1 and 1409 cm−1 disappeared in the spectra of C-ATP-SO42− and C-ATP-Cl−, indicating that the adsorbed water and carbonate minerals were eliminated at high temperatures. The reason is that the aluminium salt may have reacted with the carbonate during the modification process.34 The carbonate was then completely removed by calcination at 600 °C. The strong vibration band at 985 cm−1 is shifted to 1011 cm−1 in the spectra of C-ATP-SO42− and C-ATP-Cl−. The Si–O–Si bonds were noticeably fractured after the high-temperature calcination of C-ATP-SO42− and C-ATP-Cl−.
| Adsorbent | Surface area (m2 g−1) | Pore volume (cm3 g−1) | Average pore diameter (nm) |
|---|---|---|---|
| C-ATP | 17.3631 | 0.084224 | 19.4029 |
| C-ATP-SO42− | 18.1561 | 0.098575 | 21.7172 |
| C-ATP-Cl− | 28.8149 | 0.114495 | 15.8939 |
4. Comparison with other clays
The adsorption capacity varies according to the adsorption material, solution conditions and type of target pollutant. The maximum adsorption capacities (Qm) of Cd(II) calculated by the Langmuir model of different adsorbents were compared, and the data are presented in Table 6. Because the adsorbent material in this study was calcined, we used high-temperature calcined clays as a comparison. The adsorption performance of high-temperature calcined attapulgite or other clay for Cd(II) was significantly improved compared with that of raw attapulgite.| Material | Adsorption capacity (mg g−1) | Equilibrium time (h) | Adsorption conditions (pH, K) | Calcination temperature (K) | Reference |
|---|---|---|---|---|---|
| Attapulgite | 4.54 | 1.5 | 6.0, 295 | — | 38 |
| Ball clay-600 | 34.10 | 2 | 7.0, 298 | 873 | 39 |
| Vermiculite-600 | 8.50 | 2 | 7.0, 298 | 873 | 39 |
| T-ATP | 11.08 | 3 | 5.0, 298 | 773 | 16 |
| MgO-ATP | 24.50 | 3 | 5.0, 298 | 773 | 16 |
| Serpentine-700 | 17.68 | 2 | 6.0, 298 | 923 | 40 |
| C-ATP | 108.09 | 2 | 6.0, 303 | 873 | In this work |
| C-ATP-SO42- | 13.29 | 2 | 6.0, 303 | 873 | In this work |
| C-ATP-Cl− | 17.83 | 2 | 6.0, 303 | 873 | In this work |
Because of the different properties of the raw attapulgite and other clays, as well as the different methods of modification, some differences in adsorption properties appear after calcination. In this study, the adsorption properties of the two different aluminium salt-modified attapulgites improved after calcination at 600 °C. However, the differences between the two may be related to the different anions.
5. Adsorption mechanism
To investigate the adsorption mechanism of the three adsorbents in depth, XPS spectra of all the peaks were obtained before and after Cd(II) adsorption (Fig. 12). The new peak of Cd3d can be observed in the spectra of Cd-loaded adsorbents, indicating that C-ATP, C-ATP-SO42− and C-ATP-Cl− were successfully adsorbed Cd(II). The peaks for the anions Cl and S were largely absent, likely because the two anions Cl− and SO42− were present inside the adsorbent, and XPS was only used to analyse the material surface.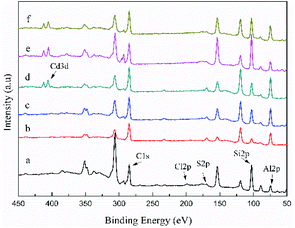 | ||
| Fig. 12 Wide scan XPS spectra of the three adsorbents before and after Cd(II) adsorption (a) C-ATP, (b) C-ATP-SO42−, (c) C-ATP-Cl−, (d) C-ATP-Cd, (e) C-ATP-SO42−-Cd, (f) C-ATP-Cl−-Cd. | ||
The high resolution of the XPS spectra of Al2p and Cd3d are presented in Fig. 13. Before Cd(II) adsorption, the binding energies of Al2p of C-ATP, C-ATP-SO42− and C-ATP-Cl− were essentially the same (Fig. 13a). After Cd(II) adsorption, the binding energies of Al2p shifted to a higher value (Fig. 13b). This result indicated that the aluminium-containing functional groups interacted with Cd(II).41 However, the binding energy of Al2p in C-ATP-Cl− was higher than that in C-ATP-SO42−. This result indicated that C-ATP-Cl− more easily adsorbed Cd(II) than C-ATP-SO42− when it absorbed Cd(II).
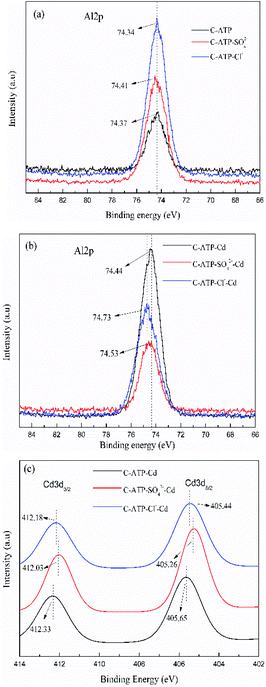 | ||
| Fig. 13 High resolution XPS spectra. (a) Al2P spectra before adsorption (b) Al2P spectra after adsorption (c) Cd3d spectra after adsorption. | ||
After Cd(II) was adsorbed, two peaks appeared near 412 and 405 eV corresponding to Cd3d3/2 and Cd3d5/2, respectively (Fig. 13c). The peaks of Cd3d5/2 could be ascribed to chelation (Cd–O) and deposition (CdCO3 and Cd(OH)2).42 This finding indicated that the adsorption of Cd(II) on the three adsorbents could be due to the ion exchange and precipitation of CdCO3 and Cd(OH)2.43
The order of the binding energy of the Cd3d values is C-ATP > C-ATP-Cl− > C-ATP-SO42−. Thus, C-ATP had a stronger affinity for Cd(II) than C-ATP-Cl− and C-ATP-SO42−. The binding energy of Cd3d values in C-ATP-Cl− was higher than that of C-ATP-SO42−, indicating that C-ATP-Cl− had a better affinity for Cd(II) than C-ATP-SO42.
Analysis showed that the specific surface areas of C-ATP-Cl− and C-ATP-SO42− were larger than that of C-ATP. However, the adsorption capacities of C-ATP-Cl− and C-ATP-SO42− were lower than that of C-ATP. This result seems contradictory. Considering the change in pH in solution after adsorption, the solution pH of C-ATP is much higher than that of C-ATP-SO42− and C-ATP-Cl− (Fig. 2). Thus, pH has a greater effect on the amount of adsorption than the specific surface area.40 However, the why the pH of the C-ATP solution increased substantially after adsorption remains unclear. The difference in the solution pH between C-ATP-SO42− and C-ATP-Cl− after adsorption was not significant, and the Cd(II) adsorption capacity of C-ATP-Cl− was higher than that of C-ATP-SO42, attributed to its greater specific surface area.
The adsorption capacity order is C-ATP-Cl− > C-ATP > C-ATP-SO42− at calcination temperatures below 400 °C, because ion exchange is dominant. When the calcination temperatures are above 400 °C, the adsorption capacity order is C-ATP > C-ATP-Cl− > C-ATP-SO42−, because the solution pH of C-ATP increases significantly after adsorption, and a large amount of Cd(II) is precipitated.
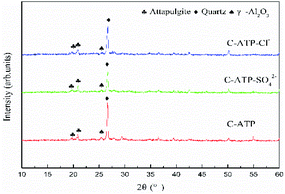
XPS also confirmed that the adsorption of Cd(II) by the three adsorbents occurred by precipitation and ion exchange. The influence of the two anions Cl− and SO42− on the adsorption properties during the preparation of C-ATP-Cl− and C-ATP-SO42− was not reflected in the characterization analysis, except for BET.
6. Conclusions
In this study, the adsorption of Cd(II) by the three adsorbents increased with increasing calcination temperature. However, differences in the adsorption effect of the three adsorbents occurred at different calcination temperature ranges. The three adsorbents of C-ATP, C-ATP-Cl− and C-ATP-SO42− calcined at 600 °C were compared.The Langmuir model fit better for C-ATP and C-ATP-Cl−, while the Freundlich model fit better for C-ATP-SO42−. These three adsorbents can be best described by pseudo-second order kinetics. The adsorption process was exothermic for C-ATP and C-ATP-Cl− and endothermic for C-ATP-SO42−. The adsorption of Cd(II) by all three adsorbents was dominated by ion exchange and cadmium precipitation. The reason for the highest adsorption of Cd(II) on C-ATP among the three adsorbents may be related to the predominance of cadmium precipitation. XPS analysis suggested that the presence of SO42− in C-ATP-SO42− may result in weaker binding of Cd(II) by the adsorbent compared to C-ATP-Cl−.
Overall, C-ATP-Cl− had an adsorption advantage at calcination temperatures below 400 °C. Above 400 °C, although the adsorption capacity of C-ATP-Cl− was weaker than that of C-ATP, it stabilized the solution pH better than that of C-ATP. Therefore, C-ATP-Cl− can still be considered in practical applications when considering the cost of adsorption and the pH requirements of the solution.
Conflicts of interest
There are no conflicts to declare.Acknowledgements
This work was supported by the Youth Science and Technology Fund Project of Gansu Province (No. 21JR7RA850), the Industrial Support Project of Colleges and Universities in Gansu Province (No. 2020C-39-2 and 2021CYZC-50).References
- C. Tiberg and J. Gustafsson, J. Colloid Interface Sci., 2016, 471, 103–111 CrossRef CAS PubMed.
- M. Rizwan, S. Ali, M. Z. U. Rehman, J. Rinklebe, D. C. W. Tsang, A. Bashir, A. Maqbool, F. M. G. Tack and Y. S. Ok, Sci. Total Environ., 2018, 631–632, 1175–1191 CrossRef CAS PubMed.
- Q. H. Zhong, Y. C. Zhou, D. Tsang, J. Liu, Y. Xiao, M. Yin, S. Wu, J. Wang, T. Xiao and Z. Zhang, Sci. Total Environ., 2020, 736, 139585 CrossRef CAS PubMed.
- K. Pyrzynska, J. Environ. Chem. Eng., 2019, 7(1), 102795 CrossRef CAS.
- S. J. Kulkarni and J. P. Kaware, Int. J. Eng. Sci. Manag. Res., 2015, 2(6), 1–5 Search PubMed.
- W. B. Wang, F. F. Wang, Y. R. Kang and A. Q. Wang, Water, Air, Soil Pollut., 2015, 226, 83 CrossRef.
- L. L. Wang, Y. Shi, D. K. Yao, H. Pan, H. J. Hou, J. Chen and J. C. Crittenden, Chem. Eng. J., 2019, 366, 569–576 CrossRef CAS.
- F. Zha, W. Y. Huang, J. Y. Wang, Y. Chang, J. Ding and J. Ma, Chem. Eng. J., 2013, 215–216, 579–585 CrossRef CAS.
- H. Wang, X. J. Wang, J. X. Ma, P. Xia and J. Zhao, J. Hazard. Mater., 2017, 329, 66–76 CrossRef CAS PubMed.
- J. X. Xu, W. B. Wang, B. Mu and A. Q. Wang, Colloids Surf., A, 2012, 405, 59–64 CrossRef CAS.
- X. H. Wang and A. Q. Wang, Environ. Technol., 2010, 31, 745–753 CrossRef CAS PubMed.
- T. M. Minkina, D. L. Pinskiy, T. V. Bauer, S. S. Mandzhieva, O. N. Belyaeva, V. P. Kalinichenko and A. P. Endovitsky, J. Geochem. Explor., 2014, 144, 226–229 CrossRef CAS.
- X. Y. Wu, PhD thesis, Qindao University of Science and Technology, in Chinese, 2016.
- Q. H. Zhang and L. Q. Cai, Pol. J. Environ. Stud., 2021, 30, 2905–2915 CrossRef CAS.
- W. J. Wang, H. Chen and A. Q. Wang, Sep. Purif. Technol., 2007, 55, 157–164 CrossRef CAS.
- R. L. Huang, Q. T. Lin, Q. F. Zhong, X. F. Zhang, X. Wen and H. Luo, Arabian J. Chem., 2020, 13, 4994–5008 CrossRef CAS.
- A. X. Zhou and J. S. Wang, J. Radioanal. Nucl. Chem., 2018, 318, 1119–1129 CrossRef CAS.
- D. S. Hou, Y. T. Jia, J. Yu, P. G. Wang and Q. Liu, J. Phys. Chem. C, 2018, 122, 28021–28032 CrossRef CAS.
- S. H. Lin, T. T. Zhou and S. S. Yin, Clays Clay Miner., 2017, 65, 184–192 CrossRef CAS.
- T. Falayi and F. Ntuli, Korean J. Chem. Eng., 2015, 32, 707–716 CrossRef CAS.
- I. Blanco, P. Molle, L. E. Saenz de Miera and G. Ansola, Water Res., 2016, 89, 355–365 CrossRef CAS PubMed.
- Q. Huang, M. Y. Liu, J. Zhao, J. Y. Chen, G. Zeng, H. Huang, J. Tian, Y. Wen, X. Zhang and Y. Wei, Appl. Surf. Sci., 2018, 427, 535–544 CrossRef CAS.
- I. Langmuir, J. Am. Chem. Soc., 1917, 40, 1361 CrossRef.
- H. Freundlich, Environ. Sci. Tech., 1906, 20, 385–470 Search PubMed.
- S. Deng, P. Wang and Y. Dou, J. Hazard. Mater., 2016, 307, 64–72 CrossRef CAS PubMed.
- R. R. Karri, J. N. Sahu and N. S. Jayakumar, J. Taiwan Inst. Chem. Eng., 2017, 80, 472–487 CrossRef CAS.
- H. N. Tran, S. J. You and H. P. Chao, J. Environ. Chem. Eng., 2016, 4, 2671–2682 CrossRef CAS.
- A. Gil, M. J. Amiri, J. Abedi-Koupai and S. Eslamian, Environ. Sci. Pollut. Res. Int., 2018, 25, 2814–2829 CrossRef CAS PubMed.
- T. Falayi and F. Ntuli, J. Ind. Eng. Chem., 2014, 20, 1285–1292 CrossRef CAS.
- G. F. El-Said, E. S. M. Abdelrehim, M. E.-S. Elba and S. M. H. A. Kawy, Environ. Monit. Assess., 2019, 191, 311 CrossRef CAS PubMed.
- H. B. Yin, X. W. Yan and X. H. Gu, Water Res., 2017, 115, 329–338 CrossRef CAS PubMed.
- J. Jia, W. D. Liang, H. X. Sun, Z. Zhu, C. Wang and A. Li, Chem. Eng. J., 2019, 361, 999–1006 CrossRef CAS.
- H. B. Yin, M. Kong and C. X. Fan, Water Res., 2013, 47, 4247–4258 CrossRef CAS PubMed.
- W. B. Wang, G. Y. Tian, Z. F. Zhang and A. Q. Wang, Chem. Eng. J., 2015, 265, 228–238 CrossRef CAS.
- Y. Z. Wang, J. Shi, R. f. Wu, X. Li and Y. X. Zhao, Appl. Clay Sci., 2016, 119, 126–131 CrossRef CAS.
- H. C. Chen, C. S. Zhao and W. W. Yu, Appl. Energy, 2013, 112, 67–74 CrossRef CAS.
- S. Tabesh, F. Davar and M. Loghman-Estarki, J. Alloys Compd., 2017, 730, 43302 Search PubMed.
- E. álvarez-Ayuso and A. García-Sánchez, J. Hazard. Mater., 2007, 147, 594–600 CrossRef PubMed.
- E. Padilla-Ortega, N. Medellin-Castillo and A. Robledo-Cabrera, J. Environ. Chem. Eng., 2020, 8, 103850 CrossRef CAS.
- C. Y. Cao, C. H. Liang, Y. Yin and L. Y. Du, J. Hazard. Mater., 2017, 329, 222–229 CrossRef CAS PubMed.
- Z. D. Peng, X. M. Lin, Y. L. Zhang, Z. Hu, X. J. Yang, C. Y. Chen, H. Y. Chen, Y. T. Li and J. J. Wang, Sci. Total Environ., 2021, 772, 145355 CrossRef CAS PubMed.
- J. H. Guo, C. Z. Yan, Z. X. Luo, H. D. Fang, S. G. Hu and Y. L. Cao, J. Environ. Sci., 2019, 85, 168–176 CrossRef PubMed.
- Z. H. Khan, M. L. Gao, W. W. Qiu, M. S. Islam and Z. G. Song, Chemosphere, 2020, 246, 125701 CrossRef CAS PubMed.
| This journal is © The Royal Society of Chemistry 2022 |

