 Open Access Article
Indium silicate with an imandrite-type structure†
Stanislav Ferdov *a,
Boris Shivachev
 *b,
Rositsa Titorenkovab,
Nadia Petrovab,
Mihail Tarassovb and
Rositsa Nikolovab
aCenter of Physics of the Universities of Minho and Porto, University of Minho, 4800-058 Guimarães, Portugal. E-mail: sferdov@fisica.uminho.pt
bInstitute of Mineralogy and Crystallography, Bulgarian Academy of Sciences, Sofia, 1113, Bulgaria. E-mail: blshivachev@gmail.com
First published on 26th April 2022
Abstract
This work reports the synthesis and characterization of novel zeolite-like indium silicate MS-2 (Minho-Sofia, solid number 2). The structure of this material is analogous to that of the mineral imandrite (Na6Ca1.5FeSi6O18), with In instead of Fe in the octahedral position. MS-2 is the first structurally confirmed indium silicate prepared under mild hydrothermal conditions and the only synthetic indium silicate related to the lovozerite mineral group. MS-2 (Na6.23Ca1.62In0.68Si6O18) exhibits significant indium deficiency in the octahedral position thus having the highest Si/In (8.8) ratio among the known indium silicates. The framework consists of occupationally disordered InO6 octahedra interconnected by 6-membered rings of [Si6O18] tetrahedra. The three-dimensional (3D) tunnel system is occupied by Na+ and Ca2+ charge-balancing ions. The low framework density (16.2 FC/1000 Å3) and high thermal stability (up to 900 °C) are comparable to other molecular sieves.
Introduction
Creating laboratory conditions for the crystallization of rare mineral counterparts has long been a challenge and a source of fundamental knowledge for the development of new research areas.1,2 For example, polyhedral metal silicates, initially referred to as exotic minerals, now represent a distinct class of synthetic solids whose chemistry far exceeds that of nature.1,2 However, following a series of structures reported in the 1990s and the first decade of the 21st century, the synthesis of novel microporous metal silicates is currently a relatively rare achievement. Our previous efforts have led to a strategy for the synthesis of microporous metal silicates using a combination of alkaline and alkaline-earth cations as structure-directing agents. Thus, we obtained the Ba–Na microporous zirconosilicate MCV-2 (Ba2(Na,H2O)3Zr2Si6O19·3H2O),3 and more recently, the Ca–Na microporous iron silicate MS-1 (Na6.7Ca1.3FeSi6O18),4 which is an analogue of the rare mineral imandrite (Na6Ca1.5FeSi6O18)5 and is classified as a zeolite-like cyclosilicate of the lovozerite mineral group.6In this paper, we extend our interest to indium silicates. In nature, indium minerals are rare, and to our knowledge, there are no examples of natural indium-based silicates. The synthetic indium silicates unlike other tetrahedral–octahedral structures (titanosilicates, vanadosilicates, zirconosilicates, tin silicates, and others), typically crystallize at high temperatures (500–1200 °C) and/or high pressures (132–7000 MPa)1 (Table 1). The only work reporting the mild hydrothermal synthesis of indium silicates is a patent, which however does not contain information about the crystal structure.7 Previous reports describe the synthesis of indium-based nesosilicates (Ca3In2Si2O12,8,9 – garnet structure, LiInSiO4 (ref. 10) – olivine structure, Na2MnIn(SiO3(OH))2(OH)11), sorosilicates (In2Si2O7 (ref. 12) – pyrochlore structure, Pb2In2Si2O9 (ref. 9 and 13) – kentrolite/melanotekite structure), cyclosilicates (Be3In2Si6O18 (ref. 9) – beryl structure, Rb6(InCo)2(Si9O26),14 Rb3In(H2O)Si5O13,15 Na5InSi4O12 (ref. 16)) and inosilicates (NaInSi2O6,9,17 LiInSi2O6 (ref. 18) – pyroxene structure, K2In(OH)(Si4O10)19 – litidionite structure, Rb5In3Si7O21,15 K4In2Si8O21,20 and K5In3Si7O21 (ref. 20)).
| Phase | T (°C) | P (MPa) | Ref. |
|---|---|---|---|
| Ca3In2Si2O12 | 550 | 132 | 8 |
| 575 | 200 | 9 | |
| Be3In2Si6O18 | 550 | 200 | 9 |
| NaInSi2O6 | 720 | 200 | 9 |
| 750–1200 | N/A | 9 | |
| LiInSi2O6 | 1100 | N/A | 18 |
| LiInSiO4 | 1200 | N/A | 10 |
| In2Si2O7 | 1000 | 1000 | 21 |
| 1000 | 7000 | 22 | |
| 680 | 200 | 9 | |
| 1150 | N/A | 9 | |
| 1000 | N/A | 12 | |
| Pb2In2Si2O9 | 500 | 200 | 9 |
| 900 | N/A | 9 | |
| K2In(OH)(Si4O10) | 600 | 170 | 19 |
| Rb6(InCo)2(Si9O26) | 600 | 170 | 14 |
| Rb3In(H2O)Si5O13 | 600 | 170 | 15 |
| Rb5In3Si7O21 | 600 | 170 | 15 |
| Na5InSi4O12 | 600 | 170 | 16 |
| Na2MnIn[SiO3(OH)]2(OH) | 450 | N/A | 11 |
| K4In2Si8O21 | 750 | N/A | 20 |
| K5In3Si7O21 | 750 | N/A | 20 |
| Na4.965Ca2.39In0.68Si6O18(MS-2) | 230 | N/A | This work |
Here we report a novel zeolite-like indium silicate MS-2, which has the structure of the mineral imandrite. It is the first structurally confirmed indium silicate obtained under mild hydrothermal conditions, revealing a new chemistry among indium silicates.
Experimental
Synthesis of MS-2
MS-2 was synthesized using the following molar composition: 7.57Na2O![[thin space (1/6-em)]](https://www.rsc.org/images/entities/char_2009.gif) :
:![[thin space (1/6-em)]](https://www.rsc.org/images/entities/char_2009.gif) 0.074CaO
0.074CaO![[thin space (1/6-em)]](https://www.rsc.org/images/entities/char_2009.gif) :
:![[thin space (1/6-em)]](https://www.rsc.org/images/entities/char_2009.gif) 0.017In2O3
0.017In2O3![[thin space (1/6-em)]](https://www.rsc.org/images/entities/char_2009.gif) :
:![[thin space (1/6-em)]](https://www.rsc.org/images/entities/char_2009.gif) 4.4SiO2
4.4SiO2![[thin space (1/6-em)]](https://www.rsc.org/images/entities/char_2009.gif) :
:![[thin space (1/6-em)]](https://www.rsc.org/images/entities/char_2009.gif) 100H2O. First, 8.9 g of Ludox (AS-40 colloidal silica, 40 wt% suspension in H2O; Sigma-Aldrich) was dissolved in 8.16 g of NaOH (≥98%, Sigma-Aldrich) and 14.3 g H2O. Second, 0.1 g of InCl3 (minimum assay 98.0%; Sigma-Aldrich) dissolved in 2.2 g of H2O was added to the above solution. Finally, 0.11 g CaCl2 (≥93%; Sigma-Aldrich) dissolved in 2.4 g H2O was slowly poured into the above mixture under continuous homogenization. The obtained highly alkaline gel with a pH of 14 (indicator sticks, Fisher brand) was homogenized for 30 min, transferred to a Teflon-lined stainless steel autoclave, and heated at 230 °C for 163 h. The synthesis product was filtered several times through distilled water and dried at 50 °C, yielding about 0.2 g of white powder.
100H2O. First, 8.9 g of Ludox (AS-40 colloidal silica, 40 wt% suspension in H2O; Sigma-Aldrich) was dissolved in 8.16 g of NaOH (≥98%, Sigma-Aldrich) and 14.3 g H2O. Second, 0.1 g of InCl3 (minimum assay 98.0%; Sigma-Aldrich) dissolved in 2.2 g of H2O was added to the above solution. Finally, 0.11 g CaCl2 (≥93%; Sigma-Aldrich) dissolved in 2.4 g H2O was slowly poured into the above mixture under continuous homogenization. The obtained highly alkaline gel with a pH of 14 (indicator sticks, Fisher brand) was homogenized for 30 min, transferred to a Teflon-lined stainless steel autoclave, and heated at 230 °C for 163 h. The synthesis product was filtered several times through distilled water and dried at 50 °C, yielding about 0.2 g of white powder.
Scanning electron microscopy (SEM) and quantitative X-ray microanalysis with energy dispersive spectrometer (EDS) analyses
SEM and EDS were performed by using NanoSEM – FEI Nova 200 (FEG/SEM), and ZEISS SEM EVO 25LS with an EDAX Trident EDS-EBSD-WDS analysis system (Institute of Mineralogy and Crystallography, BAS). EDS analysis was made at selected points (spot analyses) using an EDAX SDD Apollo 10 EDS detector and Genesis V. 6.2. software with ZAF correction method and tugtupite (for Na, Si), diopside (for Ca), metal indium (for In) as standards (Astimex Microanalysis Standards). The EDS spectra of the standards and the studied samples were recorded at an acceleration voltage of 18 kV and a probe current of 0.98–1.0 nA using a data collection time of 100–120 live seconds and the following geometry: specimen tilt angle – 0°, working distance – 11.5 mm and X-ray take-off angle – 37.28°. A correction for electron beam current drift was made for each spectrum using a Faraday cap and measuring the sample current. For SEM/EDS study, the particles of the studied material were fixed in epoxy resin pellet and then polished. Another part of the particles was directly fixed on SEM holders. Then all prepared samples were coated with carbon (Fig. S1, S2, Tables S1 and S2†).Single-crystal XRD
Prismatic, colorless crystals from the studied compound were analyzed by Bruker D8 Venture diffractometer. The data collection and data reduction were performed by CrysAlisPro.23 The crystal structure was solved ab initio with SHELXT24 and refined by the full-matrix least-squares method of F2 with ShelxL25 programs. The data collection and structure refinement parameters for the studied sample are presented in Table S3† Information about the structural data is available in the Cambridge Structural Database: CSD 2079177.†Powder XRD
The lattice behavior under temperature treatment (room temperature, 50 to 450 °C, heating 10 °C min−1, hold 10 min every 50 °C), was studied by X-ray powder diffractometer XRD, Empyrean, Panalytical equipped with Anton Paar's TTK 600 cooling chamber (8–70 2θ range, step 0.013°, 10 s per step, CuKα radiation). The refinement of the lattice parameters was performed by the Le Bail method using TOPAS-3 software (Bruker AXS). The MS-2 product was further analyzed based on the powder XRD pattern by a Rietveld refinement with the GSAS II open-source program.26 For the initial refinement, the starting model of MS-2 single crystal structure was used (starting parameters as in Table S3†). Then the background parameters were adjusted (background function: “Chebyshev−1” with 20 terms). In subsequent cycles the following parameters were refined: lattice parameters, sample displacement, atomic coordinates (only general positions), atom occupancies and displacement parameters. The figures of merit were: reduced χ2 = 1.742, wR = 0.1531 (on 7235 reflections), R(F) = 0.0569, R(F2) = 0.1091 (on 460 reflections). The March–Dollase ratio along the [001] direction is 0.912 (e.g. plate-like).TG-DTA
Differential thermal analysis (DTA) and thermogravimetry (TG) were carried out on SetSys Evolution 2500(SETARAM). Al2O3 crucibles were used, and a heating rate of 10 °C min−1 at static air was applied. The evolved gases were simultaneously analyzed via mass spectrometry using an OmniStar apparatus. The intensities related to the m/z (mass-to-charge ratio) value of H2O(18) were examined. Two experiments were performed: (i) on the initial sample from room temperature to 1200 °C; (ii) on the sample preliminary heated at 500 °C and kept for 2 days on room temperature and humidity. The thus modified sample was analyzed again by DTA-TG from room temperature to 500 °C in order to check the water reversibility.FT-IR
FT-IR spectra were collected using Tensor 37 spectrometer (Bruker) with 4 cm−1 spectral resolution after averaging over 264 scans on standard KBr pellets in the spectral region 400–4000 cm−1 at room temperature.Raman
Raman spectra were collected using LabRAM HR (Horiba) spectrometer coupled with an Olympus BX40 optical microscope. The 632.8 nm line of He–Ne laser was used for sample excitation. The 50× objective was used to focus the incident beam on the sample surface and to collect the scattered light in backscattering geometry. Origin 9 software package was used for spectral evaluation.BET analysis
The BET, surface area properties of In- and Fe-imandrite samples were assessed by, N2 adsorption/desorption at −196 °C and CO2 adsorption at 5 °C and 20 °C using a Quantachrome Autosorb-iQ-AG instrument. The low pressure (up to 760 mbar) H2 adsorption on MS-2 has been conducted on 3Dflex Micromeritics at −196 °C and 4 °C (Fig. S10†).Results and discussion
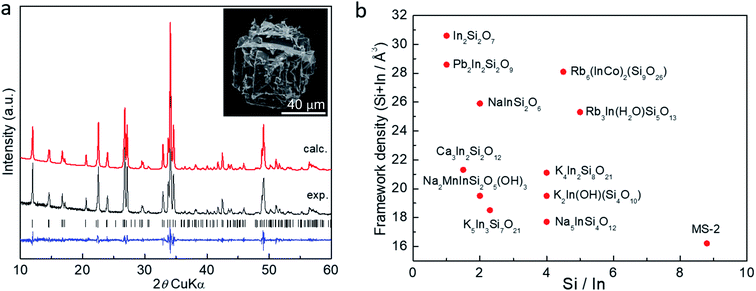
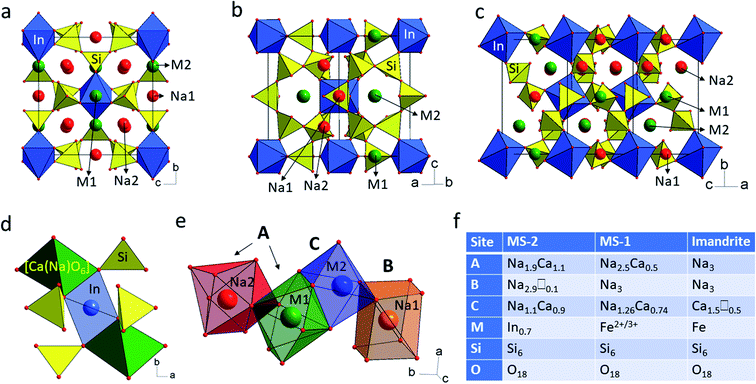
SEM images show that MS-2 crystallizes as cube-shaped aggregates, composed of twinned crystals with size between 5–70 μm (Fig. 1 and S1†). The polished samples reveal zonal growth of the crystals with lighter and darker areas, which according to chemical analysis differ in the Si/In ratio (Table S2 and Fig. S1†). The very small size of the single crystals in combination with the twinning, made it challenging to find crystals suitable for a structural study. More than ten crystals were checked to find an untwinned sample. The single crystal analyses showed that the studied compound crystallizes in orthorhombic space group Pnnm and has unit cell parameters comparable to those of previously reported MS-1 and the mineral imandrite (Table S4†). The unit cell volume (824.3 Å3) of MS-2 is 2.6% larger than the one (802.6 Å3) of MS-1, which is close to the difference of 2.5% between the ionic radii of six coordinated In3+ (0.8 Å) and Fe2+ (0.78 Å) ions.27 MS-2 exhibits an imandrite structural topology composed of six-membered rings of SiO4 tetrahedra and isolated InO6 octahedra connected to form a negatively charged [InSi6O18]9− framework. The charge balance is provided by Na+ and Ca2+ cations, located in tetrahedral–octahedral 6-ring channels extending along the [100] and [110] axes (Fig. 2a and b), and in 6-ring-like cavities formed by spirally arranged polyhedral units along the [101] axis (Fig. 2c). The average Si–O bond distance in MS-2 is shorter, and the coordination polyhedra around Na+ and Ca2+ are more regular than those in MS-1 (Table S5†). There are two sodium and two mixed sodium–calcium positions, which are symmetrically nonequivalent and distributed among the A (8-coordinated hexagonal bipyramid), B (8-coordinated distorted cubelike), and C (6-coordinated distorted octahedra) sites which is a distinctive feature for the structures belonging to the lovozerite mineral group.6 Unlike all other members of the lovozerite mineral group, the octahedral M site (In3+) occupation varies in a wide range (68% for the studied sample), which opens up additional space between the silicate rings. This type of disorder has not been previously observed in MS-1 (ref. 4) or the mineral imandrite.5 The vacancy created around the [SiO4] vertices is compensated by [Ca(Na)O6] octahedron (Ca2(Na21) position), which occupies the C site and shares common oxygen ions with the surrounding silicate units (Fig. 2d and e). The A site is shared between fully occupied (Na2) and (Ca1(Na11)) positions. The B site (Na1 position) is almost completely (97%) occupied by Na ions. A comparison between MS-1, MS-2, and the mineral imandrite shows the affinity of the synthetic phases to a mixed cation occupancy in A site (8-coordinated hexagonal bipyramid coordination). In all three phases, the cubelike coordinated B site is occupied only by Na+. However, in MS-1 and its natural analogue, the B site is fully occupied, whereas in MS-2 the same position (B site) is slightly underpopulated. A similar tendency is observed in the C site occupancy. In MS-1, the octahedral C site is fully occupied by 37% calcium and 63% sodium atoms. Similarly, the C site of MS-2 contains 44% calcium and 52% sodium atoms. Using this classification approach, we noticed that the admitted atoms per formula unit for sites A (6 apfu), B (3 apfu) and C (2 apfu) do not describe the complete crystal-chemical formula of MS-2 (Na6.23Ca1.62In0.68Si6O18) (Fig. 2f) for the measured crystal. We attribute this deviation to the vacancies of octahedral M site (In3+), which create an excess of negative charge compensated by more Ca2+ when compared to MS-1 and imandrite. Chemical analysis of different crystals revealed Si/In ratios ranging from 6.05 to 10.38, suggesting In deficiency as the expected Si/In ratio in the imandrite structure topology is 6.The powder XRD analyses confirm the purity of the as synthesized sample (Fig. 1a). A Rietveld refinement was performed to verify the correspondence between the crystal structure of the single crystal and that of the bulk (Fig. S3†). The obtained data reveal an excellent agreement with the single crystal structure and chemical composition very similar to that obtained by SEM/EDS analyses, e.g., Na6.27Ca1.58In0.68Si12O36. These results disclose that the indium deficiency is pertinent at the bulk level for MS-2.
A comparison with other porous and dense structure indium silicates (Fig. 1b) show that MS-2 possesses the lowest framework density (16.2 FC/1000 Å3; FC – number of the framework cations), the highest Si/In ratio (8.8), and it is the only Ca–Na member of the studied group. It is also interesting to note that among the minerals of the lovozerite group6 and their synthetic counterparts,28,29 there are no indium-based structures. In this respect, MS-2 represents unique structural and chemical characteristics.
The thermal analyses reveal that the total mass loss between 40 and 800 °C is about 2.2% (Fig. 3a). The mass loss occurs in two steps: between 40 and 186 °C (0.4%) and between 186 and 800 °C (1.8%) ascribed to the combination of evolving physisorption, the release of water molecules, as it is confirmed by the MS curve. These water molecules could not be structural or zeolitic water or OH groups, since the second dehydration cycle does not demonstrate their presence (Fig. 3b). The deep endothermic peak with onset temperature at 1079 °C indicates the sample melting. The dehydration followed by in situ PXRD (Fig. S4–S6†) showed that immediately after heating the sample at 50 °C starts a steady tendency towards lattice expansion which reaches about 1.1% at 450 °C (Fig. 4). Powder XRD pattern after heating MS-2 at 900 °C showed that the structure preserves its integrity (Fig. S7†), which is consistent with the DTA results. The thermal stability of MS-2 is higher than that of MS-1 and similar to that of Zr-AM-2 (synthetic umbite).30
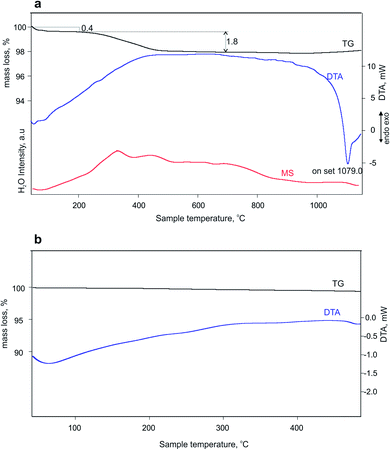 | ||
| Fig. 3 (a) Mass spectrum and TG-DTA curves of the first dehydration cycle and (b) TG-DTA curves of the second dehydration cycle of MS-2. | ||
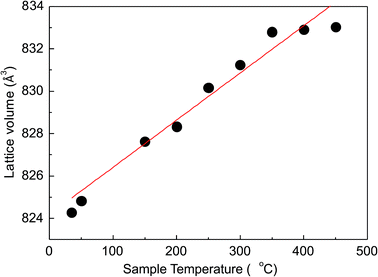 | ||
| Fig. 4 Changes of the lattice volume of MS-2 at selected temperatures (red line – approximation of the linear relationship between unit-cell volume and temperature). | ||
The infrared spectrum of MS-2 reveals the presence of water molecules in the initial sample which is evident from the broad weak bands centered at 3447 cm−1 in the range of O–H stretching and near 1600 cm−1 in the range of H–O–H bending vibrations. The presence of hydroxyl-based structural defects similar to inosilicates and nesosilicates like omphacite and kyanite31 is not excluded but cannot be confirmed by the spectra since there are no sharp peaks in the O–H stretching region typical of hydroxyl groups. Only very weak absorption peaks at 1360 and 2926 cm−1 are observed. Such peaks for the minerals of the lovozerite group have been previously explained with various dissociative states of Si–OH groups by Pekov et al.32
In the spectrum of MS-2, the intense peaks at 1053, 1029, 940, 614, 542, 521, and 450 cm−1 are similar to that observed in MS-1 (Fig. 5a). There is no complete analysis and calculation of normal vibrational modes and their frequencies for imandrite, so the spectra are interpreted based on comparison with other silicates with six-membered rings.31–33 According to Mihailova et al.,33 Sitarz et al.,34 and Handke et al.35 the peaks at 1053, 1029, and 940 cm−1 could be attributed to bridging Si–O–(Si) and non-bridging Si–O stretching bonds. The peak at 614 cm−1 is characteristic of six-membered rings. Bending vibrations should be at 540, 520, and 450 cm−1.
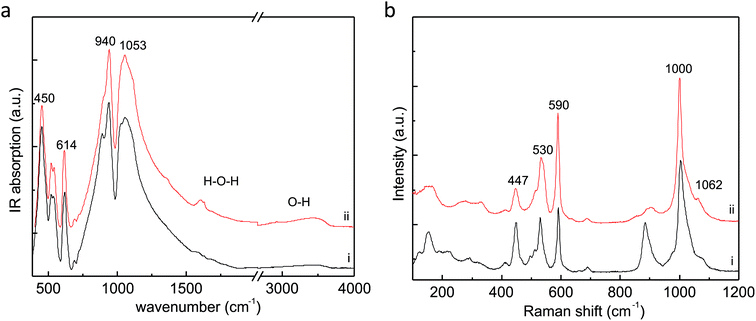 | ||
| Fig. 5 (a) Infrared spectrum of MS-2 (ii) compared to MS-1 (i) (b) comparison between the Raman spectra of (i) MS-1 and (ii) MS-2. | ||
Non-polarized Raman spectrum of MS-2 (Fig. 5b) reveals the most intensive peak is located at 1000 cm−1, and should be due to symmetric stretching of Si–O bonds, according to Mihailova et al.33 and Handke et al.35 The peak near 885 cm−1 is very weak as compared to MS-2. Other peaks at 590, 530, and 447 cm−1 are similar to MS-1. The peak at 590 cm−1 is associated with ring units, while low-frequency peaks to Si–O–Si and O–Si–O bending vibrations.32,34
The surface area and porosity of the Fe- and In-imandrite samples were investigated using Brunauer–Emmett–Teller (BET) analysis36 (Fig. S8 and S9†). The calculated BET surface areas of the Fe- and In-imandrite samples are 9.96 and 3.4 m2 g−1, respectively, and as shown in the BET surface plots, both samples exhibit a typical type (I) N2 isotherm pattern, which indicates that the pores are inaccessible for the nitrogen molecule.36 The CO2 adsorption isotherms (at 278 and 293 K) also reveal the lack of interaction of CO2 molecules with cations in In- and Fe-imandrite structures. A low pressure H2 adsorption experiment of MS-2 has been conducted and the isotherms are shown on Fig. S10.† When compared to activated carbon the H2 adsorption of MS-2 is basically insignificant and for ambient temperature nonexistent. These results are not surprising considering the 6-membered ring pores of MS-1 and MS-2.
Conclusions
Novel zeolite-like indium silicate (MS-2) is synthesized at mild hydrothermal conditions by using the combined effect of monovalent and divalent structure-directing cations. The crystal structure shows the lowest framework density among the indium silicates and an atypical disorder over the structure-forming indium cation. Furthermore, the solid is the only indium silicate analogue of the mineral imandrite and the only indium-based structure related to the lovozerite mineral group. Finally, the second member of the material family MS is evidence of a successful strategy for the synthesis of novel zeolite-like silicates.Conflicts of interest
There are no conflicts to declare.Acknowledgements
S. F. thanks SEMAT at the University of Minho and acknowledge the funding from FCT/PIDDAC through the Strategic Funds project reference UIDB/04650/2020-2023. This work is supported by the European Regional Development Fund within OP “Science and Education for Smart Growth 2014–2020”, Project CoE “National Center of Mechatronics and Clean Technologies”, BG05M2OP001-1.001-0008.Notes and references
- J. Rocha and M. W. Anderson, Eur. J. Inorg. Chem., 2000, 801–818 CrossRef CAS.
- J. Rocha and Z. Lin, Rev. Mineral. Geochem., 2005, 57, 173–201 CrossRef CAS.
- S. Ferdov, U. Kolitsch, O. Petrov, V. Kostov-Kytin, C. Lengauer and E. Tillmanns, Microporous Mesoporous Mater., 2005, 81, 79–86 CrossRef CAS.
- S. Ferdov, A. M. L. Lopes, J. P. Araujo, B. Shivachev, R. Titorenkova, N. Petrova and R. Nikolova, Inorg. Chem., 2021, 60, 4563–4568 CrossRef CAS PubMed.
- N. M. Chernitsova, Z. V. Pudovkina, A. A. Voronkov, V. V. Ilyukhin and P. Y. A., Dokl. Akad. Nauk SSSR, 1980, 252, 618–621 CAS.
- I. V. Pekov, S. V. Krivovichev, A. A. Zolotarev, V. N. Yakovenchuk, T. Armbruster and Y. A. Pakhomovsky, Eur. J. Mineral., 2009, 21, 1061–1071 CrossRef CAS.
- R. L. Bedard, L. M. King, D. S. Bem, J. L. Gisselguist and S. C. Koster, US Pat., 6007790, 1999 Search PubMed.
- B. V. Mill, Dokl. Akad. Nauk SSSR, 1964, 156, 814–816 CAS.
- J. Ito, Am. Mineral., 1968, 53, 1663 CAS.
- G. J. Redhammer and G. Roth, Acta Crystallogr., Sect. C: Cryst. Struct. Commun., 2003, 59, I38–I40 CrossRef CAS PubMed.
- D. Y. Pushcharovskii, P. Ea, B. N. Litvin and N. V. Belov, Dokl. Akad. Nauk SSSR, 1974, 214, 91–94 CAS.
- G. R. Patzke, R. Wartchow and M. Binnewies, Z. Kristallogr. - New Cryst. Struct., 2000, 215, 15–16 CAS.
- J. P. Werner and H. MullerBuschbaum, Z. Naturforsch., B: Chem. Sci., 1997, 52, 1213–1218 CrossRef CAS.
- L.-I. Hung, S.-L. Wang, Y.-H. Chen and K.-H. Lii, Inorg. Chem., 2006, 45, 2100–2103 CrossRef CAS PubMed.
- L.-I. Hung, S.-L. Wang, C.-Y. Chen, B.-C. Chang and K.-H. Lii, Inorg. Chem., 2005, 44, 2992–2994 CrossRef CAS PubMed.
- L.-I. Hung, S.-L. Wang, S.-P. Szu, C.-Y. Hsieh, H.-M. Kao and K.-H. Lii, Chem. Mater., 2004, 16, 1660–1666 CrossRef CAS.
- F. C. Hawthorne and H. D. Grundy, Acta Crystallogr., Sect. B: Struct. Crystallogr. Cryst. Chem., 1974, 30, 1882–1884 CrossRef.
- G. Redhammer and G. Roth, Z. Kristallogr. - New Cryst. Struct., 2004, 219, 278–294 CrossRef CAS.
- L.-I. Hung, S.-L. Wang, H.-M. Kao and K.-H. Lii, Inorg. Chem., 2003, 42, 4057–4061 CrossRef CAS PubMed.
- L. I. Hung, S. L. Wang, H. M. Kao and K. H. Li, Inorg. Chem., 2007, 46, 3301–3305 CrossRef CAS PubMed.
- A. F. Reid, C. Li and A. E. Ringwood, J. Solid State Chem., 1977, 20, 219–226 CrossRef CAS.
- Y. Messous, B. Chambon, M. Dejesus, D. Drain, C. Pastor, A. Garcia, J. P. Chaminade, T. Gaewdang, C. Fouassier, B. Jacquier and B. Varrel, Nucl. Instrum. Methods Phys. Res., Sect. A, 1995, 354, 527–529 CrossRef CAS.
- Rigaku Oxford Diffraction, CrysAlis pro, 2015.
- G. Sheldrick, Program for crystal-structure refinement, University of Göttingen, Göttingen, 1997.
- G. M. Sheldrick, Acta Crystallogr., Sect. A: Found. Crystallogr., 2015, 71, 3–8 CrossRef PubMed.
- B. H. Toby and R. B. Von Dreele, J. Appl. Crystallogr., 2013, 46, 544–549 CrossRef CAS.
- R. D. Shannon, Acta Crystallogr., Sect. A: Found. Crystallogr., 1976, .32, 751–767 CrossRef.
- L. P. S. Otroshchenko, V. I. Simonov and N. V. Belov, Dokl. Akad. Nauk SSSR, 1973, 208, 845–848 CAS.
- M. A. Simonov, Y. K. Egorov-Tismenko and N. V. Belov, Dokl. Akad. Nauk SSSR, 1967, 175, 80–83 CAS.
- P. Ferreira, A. Ferreira, J. Rocha and M. R. Soares, Chem. Mater., 2001, 13, 355–363 CrossRef CAS.
- A. Beran, K. Langer and M. Andrut, Mineral. Petrol., 1993, 48, 257–268 CrossRef CAS.
- I. Pekov, N. Chukanov, N. Yamnova, Y. Egorov-Tismenko and A. Zadov, Proc. Russ. Mineral. Soc., 2003, 132, 1–14 CAS.
- B. Mihailova, N. Zotov, M. Marinov, J. Nikolov and L. Konstantinov, J. Non-Cryst. Solids, 1994, 168, 265–274 CrossRef CAS.
- M. Sitarz, W. Mozgawa and M. Handke, J. Mol. Struct., 1997, 404, 193–197 CrossRef CAS.
- M. Handke, M. Sitarz and W. Mozgawa, J. Mol. Struct., 1998, 450, 229–238 CrossRef CAS.
- K. A. Cychosz and M. Thommes, Engineering, 2018, 4, 559–566 CrossRef CAS.
Footnote |
| † Electronic supplementary information (ESI) available: In situ temperature-resolved powder XRD patterns and related Le Bail fits, refined unit cell parameters, crystal data, structure refinement, bond distances, BET surface plots, and SEM/EPMA studies. CCDC 2079177 and 2151073. For ESI and crystallographic data in CIF or other electronic format see https://doi.org/10.1039/d2ra00864e |
| This journal is © The Royal Society of Chemistry 2022 |

