 Open Access Article
NiCoP–CeO2 composites for efficient electrochemical oxygen evolution†
Jiyu Li,
Zeyan Wang *,
Peng Wang
 ,
Zhaoke Zheng
 ,
Yuanyuan Liu
 ,
Hefeng Cheng and
Baibiao Huang
 *
*
State Key Laboratory of Crystal Materials, Shandong University, Jinan 250100, China. E-mail: wangzeyan@sdu.edu.cn; bbhuang@sdu.edu.cn
First published on 5th May 2022
Abstract
In this study, a novel NiCoP–CeO2 composite was constructed on a Ni foam by a simple hydrothermal method and thermal phosphating strategy. In the OER test, NiCoP–CeO2 exhibited a low overpotential of 217 mV at 10 mA cm−2, 45 mV dec−1 of Tafel slopes. With the help of theoretical calculations and experimental characterization, the reason for performance improvement was analyzed in depth. The results show that CeO2 leads to a confinement effect, maintaining the nanosheet morphology of NiCo-LDHs, which contributes to sustaining the catalyst in favourable contact with H2O and minimizing the OER potential. Furthermore, by loading CeO2 onto NiCoP, the hydrophilicity of the catalyst is significantly enhanced. Our work provides an ingenious synthesis strategy for the preparation of efficient and inexpensive electrocatalytic materials.
1. Introduction
Hydrogen is one of the most promising alternatives to traditional fossil fuels because it is considered a green fuel with very high energy density.1 Among the strategies for hydrogen production, electrochemical water splitting is regarded as one of the most promising methods due to its availability and operability.2 However, the slow kinetics of anodic oxygen evolution (OER) reactions seriously affect the splitting efficiency of water.3 So far, noble metal oxides, such as ruthenium (Ru) and iridium (Ir) based oxides, are widely used as the reference catalysts for OER processes. However, due to the scarcity of natural resources and high cost, its large-scale application is seriously hindered.4Recently, the exploration of noble-metal free OER catalysts, such as LDHs, has attracted increasing interest.5–9 Among these, earth-abundant 3d transition metal layered double hydroxides (LDHs) in OER have been studied a lot in recent years owing to their excellent catalytic performances and low prices.10 NiCo-LDHs have attracted considerable attention owing to their abundant active sites and rapid anion exchange, which exhibit excellent OER reactivity close to the noble metal catalysts. Nevertheless, the poor conductivity of LDHs has greatly restricted their OER performance. Hence, to improve the conductivity of LDHs, some methods have been recently developed in recent years, such as sulfuration, phosphating, and selenizing. Among them, transition metal phosphides (TMPs) obtained by phosphating have been widely studied. NiCoP is converted from NiCo-LDHs by phosphating, which can significantly improve the electrical conductivity. Besides, transition metal phosphates exhibit superior catalytic activity due to their catalytic mechanism being similar to the hydrogenase.10,11 However, although its conductivity and catalytic activity are improved, the morphology and chemical properties of the catalyst are easily damaged in the phosphating process and hydrophilicity of the catalyst is severely weakened.12 Moreover, catalysts are mostly oxidized in the OER process because of the high catalytic activity of NiCoP, and it results in poor stability during the long-term OER process.
Compared to phosphates, oxides tend to perform better in stability and hydrophilicity. Consequently, combining oxides with NiCoP may yield a composite with excellent catalytic activity, NiCoP's conductivity and stability, and oxides' hydrophilicity, which has proven to be an effective method in the fields of catalysis.13–17 CeO2, as a widely used oxide, exhibits some attractive attributes, such as great stability, hydrophilicity, high oxygen storage capacities, reversible surface oxygen ion exchange and good electronic/ionic conductivity.18 Moreover, CeO2 contains the oxidation states of Ce3+ and Ce4+, which results in the presence of oxygen vacancies to maintain the charge neutrality. Oxygen vacancy on the surface of CeO2 can not only serve as an oxygen buffer for efficient oxygen supply but also enhance its hydrophilicity, which is important for electrocatalytic OER.19 Owing to the above-mentioned properties of CeO2, if we load CeO2 on the surface of NiCoP to construct a NiCoP–CeO2 composite, it is expected to maintain the original properties of both CeO2 and NiCoP, which could further improve the OER performances and stability of NiCoP.
In this study, we report a novel NiCoP–CeO2 composite electrocatalyst synthesized by a simple hydrothermal method and thermal phosphating strategy. The presence of CeO2 in the composites can not only perfectly preserve the nanosheet morphology but can also improve the hydrophilicity of the material in a synergistic way. Furthermore, theoretical calculations show that the H2O adsorption energies of NiCoP can be greatly lowered with the assistance of CeO2. The optimized NiCoP–CeO2 catalyst exhibits an overpotential of 217 mV at 10 mA cm−2 and Tafel slope of 45 mV dec−1. Surprisingly, the stability of the NiCoP–CeO2 composites was also greatly improved, and no obvious decline on current density was observed after 10 h in the alkaline electrolyte solution (KOH, pH = 13.8). Moreover, after the stability test, the XPS results changed slightly compared to before. The structure characterization and electrochemical test results show that the introduction of CeO2 to the catalyst provides a feasible strategy to improve the OER performance of TMP electrocatalysts.
2. Experimental section
2.1 Materials
Ni foam (99.9%, HF-Kejing), nickel nitrate hexahydrate (Ni(NO3)2·6H2O, 99%, Sinopharm Chemical Reagent Co. Ltd), cobalt nitrate hexahydrate (Co(NO3)2·6H2O, 99%, Sinopharm Chemical Reagent Co. Ltd), cerium nitrate hexahydrate (Ce(NO3)3·6H2O, 99%, Sinopharm Chemical Reagent Co. Ltd), urea (CH4N2O, 99%, Sinopharm Chemical Reagent Co. Ltd), sodium hypophosphite monohydrate (NaH2PO2·H2O, 99%, Aladdin), cetyltrimethylammonium bromide (C19H42BrN, 99%, Aladdin), methanol (CH3OH, 99%, Sinopharm Chemical Reagent Co. Ltd) and ultrapure water (18.2 MΩ cm) were used without any further treatment.2.2 Synthesis of the NiCo-LDHs
A Ni foam was washed ultrasonically in 1 M hydrochloric acid, acetone and ethanol for 30 min respectively to remove the surface oxide layer and organic species. Then, 0.63 mmol nickel nitrate hexahydrate (Ni(NO3)2·6H2O), 0.07 mmol cobalt nitrate hexahydrate (Co(NO3)2·6H2O) and 0.25 g CTAB (C19H42BrN) were added in a mixed solution of 3 ml ultrapure water and 15 ml methanol (CH3OH) under stirring to form a clear solution with vigorous stirring for about 20 min. After stirring, the solution was poured in a Teflon autoclave and a piece of Ni foam was immersed in it. Then, the Teflon autoclave was heated in an oven at 180 °C for 12 h. After cooling down to 25 °C, the Ni foam was washed by deionized water and ethanol four times. After drying, this obtained sample was named NiCo-LDHs.2.3 Synthesis of the NiCoP–CeO2 precursors
0.6 mmol cerium nitrate hexahydrate (Ce(NO3)2·6H2O) and 1 mmol urea were added in a 15 ml distilled water under stirring to form a clear solution with vigorous stirring for about 20 min. After stirring, the solution was poured in a Teflon autoclave and a piece of the NiCo-LDH electrode was immersed in it. Then, the Teflon autoclave was heated in an oven at 180 °C for 12 h. After cooling down to 25 °C, the Ni foam was washed by deionized water and ethanol four times. After drying, this obtained sample was named NiCoP–CeO2 precursors. It should be noted that different precursors can be synthesized with different molarities of cerium nitrate hexahydrate.2.4 Synthesis of the NiCoP–CeO2
0.5 g of hypophosphite monohydrate (NaH2PO2·H2O) and a piece of NiCoP–CeO2 precursor were put in a porcelain boat with NaH2PO2·H2O placed in the upper tuyere. They were heated at 300 °C for 2 h under Ar atmosphere in a tube furnace. After the reaction, the sample was taken and named NiCoP–CeO2.2.5 Characterizations
An X-ray diffractometer (XRD, Bruker AXS D8 diffractometer) was used for obtaining the structural information of the samples. For ascertaining the valence state and chemical composition, the samples were studied using X-ray photoelectron spectroscopy (XPS, Thermo Fisher Scientific Escalab 250 spectrometer). The microstructures of the samples were further detected by scanning electron microscopy (SEM, Hitachi S-4800) and high-resolution transmission electron microscopy (TEM, Talos F200X). The weight change of the wet samples was obtained by thermogravimetric analysis (TG, Mettler-Toledo TGA/DSC/1600HT). To determine the chemical desorption temperature, the sample was studied by temperature programmed desorption (TPD, Micromeritics AutoChem II 2920).2.6 Computational methods
All calculations were based on the density functional theory (DFT) and performed with the Vienna Ab initio Simulation Package (VASP) code.20,21 The exchange and correlation energy functional was expressed in the GGA-PBE.22 The projector-augmented wave method23,24 was used to describe the interactions between ions and electrons. The valence electrons were solved in the plane-wave basis with a cut-off energy of 400 eV. The convergence criteria for the energy calculation and structure optimization were set to 1.0 × 10⁻⁵ eV and a force tolerance of 0.05 eV Å−1, respectively. The Brillouin-zone integration was performed using a 1 × 1 × 1 Γ-centered k-point mesh with a Gaussian smearing set to 0.05 eV. To accurately describe the localization of Ce 4f electrons, we conducted the DFT + U calculations with a value of Ueff = 5 eV. The adsorption energy was defined by| Eads = E(adsorbate/surface) − E(adsorbate) − E(surface) |
2.7 Electrochemical measurements
The OER performance of the material was measured in an alkaline environment using a standard three-electrode system. A Hg/HgO electrode was used as the reference electrode, a graphite rod electrode was used as the counter electrode, and a phosphide electrode was used as the working electrode. All the experiments were carried out in a 1.0 M KOH (pH = 13.8) solution using the CHI660E electrochemical workstation. The surface area, overpotential, stability and resistance of the electrode were measured by cyclic voltammetry (CV), linear sweep voltammetry (LSV), chronoamperometry curve (i–t) and electrochemical impedance spectroscopy (EIS). In particular, CV was performed at a scan rate of 100 mV s−1 for different cycles, until steady CV curves were obtained in 1 M KOH solution: the scanning rate of LSV test was 2 mV s−1; the percentage of iR correction is 90%; the stability test time was 10 hours; the EIS test amplitude was 5 mV, the frequency range was between 10−2 and 105 Hz, and the applied potential was 1.58 V (vs. RHE). The conversion formula was ΔE(RHE) = E + 0.059 × pH + 0.098.3. Results and discussion
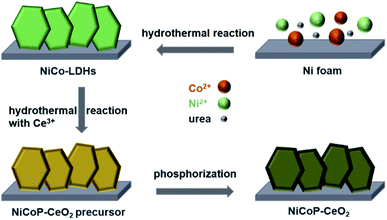
The NiCoP–CeO2 working electrode was prepared following the procedure, as illustrated in Fig. 1. First, NiCo-LDHs were prepared by the hydrothermal method. Then, the Ni foam coated with NiCo-LDHs reacted again to load the Ce compound, which may be cerium oxide carbonate hydrate (Fig. S1†). Finally, the NiCoP–CeO2 precursor was placed in a tube furnace and heated at 573 K under Ar atmosphere for 2 h. The final product was NiCoP–CeO2. Simultaneously, by adjusting the load of CeO2, the best ratio of NiCoP and CeO2 was obtained, which was named NiCoP–CeO2. Samples with amount of 0.72 and 0.48 mmol Ce(NO3)2·6H2O in the preparation process were named NiCoP–CeO2M and NiCoP–CeO2L (Fig. S2†), respectively. For comparison, NiCoP was synthesized by the same method without cerium sources. The crystal structure and composition of NiCoP–CeO2 were investigated by an X-ray diffractometer (XRD). As for NiCoP–CeO2, the characteristic peaks match well with different standard cards, including JCPDS no. 89-8436 (CeO2), JCPDS no. 71-2336 (NiCoP) and JCPDS no. 70-0989 (Ni foam), which indicated that CeO2 and NiCoP are successfully synthesized on the Ni foam (Fig. 2a). The peak of CeO2 and NiCoP is not obvious, which may be attributed to the strong peak of Ni foam.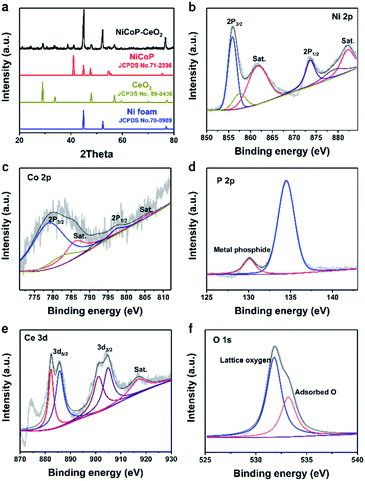 | ||
| Fig. 2 XRD patterns of NiCoP–CeO2 (a); Ni 2p (b), Co 2p (c), P 2p (d), Ce 3d (e), O 1s (f) XPS spectra of NiCoP–CeO2. | ||
To further investigate the chemical composition and valence of the samples, X-ray photoelectron spectroscopy (XPS) was used. The full spectrum of NiCoP–CeO2 (the sample with the best performance, Fig. S3†) demonstrates the presence of Ni, Co, P, Ce and O elements, and the peak positions of all the elements are corrected according to the normative C 1s peak (284.8 eV). As shown in Fig. 2b, Ni 2p spectra could be fitted into two doublet peaks at 874.1 eV and 856.2 eV with two satellites, respectively, which can be ascribed to Ni2+, Ni3+, Ni–POx and Ni–P, indicating the formation of nickel phosphide.25,26 The Co 2p (Fig. 2c) spectra of the NiCoP samples are divided into two spin–orbit doublets at 778.9 eV and 797.4 eV as well as two satellites at 787.1 eV and 805.1 eV, formed due to the presence of Co2+.27,28 The P 2p spectra (Fig. 2d) exhibits a peak at 134.2 eV, which can be assigned to the P in the phosphide. In addition, the peak at 130.1 eV tends to represent metal phosphide.29 The Ce 3d XPS spectrum (Fig. 2e) displays six main peaks at 882.1, 900.9 and 916.5 eV, which can be ascribed to the Ce4+ state. The peaks at 885.1 eV and at 905.2 eV can be attributed to the Ce3+ state, which illustrate the coexistence of Ce4+ and Ce3+ species on the surface of the NiCoP–CeO2 sample.30,31 Moreover, the XPS spectrum of O 1s in Fig. 2f displays two peaks at 531.9 eV and 533.4 eV, representing the lattice oxygen and adsorptive oxygen species, respectively.32 Besides, the presence of Ce3+ and adsorptive oxygen species indicates abundant oxygen vacancies in the sample, which plays a great role in enhancing the adsorption of H2O, increasing the electrical conductivity, reducing the activation energy of OER and consequently promoting the electrochemical catalysis performance.33
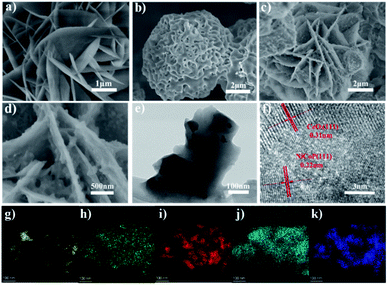
To further study the morphology and microstructure of samples, scanning electron microscopy (SEM) and transmission electron microscopy (TEM) were also carried out. As shown in Fig. S4† and 3c, NiCo-LDHs, NiCoP–CeO2 precursors and NiCoP–CeO2 all show nanosheet structure. NiCo-LDHs exhibit nanosheet morphology with a smooth surface (Fig. 3a). After loading with the Ce compound on NiCoP–CeO2 precursors, the nanosheets became thicker and some attachments appeared on the surface of the sample (Fig. S4b†). After being heated at a high temperature, the Ce compound loaded on the surface was transformed into CeO2 and was uniformly coated on the surface of the nanosheets (Fig. 3c). Moreover, NiCo-LDHs effectively phosphated and transformed into NiCoP (Fig. 3b and S5†). As for NiCoP–CeO2, different from the NiCoP sample, although the phosphating process occurs during the heat treatment of NiCo-LDHs, the generated CeO2 displays a confinement effect, which can inhibit the agglomeration of NiCoP and maintain the stability of the structure. Therefore, the obtained NiCoP–CeO2 still maintains the nanosheet structure of NiCoP–CeO2 on the micro level. As shown in the high magnification picture (Fig. 3d), the surface of the nanosheets is uneven and contains numerous particles, which indicates that NiCoP and CeO2 are effectively bound together. The high-resolution transmission electron microscopy image (HRTEM, Fig. 3f) shows that the (111) facet of NiCoP and the (111) facet of CeO2 appears in NiCoP–CeO2, proving the successful formation of the composite interface, which is conductive to the charge transfer between NiCoP and CeO2.34,35 Besides, the energy dispersive X-ray elemental mapping spectroscopy (EDX mapping) indicates that the Ni, Co, P, Ce, O elements are uniformly distributed on the NiCoP–CeO2 composite (Fig. 3g–k).
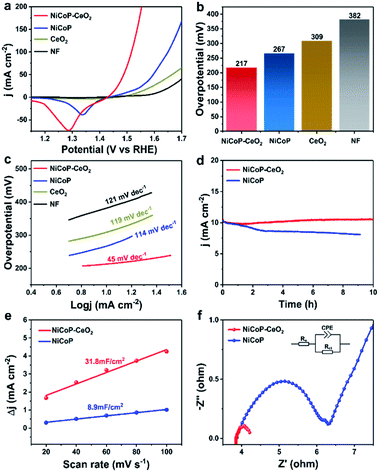
To further research the electrocatalytic OER performance of different materials, a series of electrochemical experiments were carried out in a three-electrode system with 1 M KOH solution. There are several linear sweep voltammetry (LSV) curves of all samples in Fig. 4a. The overpotential of Ni foam, CeO2, NiCoP, and NiCoP–CeO2 are 382, 309, 267 and 217 mV at 10 mA cm−2, respectively, as shown in Fig. 4b. It can be seen from the figure mentioned above that the overpotential of the material was significantly reduced by loading CeO2, which proves that the electrocatalytic performance of the material is significantly enhanced by the combination of CeO2. In order to explore the kinetics of OER, the Tafel slopes of different electrodes were calculated according to the formula: η = b × log|j| + a (Fig. 4c, including a: corresponding constant; b: Tafel slope; η: overpotential).36,37 The values of each electrode are as follows: Ni foam (121 mV dec−1), CeO2 (119 mV dec−1), NiCoP (114 mV dec−1) and NiCoP–CeO2 (45 mV dec−1). As expected, the NiCoP–CeO2 electrode exhibits a much lower Tafel slope compared to NiCoP or CeO2 electrode, indicating the strong interaction between NiCoP and CeO2. Besides, Table S1† shows the OER activity of other LDHs-CeO2 composite electrocatalysts. It can be seen that NiCoP–CeO2 exhibits excellent OER performance compared with other materials. In addition, the stability is also a very crucial parameter, as shown in Fig. 4d. After 10 h of the reaction, the performance of NiCoP–CeO2 visually remained unchanged compared with that of NiCoP. This may be due to the confinement effect of loading CeO2, which can help the material to maintain the sheet shape and good contact with H2O. To further investigate the stability of the material in depth, the NiCoP–CeO2 electrode after the stability test is also characterized (Fig. S6a–f†). The XPS results show that the peak of metal phosphide is slightly weakened (Fig. S6d†), which may be caused by anodic oxidation. However, the amount of Ce3+ and adsorbed oxygen is basically unchanged (Fig. S6e and f†). It indicates that the material still contains abundant oxygen vacancies, which proves that NiCoP–CeO2 exhibits good stability. Moreover, electrochemical surface area (ECSA) tests were also performed to measure the amount of the active sites on the materials. Since the value of electric double layer capacitance (EDLC) is proportional to ECSA, the value of EDLC is used to represent the ECSA.38 As shown in Fig. 4e, the ECSA of NiCoP–CeO2 (31.8 mF cm−2) is nearly triple–quintuple higher than that of pure NiCoP (8.9 mF cm−2), which manifests that the confinement effect caused by the introduction of CeO2 leads to maintaining the nanosheet morphology and therefore expose more active sites in the NiCoP–CeO2 composite. Fig. 4f shows the EIS Nyquist plots of different electrodes and the relevant equivalent circuit diagram simulated by the Z-view software, which contains solution resistance (Rs), charge transfer resistance (Rct) and constant phase element (CPE).39,40 As shown in the picture, the NiCoP–CeO2 electrode shows lower Rct compared to NiCoP. It confirms that the introduction of CeO2 greatly improves the charge transfer rate during the OER process.
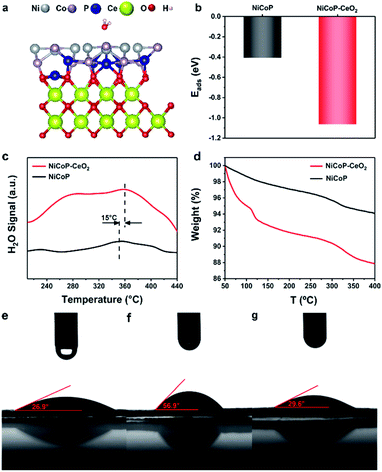
The adsorption structures and original structures on NiCoP–CeO2 and NiCoP are shown in Fig. 5a, S7 and S8,† respectively (Cartesian coordinates in Tables S2 and S3†). It can be seen that their corresponding H2O adsorption energies (Eads) are shown in Fig. 5b. It appears that NiCoP–CeO2 possesses much lower Eads (−1.06 eV) than that of NiCoP (−0.41 eV), which reveals that coupling CeO2 with NiCoP enhances the NiCoP's adsorption ability to H2O for. In the TPD spectra (Fig. 5c), NiCoP–CeO2 shows the larger H2O adsorption area and the higher desorption temperature, which is consistent with previous theoretical calculation results. Moreover, we carried out TGA tests on wet NiCoP and NiCoP–CeO2 (Fig. 5d), and the results are within our expectations that more weight is lost in NiCoP–CeO2 compared with NiCoP. It means that NiCoP–CeO2 tends to have stronger attraction to H2O. Subsequently, the difference in the results of the wetting-ability test shown in Fig. 5e–g indicates that phosphating NiCo-LDHs to NiCoP weakens the hydrophilicity of the catalyst. However, NiCoP–CeO2 has a better wetting-ability, even better than that of CeO2 (Fig. S9†), which indicates that CeO2 and NiCoP synergically enhanced the hydrophilicity of the material after composite and ultimately leads to the improvement of NiCoP–CeO2's electrocatalytic performance.
4. Conclusions
In conclusion, the NiCoP–CeO2 electrode was prepared on a Ni foam by a simple hydrothermal method and thermal phosphating strategy. Compared with pure NiCoP, NiCoP–CeO2 displays superior catalytic activity including higher ECSA values, lower overpotential, accelerated kinetic rate. The presence of CeO2 in the composites not only perfectly preserve the nanosheet morphology but can also improve their hydrophilicity in a synergistic way and stability of the catalyst on the basis of experimental results. Furthermore, theoretical calculations show that the H2O adsorption energies of NiCoP can be greatly lowered with the assistance of CeO2. This work provides an ingenious material design method and guidance for the preparation and design of efficient catalysts in the future.Author contributions
Conceptualization, J. L.; investigation, Z. W.; H. C. and Z. Z.; data curation, Z. W.; formal analysis, J. L.; Z. W. and P. W.; methodology, J. L.; project administration, Z. Z.; Y. L. and B. H.; resources, Y. L.; Z. W. and B. H.; supervision, B. H.; validation, P. W.; Y. L. and B. H.; writing—original draft, J. L.; writing—review & editing, Z. W. and H. C.Conflicts of interest
There are no conflicts to declare.Acknowledgements
This work is financially supported by the National Key R & D Program “Key Scientific Issues of Transformative Technology” (2020YFA0710301). National Natural Science Foundation of China (21972078, 51972195, 21573135, and 51602179), Natural Science Foundation of Shandong Province (ZR2019MEM004). Z. Y. W. acknowledges support from Shandong University Multidisciplinary Research and Innovation Team of Young Scholars (2020QNQT11), Qilu Young Scholar Program of Shandong University.References
- N. S. Lewis and D. G. Nocera, PNAS, 2006, 103, 15729–15735 CrossRef CAS PubMed.
- B. Xiong, L. Chen and J. Shi, ACS Catal., 2018, 8, 3688–3707 CrossRef CAS.
- Z. P. Wu, X. F. Lu, S. Q. Zang and X. W. Lou, Adv. Funct. Mater., 2020, 30, 1910274 CrossRef CAS.
- W. Li, J. Liu, P. Guo, H. Li, B. Fei, Y. Guo, H. Pan, D. Sun, F. Fang and R. Wu, Adv. Energy Mater., 2021, 11, 2102134 CrossRef CAS.
- T. V. Vineesh, M. P. Kumar, C. Takahashi, G. Kalita, S. Alwarappan, D. K. Pattanayak and T. N. Narayanan, Adv. Energy Mater., 2015, 5, 1500658 CrossRef.
- C. Li, L. Xie, J. Zhao, L. Gu, J. Wu and G. Li, Appl. Catal., B, 2022, 306, 121097 CrossRef CAS.
- B. Liu, M. Zhang, Y. Wang, Z. Chen and K. Yan, J. Alloys Compd., 2021, 852, 156949 CrossRef CAS.
- J. Joy, A. Sekar, S. Vijayaraghavan, T. P. Kumar, V. K. Pillai and S. Alwarappan, J. Electrochem. Soc., 2018, 165, H141–H146 CrossRef CAS.
- Q. Tu, W. Liu, M. Jiang, W. Wang, Q. Kang, P. Wang, W. Zhou and F. Zhou, ACS Appl. Energy Mater., 2021, 4(5), 4630–4637 CrossRef CAS.
- Y. Guo, T. Park, J. W. Yi, J. Henzie, J. Kim, Z. Wang, B. Jiang, Y. Bando, Y. Sugahara, J. Tang and Y. Yamauchi, Adv. Mater., 2019, 31, 1807134 CrossRef.
- H. Sun, Z. Yan, F. Liu, W. Xu, F. Cheng and J. Chen, Adv. Mater., 2020, 32, 1806326 CrossRef CAS PubMed.
- Y. Wang, B. Kong, D. Zhao, H. Wang and C. Selomulya, Nano Today, 2017, 15, 26–55 CrossRef CAS.
- P. Hao, M. Xie, S. Chen, M. Li, F. Bi, Y. Zhang, M. Lin, X. Guo, W. Ding and X. Guo, Sci. Adv., 2020, 6, eaay7031 CrossRef CAS.
- S. Zhang, S. E. Saji, Z. Yin, H. Zhang, Y. Du and C. H. Yan, Adv. Mater., 2021, 33, 2005988 CrossRef CAS PubMed.
- Y. Zhong, X. Xia, F. Shi, J. Zhan, J. Tu and H. Fan, Adv. Sci., 2016, 3, 1500286 CrossRef PubMed.
- K. Guo, Y. Wang, S. Yang, J. Huang, Z. Zou, H. Pan, P. S. Shinde, S. Pan, J. Huang and C. Xu, Sci. Bull., 2021, 66, 52–61 CrossRef CAS.
- H. Wang, K. H. L. Zhang, J. P. Hofmann, V. A. d. l. P. O'Shea and F. E. Oropeza, J. Mater. Chem. A, 2021, 9, 19465–19488 RSC.
- T. Montini, M. Melchionna, M. Monai and P. Fornasiero, Chem. Rev., 2016, 116, 5987–6041 CrossRef CAS PubMed.
- X. Wang, Y. Zhang, S. Song, X. Yang, Z. Wang, R. Jin and H. Zhang, Angew. Chem., Int. Ed., 2016, 128, 4618–4622 CrossRef.
- G. Kresse and J. Furthmüller, Phys. Rev. B: Condens. Matter Mater. Phys., 1996, 54, 11169–11186 CrossRef CAS PubMed.
- G. Kresse and J. Furthmüller, Comput. Mater. Sci., 1996, 6, 15–50 CrossRef CAS.
- J. P. Perdew, K. Burke and M. Ernzerhof, Phys. Rev. Lett., 1996, 77, 3865 CrossRef CAS PubMed.
- P. E. Blöchl, Phys. Rev. B: Condens. Matter Mater. Phys., 1994, 50, 17953–17979 CrossRef PubMed.
- G. Kresse and D. Joubert, Phys. Rev. B: Condens. Matter Mater. Phys., 1999, 59, 1758–1775 CrossRef CAS.
- S. Anantharaj, S. Kundu and S. Noda, Nano Energy, 2021, 80, 105514 CrossRef CAS.
- D. M. Morales, M. A. Kazakova, S. Dieckhöfer, A. G. Selyutin, G. V. Golubtsov, W. Schuhmann and J. Masa, Adv. Funct. Mater., 2019, 30, 1905992 CrossRef.
- C. Yang, S. Zai, Y. Zhou, L. Du and Q. Jiang, Adv. Funct. Mater., 2019, 29, 1901949 CrossRef.
- X. Yuan, H. Ge, X. Wang, C. Dong, W. Dong, M. S. Riaz, Z. Xu, J. Zhang and F. Huang, ACS Energy Lett., 2017, 2, 1208–1213 CrossRef CAS.
- X. Li, A. M. Elshahawy, C. Guan and J. Wang, Small, 2017, 13, 1701530 CrossRef PubMed.
- X. Li, S. You, J. Du, Y. Dai, H. Chen, Z. Cai, N. Ren and J. Zou, J. Mater. Chem. A, 2019, 7, 25853–25864 RSC.
- H. Sun, C. Tian, G. Fan, J. Qi, Z. Liu, Z. Yan, F. Cheng, J. Chen, C. P. Li and M. Du, Adv. Funct. Mater., 2020, 30, 1910596 CrossRef CAS.
- D. Chen, D. He, J. Lu, L. Zhou, F. Liu, J. Liu, J. Yu, G. Wan, S. He and Y. Luo, Appl. Catal., B, 2017, 218, 249–259 CrossRef CAS.
- V. K. Paidi, L. Savereide, D. J. Childers, J. M. Notestein, C. A. Roberts and J. v. Lierop, ACS Appl. Mater. Interfaces, 2017, 9, 30670–30678 CrossRef CAS PubMed.
- C. Du, L. Yang, F. Yang, G. Cheng and W. Luo, ACS Catal., 2017, 7, 4131–4137 CrossRef CAS.
- G. Spezzati, A. D. Benavidez, A. T. DeLaRiva, Y. Su, J. P. Hofmann, S. Asahina, E. J. Olivier, J. H. Neethling, J. T. Miller, A. K. Datye and E. J. M. Hensen, Appl. Catal., B, 2019, 243, 36–46 CrossRef CAS.
- B. Chang, J. Yang, Y. Shao, L. Zhang, W. Fan, B. Huang, Y. Wu and X. Hao, ChemSusChem, 2018, 11, 3198–3207 CrossRef CAS PubMed.
- J. Zhang, C. Zhang, Z. Wang, J. Zhu, Z. Wen, X. Zhao, X. Zhang, J. Xu and Z. Lu, Small, 2018, 14, 1703098 CrossRef PubMed.
- P. Zhou, X. Lv, D. Xing, F. Ma, Y. Liu, Z. Wang, P. Wang, Z. Zheng, Y. Dai and B. Huang, Appl. Catal., B, 2020, 263, 118330 CrossRef CAS.
- Z. Xue, Y. Li, Y. Zhang, W. Geng, B. Jia, J. Tang, S. Bao, H.-P. Wang, Y. Fan, Z.-w. Wei, Z. Zhang, Z. Ke, G. Li and C.-Y. Su, Adv. Energy Mater., 2018, 8, 1801564 CrossRef.
- Z. Chen, Y. Song, J. Cai, X. Zheng, D. Han, Y. Wu, Y. Zang, S. Niu, Y. Liu, J. Zhu, X. Liu and G. Wang, Angew. Chem., Int. Ed., 2018, 57, 5076–5080 CrossRef CAS PubMed.
Footnote |
| † Electronic supplementary information (ESI) available. See https://doi.org/10.1039/d2ra00968d |
| This journal is © The Royal Society of Chemistry 2022 |

