 Open Access Article
Ratiometric fluorescent sensors for nitrite detection in the environment based on carbon dot/Rhodamine B systems†
Huihui Taoab,
Zhao Zhangab,
Qiao Caob,
Lingfei Lic,
Shihao Xuc,
Changlong Jiang c,
Yucheng Li
 *a and
Yingying Liu
 *b
*b
aSchool of Resources and Environmental Engineering, Anhui University, Hefei, 230601, Anhui Province, P. R. China. E-mail: li-yucheng@163.com
bInstitute of Intelligent Machines, Hefei Institutes of Physical Science, Chinese Academy of Sciences, Hefei 230031, P. R. China. E-mail: yyliu@iim.ac.cn
cInstitute of Solid State Physics, Hefei Institutes of Physical Science, Chinese Academy of Sciences, Hefei 230031, P. R. China
First published on 26th April 2022
Abstract
A novel carbon dot/Rhodamine B-based ratiometric fluorescent probe was developed for a highly sensitivity and selective detection of nitrite (NO2−). The probe showed colour changes from blue to orange under ultraviolet light in response to NO2− with a detection limit as low as 67 nM in the range of 0 to 40 μM. A ratiometric fluorescent test paper was successfully prepared using the probe solution, which demonstrated its feasibility towards a rapid and semi-quantitative detection of NO2− in real samples.
Introduction
Nitrite ions (NO2−), as simple inorganic salts, are widely distributed in the environment. They play an important role in food preservation, industrial processing and biological nitrogen cycle.1 However, NO2− in food can form a series of carcinogenic N-nitroso compounds when it reacts with amines and amides.2–5 Nitrite, by itself is toxic, particularly for fishes in water, as it inhibits oxygen exchange in the bloodstream. NO2− in soil is considered as an intermediate during nitrification as well as denitrification. The accumulation of NO2− is reported to have toxic effects on plants.6 NO2− detection in soil extracts is in great demand because nitrate, as one of the most concerned N-nutrient forms, is usually determined by its reduced form nitrite in standard procedures.7,8 There have been many detection methods for NO2−, including electrochemistry,9 colorimetric methods,10 capillary electrophoresis,11 spectrophotometry12,13 and chromatography.14 However, these methods involve cumbersome detection procedures, require expensive instruments, or cannot easily be transferred to the field for real-time testing. Thus, the development of low-cost methods for the rapid on-site detection of nitrites in environmental samples is necessary.The most common rapid detection method of NO2− is the colorimetric method based on the Griess test: NO2− reacts with sulfanilamide to produce a diazo salt, followed by coupling with naphthalene ethylenediamine hydrochloride to produce a magenta dye as an indicator of nitrite.12,13 Some paper devices have been reported to detect NO2− based on the Griess method.15–17 Nitrite test strips/kits based on this method are commercially available. However, the Griess method suffers from low detection limits and ion and sample colour interferences, which impede its application in real-time detection.18,19
Recently, fluorescent probes, especially those based on carbon dot (CD) materials, have attracted much attention because they are cheap, highly sensitive and simple to operate. They have been widely used in biological imaging,20 medical diagnosis21 and fluorescence sensing.22,23 Several studies have reported the development of CD probes for NO2− detection with a detection limit in the sub-micromolar range.24–29 The surface of nitrogen-doped CD contains a large number of amino groups, which interact with NO2− to form diazonium compounds under acidic conditions through a Griess-like reaction, resulting in the fluorescence quenching of CD.30–32 However, most of the reports use single-colour “on–off” type probes for the detection of nitrites. The single-emission fluorescence probe is easily affected by various external sources, such as backgrounds. In addition, a change in one colour makes it difficult for the on-site detection, especially when using a portable device, e.g., paper, to semi-quantitatively detect NO2− with naked eyes.
Ratiometric fluorescent probes are constructed from two separate fluorescence emission wavelengths, one of which is constant as a reference peak and the other is a signal peak that may be quenched or turned on. Under an UV lamp, ratiometric fluorescent probes can provide multi-color changes to avoid exogenous influence, making the on-site detection simple. There are only limited reports about the development of a ratiometric fluorescent test paper detecting NO2−.33 Rhodamine B (RhB) is a kind of fluorescent dye that can emit dazzling fluorescent color under the ultraviolet light. It has the characteristics of good photostability at a very low cost. RhB has been used in several probe systems.34–37 As RhB shows no response to NO2−, it can be used as the background reference signal of a ratiometric fluorescent probe to improve the detection sensitivity and eliminate background interference. As far as we know, there are no reports on the use of RhB for the detection of NO2−.
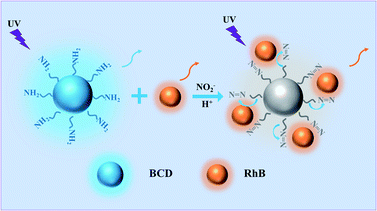
Herein, we report a low-cost, sensitive and selective ratiometric fluorescent probe to visually detect NO2− with blue carbon dot (BCD)/RhB system. The fluorescence of BCD is quenched by NO2− via a Griess-like mechanism, while the background reference fluorescence uses inexpensive organic dyes insensitive to NO2−. The fluorescence colour change of the dual emission system can be conveniently distinguished with eyes. The probe's limit of detection (LOD) can extend up to 67 nM in the range of 0 to 40 μM for solutions, which is far lower than 1 mg L−1, the maximum for NO2− in drinking water according to the United States Environmental Protection Agency.38 The ratiometric fluorescent test paper prepared from the ratiometric fluorescent probe solution shows great advances in the detection of NO2− in real samples from soil extracts, lake water, fish pond water and gutter water, compared to traditional colorimetric methods with detection ranging from 0 to 40 μM.
Experimental
Materials and reagents
o-Phenylenediamine and N-(1-naphthyl)ethylenediamine dihydrochloride (NED) were purchased from Macklin. Citric acid, Rhodamine B and all metal salts were bought from Aladdin. All chemicals were directly used as obtained. Ultrapure water was taken from a Millipore water purification system in laboratory (18.2 MΩ cm−1).Characterization and instruments
Ultraviolet-visible (UV-Vis) absorption spectra were recorded using an Agilent Cary 3500 UV-Vis spectrometer. Fluorescence spectra were recorded using an Agilent Cary Eclipse spectrometer. A JEM-2100F transmission electron microscope was used to observe the transmission electron microscopy (TEM) image of samples. Fourier transform infrared (FTIR) spectra were recorded using an Agilent FTIR spectrometer. X-ray photoelectron spectroscopy (XPS) spectra were recorded using a Thermo Scientific ESCALAB 250 high-performance electron spectrometer. Fluorescence photos were acquired using a Canon EOS600D digital camera under a WFH-204B portable ultraviolet lamp (365 nm).Synthesis of BCD
0.36 g citric acid and 0.64 g o-phenylenediamine were dissolved in 10 mL water, and the mixed solution was placed in a 50 mL polytetrafluoroethylene autoclave and then heated in an oven at 185 °C for 4 h. After the solution was cooled to room temperature, it was centrifuged at 10![[thin space (1/6-em)]](https://www.rsc.org/images/entities/char_2009.gif) 000 rpm for 5 min and then dialyzed for 24 h. The final BCD solution was freeze-dried to obtain the BCD powder.
000 rpm for 5 min and then dialyzed for 24 h. The final BCD solution was freeze-dried to obtain the BCD powder.
Fluorescence detection of NO2−
RhB (20 μL, 0.15 mg mL−1), BCD (25 μL, 60 μg mL−1), phosphate buffer saline (PBS) (2.92 mL, 30 mM, pH = 3) and NO2− solutions (30 μL) were added sequentially. After the above mixed solution reacted for 5 min, fluorescence spectra were measured and recorded using a fluorescence spectrophotometer. At the same time, the fluorescence colour change was observed under a 365 nm UV lamp.The fluorescence intensity ratio (ratiometric fluorescence intensity) of NO2−-sensing was calculated using the fluorescence intensity of the emission wavelengths of BCD (λem = 466 nm, I466) and RhB (λem = 580 nm, I580), noted as I466/I580.
The formula of linear fitting between the concentration of NO2− and fluorescence intensity ratios are as follows:
| I466/I580 = a[NO2−] + b |
The calculation formula of the limit of detection (LOD) and the limit of quantification (LOQ) is as follows:
| LOD = 3σ/k |
| LOQ = 10σ/k |
Selectivity and anti-interference experiments
To verify the selectivity of the ratiometric fluorescent probe, a series of ions (400 μM NH4+, Na+, Zn2+, Fe2+, Cu2+, Cd2+, Hg2+, Fe3+, K+, Pb2+, HSO3−, S2O32−, I−, Br−, CN−, CO32−, H2PO4−, SO42−, HCO3−, NO3− and Cl−), instead of NO2−, were added to the ratiometric fluorescent probe solution, and then 40 μM NO2− was mixed with this solution to explore the anti-interference capacity of the probe.Preparation of the ratiometric fluorescent test paper
The ratiometric fluorescent test paper was prepared by referring to a previous study.39 First, No. 1 qualitative filter paper (Whatman, UK) was cut into square paper sheets. After that, 25 μL RhB (0.15 mg mL−1), 25 μL BCD solution (60 μg mL−1), 2.92 mL PBS (30 mM, pH = 3) and 10 μL 0.5% Nafion solution were thoroughly mixed and the pH of the system was adjusted to 3 (0.5% Nafion solution was added to better fix the probe on the test paper). The test paper was then immersed in the mixed solution for 30 s and air-dried in the dark to obtain a ratiometric fluorescent test paper. Finally, different concentrations of NO2− were dropped onto the ratiometric fluorescent test paper. The fluorescence properties of the fluorescent test paper in the presence of NO2− were studied.Analysis of NO2− in environmental samples
To study whether the ratiometric fluorescent probe is applicable to environmental samples, NO2− in soil extracts, lake water, fish pond water and gutter water was detected. The soil samples (S-1 to S-3) were taken from the Zipeng mountain. The soil extracts were prepared by standard methods (National Environmental Protection Standards of the People's Republic of China: soil-determination of ammonium, nitrite and nitrate by extraction with potassium chloride solution-spectrophotometric methods; HJ 634-2012).40 A 1 g dried soil and 10 mL 2 M KCl were mixed and shaken, which was then filtered through a filter paper. The samples from lake water (L-1 to L-3, from Chaohu lake), fish pond water (F-1, from Zipeng mountain) and gutter water (G-1, from Zipeng mountain) were purified using a filter paper and a 0.22 μm microporous membrane. Afterwards, to investigate recoveries, NO2− of various concentrations were added to the samples respectively, and the corresponding equation is recovery = (D − C)/E × 100% (D is the concentration of the substance added quantitatively, C is the concentration of the analyte in the assay sample and E is the theoretical concentration of the quantitatively added substance to be tested).1 Then, they were detected using a ratiometric fluorescent probe, a ratiometric fluorescent test paper and standard methods (water samples, GB 7493-87; soil extracts, HJ 634-2012).40,41 All average values were obtained from three parallel experiments (n = 3).Results and discussion
Synthesis and characterization of BCD
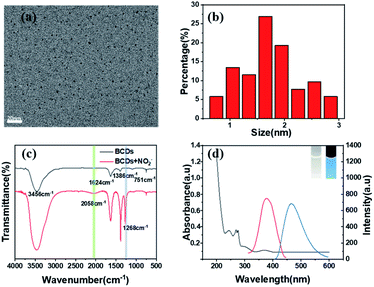
The Griess test is widely used in the colorimetric detection of nitrites. In this study, we tried to detect nitrite by fluorescence changes caused by the Griess-like reaction between amino groups on the BCD probe and NO2− (Scheme 1). With o-phenylenediamine and citric acid as precursors, a one-pot hydrothermal method was used for synthesizing BCD, which was similar to that of the previous report.42 To test whether BCD were successfully prepared, we performed a series of characterizations. Good monodispersity is observed in the TEM image of BCD (Fig. 1a); the size of BCD is distributed between 0.75 and 2.85 nm and averages at 1.67 nm (Fig. 1b). The FTIR spectra were used to further characterize BCD. The two peaks at 1624 cm−1 and 1386 cm−1 are assigned to C![[double bond, length as m-dash]](https://www.rsc.org/images/entities/char_e001.gif) N and C–N stretching vibrations, respectively. A characteristic peak caused by the plane bending vibration of the benzene ring appears near 751 cm−1. The peak at 3456 cm−1 is attributed to the stretching vibration of N–H, which demonstrates that BCD contain amino groups (Fig. 1c). As shown in Fig. S1,† there is consistency of the elemental composition and chemical bonds between XPS measurements and the FTIR measurements. It can be found from the UV-Vis spectrum that the four characteristic absorption peaks of BCD are located at 243 nm, 271 nm, 298 nm and 370 nm. This is caused by the π → π* transition of C
N and C–N stretching vibrations, respectively. A characteristic peak caused by the plane bending vibration of the benzene ring appears near 751 cm−1. The peak at 3456 cm−1 is attributed to the stretching vibration of N–H, which demonstrates that BCD contain amino groups (Fig. 1c). As shown in Fig. S1,† there is consistency of the elemental composition and chemical bonds between XPS measurements and the FTIR measurements. It can be found from the UV-Vis spectrum that the four characteristic absorption peaks of BCD are located at 243 nm, 271 nm, 298 nm and 370 nm. This is caused by the π → π* transition of C![[double bond, length as m-dash]](https://www.rsc.org/images/entities/char_e001.gif) C.43 The fluorescence spectrum of BCD shows that there is an emission peak at 466 nm when the excitation wavelength is 365 nm (Fig. 1d). With a 365 nm UV lamp, BCD show bright blue fluorescence (inset of Fig. 1d).
C.43 The fluorescence spectrum of BCD shows that there is an emission peak at 466 nm when the excitation wavelength is 365 nm (Fig. 1d). With a 365 nm UV lamp, BCD show bright blue fluorescence (inset of Fig. 1d).
Optimal excitation wavelength for the ratiometric fluorescent probe
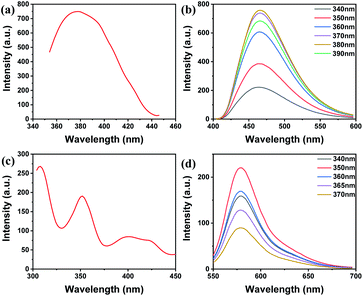
A dual emission system was built up using blue-emission BCD and red-emission RhB in this study to improve the visual detection of the probe with naked eyes. RhB was chosen as the background fluorophore due to its insensitivity to nitrite, distinguished emission colour to BCD and low cost. The emission and excitation prosperities of this system were studied and optimized. As shown in Fig. 2, the BCD excitation peak is located at 378 nm. The fluorescence excitation spectra of RhB are observed with two excitation peaks at 308 nm and 352 nm. BCD show excitation wavelength dependence, and the fluorescence emission spectrum gradually red-shifts with the increase in the excitation wavelength. This property is due to emissive traps and electronic conjugate structures.44–46 When the excitation wavelength of BCD was set at 340, 350, 360, 370, 380 and 390 nm, it was found that the fluorescence intensity reached the maximum at 380 nm. At the same time, as the excitation wavelength of RhB was set at 340, 350, 360, 365, and 370 nm, it was observed that the fluorescence intensity reaches the maximum at 350 nm. Considering that the excitation wavelength should excite both BCD and RhB, as well as taking into account its accessibility, 365 nm is selected as the excitation wavelength for tests. Under excitation at 365 nm, the emission peaks of BCD and RhB are at 466 nm and 580 nm, respectively (Fig. S2†). According to Fig. S3,† the zeta potentials of BCD and BCD + NO2− are 45 mV and −36 mV, respectively, and the ratio of fluorescence intensity (I466/I580) did not change after 6 h ultraviolet radiation at different temperatures (Fig. S3†), which demonstrate that the stability of the ratiometric fluorescent probe system is good in aqueous solutions.Effect of pH on the ratiometric fluorescent probe
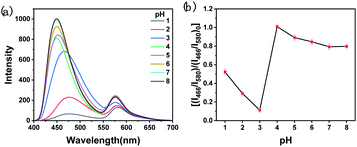
The fluorescence properties of BCD and RhB were investigated at different pH values. As shown in Fig. 3a, when pH increases, the fluorescence spectrum of BCD undergoes a red-shift with a gradual decrease in fluorescence intensity. For RhB (Fig. 3a), the fluorescence intensity at 179 nm gradually decreases when pH < 4, which may be caused by protonation; and it remains unchanged for pH > 4. pH plays an important role in the detection of NO2− by the Griess test, as it requires acidic conditions to form the diazo compound.12 We studied the influence of pH on the quenching of fluorescence of the ratiometric fluorescent probe by NO2−. The quenching effect of the ratiometric fluorescent probe on NO2− reaches the maximum at pH 3 (Fig. 3b). This is selected as the optimized pH in the detection process.Response to NO2−
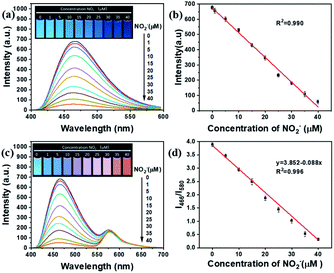
The sensitivity of BCD, RhB and the ratiometric fluorescent probe was evaluated by measuring the fluorescence intensity with the addition of different amounts of NO2−. As shown in Fig. 4a and b, as the concentration of NO2− increases from 0 to 40 μM, the fluorescence intensity of BCD gradually decreases, which shows a good linear relationship (R2 = 0.990). In contrast, the fluorescence of RhB remains constant (Fig. S4†). These demonstrate that the ratiometric fluorescent probe can be constructed using nitrite-responsible BCD and non-active RhB as background emission agents.The fluorescence colour variation of the ratiometric fluorescent probe was studied using different fluorescence intensity ratios (I466/I580 BCD/RhB) of BCD and RhB. When I466/I580 was tuned with 3/1, 4/1 and 5/1, the most obvious change in fluorescent colour from blue to orange was observed when I466/I580 = 4/1 (Fig. 4c and S5†), which can be used for visual detection with naked eyes. In Fig. 4d, the fluorescence intensity ratio (I466/I580) is linearly related to the NO2− concentration in the range of 0 to 40 μM. The corresponding linear regression equation is I466/I580 = −0.088 [NO2−] + 3.852 (R2 = 0.996). According to the formula 3σ/k, where σ is the standard deviation and k is the slope of the regression equation, the LOD for NO2− is as low as 67 nM. We investigated the response of the probe at low concentrations of NO2− near LOD. It has a response to NO2− of 75 nM (Fig. S6 and Table S1†), which is very close to LOD. LOQ is about 227 nM, which is estimated based on the following equation: LOQ = 10σ/k. Furthermore, the kinetic experiment shows that the detection of nitrites by the ratiometric fluorescent probe can be completed within 5 min (Fig. S7†).
Selectivity and anti-interference ability
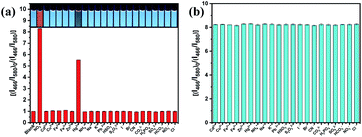
The selectivity of the ratiometric fluorescent probe for different anions and cations was investigated under the same conditions. Fig. 5 shows that the I466/I580 ratio was quenched by about 92% by NO2− at 40 μM with its colour changing from blue to orange. When 400 μM anti-interference ions were added to the ratiometric fluorescent probe solution, no obvious changes in the fluorescence intensity and colour were observed. These experiments suggest that the ratiometric fluorescent probe has good selectivity to NO2−. However, Hg2+ could reduce the fluorescence intensity of the ratiometric fluorescent probe due to the strong interaction between Hg2+ and surface groups on BCD (such as –COOH/–OH), finally resulting in fluorescence quenching by the electron transfer;47 however, its influence can be eliminated by adding ethylenediaminetetraacetic acid (EDTA), resulting in the formation of an EDTA–mercury complex (Fig. S8†).48 After further addition of 40 μM NO2− into these solutions, the I466/I580 ratio of the ratiometric fluorescent probe restored completely. We also investigated the detection performance of NO2− in the presence of various concentrations of NaCl. As shown in Fig. S9,† the addition of high concentrations of NaCl had no effect on the fluorescence intensity ratio of the ratiometric fluorescent probe. These results indicate that the ratiometric fluorescent probe cannot be affected by common ions in the environment when detecting real samples.Possible mechanism of optical response of BCD to NO2−
To further investigate the interaction between BCD and NO2−, the UV-Vis spectra of BCD with or without NO2− were recorded separately. According to Fig. S10a,† the absorbance of BCD at 370 nm obviously disappeared after the introduction of NO2−. This may be due to the aggregation of BCD when interacting with NO2−.49 In the FTIR spectrum of BCD + NO2− mixture (Fig. 1c), two new peaks were found around the wavelength of 2058 cm−1 and 1268 cm−1, which are attributed to the double bond accumulation stretching vibration peak. NED is widely used in the quantitative analysis of nitrite via a diazonium coupling reaction to give a strongly colored azo compound. As shown in Fig. S10b,† after mixing NED with the solution of BCD and NO2−, the colour of the mixed solution turned into magenta instantly, which showed a new absorbance peak at 540 nm. The absorbance at 540 nm is proportionate to the concentration of NO2−. These strongly indicate that NO2− interacts with amino groups of BCD via a Griess-like reaction, which gives a diazonium salt that can react with NED. The TEM image shows that BCD aggregated after the addition of NO2− solution (Fig. S11†). Therefore, it can be concluded that the quenching fluorescence phenomenon originated from the nitrite-response aggregation of BCD caused by a Griess-like reaction between the amino groups of BCD and NO2−.Application in real samples
To further study the practicability of the ratiometric fluorescent probe in actual samples, the ratiometric fluorescent probe was applied to detect soil extracts (S-1 to S-3), lake water samples (L-1 to L-3), fish pond water (F-1) and gutter water (G-1). Spiking and recovery tests were also performed with samples S-1, L-1, F-1 and G-1 by the addition of different concentrations of NO2− (0, 10, 20 and 30 μM) to the as-prepared samples. The fluorescence intensity of these samples was systematically tested. According to Table 1, the recovery rates of soil extract samples, lake water, fish pond water and gutter water are in the range of 101.10–105.03%, 97.83–100.05%, 96.21–107.41%, and 99.67–105.15%, respectively. The relative standard deviation (RSD) of soil extract samples, lake water, fish pond water and gutter water were 2.06–2.69%, 1.17–2.85%, 2.81–3.20%, and 2.17–3.16%, respectively. At the same time, compared with the standard method (water samples, GB 7493-87; soil extracts, HJ 634-2012), the results are in good agreement (error < 5%) (Tables S2 and S3†), which indicates that it is reliable to detect NO2− in the environment using the ratiometric fluorescent probe.| Sample | Spiked concentration (μM) | Found (μM) | Recovery (%) | RSD (%) | Standard method (μM) |
|---|---|---|---|---|---|
| Soil samples (S-1) | 0 | 9.20 ± 0.23 | — | 2.50 | 9.52 ± 0.32 |
| 10 | 19.31 ± 0.52 | 101.10 | 2.69 | 19.70 ± 0.41 | |
| 20 | 30.08 ± 0.70 | 104.40 | 2.33 | 29.37 ± 0.66 | |
| 30 | 40.71 ± 0.84 | 105.03 | 2.06 | 40.14 ± 0.71 | |
| Lake water samples (L-1) | 0 | 1.08 ± 0.03 | — | 2.78 | 1.08 ± 0.03 |
| 10 | 10.86 ± 0.31 | 97.83 | 2.82 | 11.30 ± 0.26 | |
| 20 | 21.09 ± 0.60 | 100.05 | 2.85 | 20.65 ± 0.51 | |
| 30 | 30.87 ± 0.36 | 99.28 | 1.17 | 31.08 ± 0.41 | |
| Fish pond water (F-1) | 0 | 4.27 ± 0.12 | — | 2.81 | 4.14 ± 0.11 |
| 10 | 15.01 ± 0.48 | 107.41 | 3.20 | 15.53 ± 0.41 | |
| 20 | 25.14 ± 0.77 | 104.35 | 3.06 | 24.21 ± 0.89 | |
| 30 | 33.11 ± 0.94 | 96.21 | 2.84 | 32.15 ± 0.68 | |
| Gutter water (G-1) | 0 | 18.9 ± 0.41 | — | 2.17 | 19.44 ± 0.53 |
| 10 | 28.87 ± 0.80 | 99.67 | 2.77 | 28.13 ± 0.85 | |
| 20 | 39.93 ± 1.26 | 105.15 | 3.16 | 38.65 ± 1.41 |
A simple ratiometric fluorescent test paper was made to satisfy the need of sensitive and fast NO2− detection. The ratiometric fluorescent test paper was prepared by immersing a filter paper in the aqueous probe mixture (ratiometric fluorescence intensity of 4![[thin space (1/6-em)]](https://www.rsc.org/images/entities/char_2009.gif) :
:![[thin space (1/6-em)]](https://www.rsc.org/images/entities/char_2009.gif) 1 at pH 3). Due to the high solubility of BCD in aqueous solutions, Nafion solution was added to better fix the BCD on the paper surface (Fig. S13†) to prevent the diffusion of BCD upon addition of the sample solution. Nafion showed no influence on the fluorescence intensity as well as detection ability towards NO2− of BCD (Fig. S14†). The ratiometric fluorescent test paper emitted bright blue fluorescence under irradiation (365 nm) (Fig. S12†). Different concentrations of NO2− solutions were tested using the ratiometric fluorescent test paper. The visible colour of the ratiometric fluorescent test paper showed a colour change from blue to orange as the concentration of the nitrite increased (Fig. 6a). We further tested the applicability of the ratiometric fluorescent test paper to detect NO2− in the above-mentioned real samples (Fig. 6b). The ratiometric fluorescent test paper showed obvious colour response to different concentrations of NO2− in soil extracts, lake water, fish pond water and gutter water of the spiked samples. In addition, the colour change trend detected in real samples resembled that in Fig. 6a. Furthermore, compared with the commercial colorimetric nitrite test paper, the ratiometric fluorescent test paper is more sensitive and easier to detect samples with the naked eye (Fig. S15 and Table S3†). This demonstrates the advances of the fluorescent test paper in the real-world rapid detection applications. A comparison of the ratiometric fluorescent probe with other reported methods for the detection of NO2− is presented in Tables 2 and S4.† The ratiometric fluorescent probe in this work shows advantages in the detection limit, visuality of colour change and on-site applications. Moreover, both BCD and RhB in our study were easy to prepare at low cost, which makes our system more promising to detect nitrite in wide applications.
1 at pH 3). Due to the high solubility of BCD in aqueous solutions, Nafion solution was added to better fix the BCD on the paper surface (Fig. S13†) to prevent the diffusion of BCD upon addition of the sample solution. Nafion showed no influence on the fluorescence intensity as well as detection ability towards NO2− of BCD (Fig. S14†). The ratiometric fluorescent test paper emitted bright blue fluorescence under irradiation (365 nm) (Fig. S12†). Different concentrations of NO2− solutions were tested using the ratiometric fluorescent test paper. The visible colour of the ratiometric fluorescent test paper showed a colour change from blue to orange as the concentration of the nitrite increased (Fig. 6a). We further tested the applicability of the ratiometric fluorescent test paper to detect NO2− in the above-mentioned real samples (Fig. 6b). The ratiometric fluorescent test paper showed obvious colour response to different concentrations of NO2− in soil extracts, lake water, fish pond water and gutter water of the spiked samples. In addition, the colour change trend detected in real samples resembled that in Fig. 6a. Furthermore, compared with the commercial colorimetric nitrite test paper, the ratiometric fluorescent test paper is more sensitive and easier to detect samples with the naked eye (Fig. S15 and Table S3†). This demonstrates the advances of the fluorescent test paper in the real-world rapid detection applications. A comparison of the ratiometric fluorescent probe with other reported methods for the detection of NO2− is presented in Tables 2 and S4.† The ratiometric fluorescent probe in this work shows advantages in the detection limit, visuality of colour change and on-site applications. Moreover, both BCD and RhB in our study were easy to prepare at low cost, which makes our system more promising to detect nitrite in wide applications.
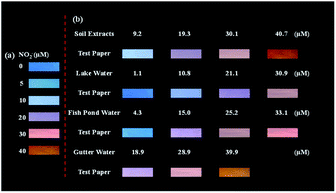 | ||
| Fig. 6 (a) Visual detection of NO2− using the ratiometric fluorescent test paper. (b) Visual detection of NO2− in soil, lake water, fish pond water and gutter water samples, respectively. | ||
| Colour change | Linear range (μM) | LOD (μM) | Time (min) | Application | Ref. |
|---|---|---|---|---|---|
| Blue to colorless | 0–1000 | 1.00 | 5 | — | 50 |
| Blue to colorless | 8–800 | 21.20 | 20 | — | 51 |
| Blue to colorless | 2.3–7700 | 0.0079 | 720 | — | 52 |
| Colorless to orange | 8–100 | 0.65 | 3 | — | 53 |
| Cyan to red | 0.0625–2.0 | 0.018 | 10 | Test kit | 54 |
| Blue to orange | 0–40 | 0.067 | <5 | Test paper | This work |
Conclusion
In this work, a visual ratiometric fluorescent probe containing blue carbon dot and the organic dye Rhodamine B has been successfully constructed, which can visually detect NO2− in real time. NO2− can quench the fluorescence of blue carbon dot, with Rhodamine B as a background reference. The probe sensitively detects nitrite in the concentration range of 0–40 μM with an LOD of 67 nM. A fluorescent colour change from blue to orange could be obviously distinguished with naked eyes. On this basis, a ratiometric fluorescent test paper has been prepared and successfully applied to detect NO2− in soil extracts, lake water, fish pond water and gutter water samples with naked eyes. It provides an effective and low-cost method for the visual detection of nitrites.Conflicts of interest
There are no conflicts to declare.Acknowledgements
This work is supported by the National Natural Science Foundation of China (22001253), Science and Technology Major Project of Anhui Province (2020b06050001) and the National Science and Technology Major Project of Science and Technology of China (No. 2017ZX07603002).Notes and references
- G. Q. Xiang, Y. L. Wang, H. Zhang, H. H. Fan, L. Fan, L. J. He, X. M. Jiang and W. J. Zhao, Food Chem., 2018, 260, 13–18 CrossRef CAS PubMed.
- H. Suzuki, K. Iijima, A. Moriya, K. McElroy, G. Scobie, V. Fyfe and K. McColl, Gut, 2003, 52, 1095–1101 CrossRef CAS PubMed.
- K. O. Honikel, Meat Sci., 2008, 78, 68–76 CrossRef CAS PubMed.
- C. Jo, H. J. Ahn, J. H. Son, J. W. Lee and M. W. Byun, Food Control, 2003, 14, 7–12 CrossRef CAS.
- J. Zhang, C. Yang, X. Wang and X. Yang, Analyst, 2012, 137, 3286–3292 RSC.
- O. L. OKE, Nature, 1966, 212, 528 CrossRef CAS.
- O. Özdestan and A. Üren, J. Agric. Food Chem., 2010, 58, 5235–5240 CrossRef PubMed.
- J. E. Sanderson, J. R. Consaul and K. Lee, J. Food Sci., 1991, 56, 1123–1124 CrossRef CAS.
- M. Sookhakian, M. A. M. Teridi, G. B. Tong, P. M. Woi, U. Khalil and Y. Alias, ACS Appl. Nano Mater., 2021, 4, 12737–12744 CrossRef CAS.
- J. Xu, Y. F. Shi, S. S. Yang, J. L. Yang, X. Zhang, L. R. Xu, Z. Bian, Z. H. Xu and B. C. Zhu, Microchem. J., 2021, 169, 106342–106347 CrossRef CAS.
- S. H. David, C. Anuja, A. C. W Carrie, G. Julie and K. Paul, J. Chem. Educ., 1998, 75, 1588–1590 CrossRef.
- J. B. F. Jr, Anal. Chem., 1979, 51, 1493–1502 CrossRef.
- C. J. Patton, A. E. Fischer, W. H. Campbell and E. R. Campbell, Environ. Sci. Technol., 2002, 36, 729–735 CrossRef CAS PubMed.
- D. Coviello, R. Pascale, R. Ciriello, A. M. Salvi, A. Guerrieri, M. Contursi, L. Scrano, S. A. Bufo, T. R. I. Cataldi and G. Bianco, Foods, 2020, 9, 1238–1248 CrossRef CAS PubMed.
- D. Li, Y. Ma, H. Duan, W. Deng and D. Li, Biosens. Bioelectron., 2018, 99, 389–398 CrossRef CAS PubMed.
- A. Tan, G. Yang and X. Wan, Spectrochim. Acta, Part A, 2021, 253, 119583–119592 CrossRef CAS PubMed.
- E. Trofimchuk, Y. X. Hu, A. Nilghaz, M. Z. Hua and X. N. Lu, Food Chem., 2020, 316, 126396–126402 CrossRef CAS PubMed.
- E. Vidal, A. S. Lorenzetti, A. G. Lista and C. E. Domini, Microchem. J., 2018, 143, 467–473 CrossRef CAS.
- B. M. Jayawardane, W. Shen, I. D. McKelvie and S. D. Kolev, Anal. Chem., 2014, 86, 7274–7279 CrossRef CAS PubMed.
- W. R. Algar, M. Massey, K. Rees, R. Higgins, K. D. Krause, G. H. Darwish, W. J. Peveler, Z. J. Xiao, H. Y. Tsai, R. Gupta, K. Lix, M. V. Tran and H. Kim, Chem. Rev., 2021, 121, 9243–9358 CrossRef CAS PubMed.
- Y. J. Chung, J. Kim and C. B. Park, ACS Nano, 2020, 14, 6470–6497 CrossRef CAS PubMed.
- M. X. Li, T. Chen, J. Gooding and J. Q. Liu, ACS Sens., 2019, 4, 1732–1748 CrossRef CAS PubMed.
- J. Y. Hu, Y. Q. Sun, A. A. Aryee, L. B. Qu, K. Zhang and Z. H. Li, Anal. Chim. Acta, 2021, 338885–338899 CrossRef.
- Y. Liu, S. Luo, P. Wu, C. Ma, X. Wu, M. Xu, W. Li and S. Liu, Anal. Chim. Acta, 2019, 1090, 133–142 CrossRef CAS PubMed.
- M. Yu, H. Zhang, Y. N. Liu, Y. L. Zhang, M. H. Shang, L. Wang, Y. T. Zhuang and X. Lv, Food Chem., 2022, 374, 131768–131777 CrossRef CAS PubMed.
- W. S. Li, S. P. Huang, H. Y. Wen, Y. Luo, J. W. Cheng, Z. Jia, P. Han and W. M. Xue, Anal. Bioanal. Chem., 2020, 412, 993–1002 CrossRef CAS PubMed.
- J. Y. Xu, Q. Qi, L. L. Sun, X. J. Guo, H. M. Zhang and X. H. Zhao, J. Alloys Compd., 2022, 908, 164519–164529 CrossRef CAS.
- L. L. Wang, J. Jana, J. S. Chung, W. M. Choi and S. H. Hur, Spectrochim. Acta, 2022, 268, 120657–120666 CrossRef CAS PubMed.
- M. C. Rong, D. R. Wang, Y. Y. Li, Y. Z. Zhang, H. Y. Huang, R. F. Liu and X. Z. Deng, J. Anal. Test., 2021, 5, 51–59 CrossRef.
- Y. M. Hao, Z. H. Yang, W. J. Dong, Y. Liu, S. M. Song, Q. Hu, S. M. Shuang, C. Dong and X. J. Gong, J. Hazard. Mater., 2022, 430, 128393–128407 CrossRef CAS PubMed.
- Q. C. Zhang, F. L. Tian, Q. Zhou, C. B. Zhang, S. Tang, L. Jiang and S. X. Du, Inorg. Chem. Commun., 2022, 140, 109442–109451 CrossRef CAS.
- R. Ludmerczki, S. Mura, L. Stagi, T. Juhasz, M. Dettori, A. Azara, P. Innocenzi and L. Malfatti, Environ. Nanotechnol., Monit. Manage., 2021, 16, 100573–100582 Search PubMed.
- K. Vellingiri, V. Choudhary and L. Philip, J. Environ. Chem. Eng., 2019, 7, 103374–103384 CrossRef CAS.
- P. Guo, Y. Wang and Q. F. Zhuang, Sens. Actuators, B, 2019, 299, 126783–126790 Search PubMed.
- Y. Du, Y. H. Song, J. Hao, K. Y. Cai, N. Liu, L. Yang and L. Wang, Talanta, 2019, 198, 316–322 CrossRef CAS PubMed.
- Q. He, S. Y. Zhuang, Y. X. Yu, H. J. Li and Y. D. Liu, Anal. Chim. Acta, 2021, 1174, 338743–338752 CrossRef CAS PubMed.
- S. Dehghani, N. M. Danesh, M. Ramezani, M. Alibolandi, P. Lavaee, M. Nejabat, K. Abnous and S. M. Taghdisi, Anal. Chim. Acta, 2018, 1030, 142–147 CrossRef CAS PubMed.
- J. Cang, C. W. Wang, P. C. Chen, Y. J. Lin, Y. C. Li and H. T. Chang, Anal. Methods, 2013, 9, 5254–5259 RSC.
- K. Huang, K. L. Xu, W. Zhu, L. Yang, X. D. Hou and C. B. Zheng, Anal. Chem., 2016, 88, 789–795 CrossRef CAS PubMed.
- National Environmental Protection Standards of the People's Republic of China: Soil-Determination of Ammonium, Nitrite and Nitrate by Extraction with Potassium Chloride Solution-Spectrophotometric Methods; HJ 634-2012, National Environmental Protection Agency of the People's Republic of China, 2012 Search PubMed.
- National Standards of the People's Republic of China: Water Quality-Determination of Nitrogen (Nitrite)-Spectrophotometric Method; GB 7493-87, National Environmental Protection Agency of the People's Republic of China, 1987 Search PubMed.
- V. Hinterberger, W. S. Wang, C. Damn, S. Wawra, M. Thoma and W. Peukert, Opt. Mater., 2018, 80, 110–119 CrossRef.
- G. Eda, Y. Y. Lin, C. Mattevi, H. Yamaguchi, H. A. Chen, S. Chen, C. W. Chen and M. Chhowalla, Adv. Mater., 2010, 22, 505–509 CrossRef CAS PubMed.
- S. K. Bhunia, N. Pradhan and N. R. Jana, ACS Appl. Mater. Interfaces, 2014, 6, 7672–7679 CrossRef CAS PubMed.
- Z. Q. Xu, L. Y. Yang, X. Y. Fan, J. C. Jin, J. Mei, W. Peng, W. L. Jiang, Q. Xiao and Y. Liu, Carbon, 2014, 66, 351–360 CrossRef CAS.
- Z. P. Zhang, J. Zhang, N. Chen and L. T. Qu, Energy Environ. Sci., 2012, 5, 8869–8890 RSC.
- A. Z. Tan, G. H. Yang and X. J. Wan, Spectrochim. Acta, Part A, 2021, 153, 119583–119592 CrossRef PubMed.
- P. Hajeb and S. Jinap, J. Agric. Food Chem., 2012, 60, 6069–6076 CrossRef CAS PubMed.
- X. Y. Zhao, K. Zhao and P. Q. Sun, Chem. Phys. Lett., 2020, 739, 136932–136941 CrossRef CAS.
- H. M. Zhang, S. H. Kang, G. Z. Wang and H. J. Zhao, ACS Sens., 2016, 1, 875–881 CrossRef CAS.
- L. L. Gan, Q. Su, Z. B. Chen and X. M. Yang, Appl. Surf. Sci., 2020, 530, 147269–147297 CrossRef CAS.
- J. Jana, H. J. Lee, J. S. Chung, M. H. Kim and S. H. Hur, Anal. Chim. Acta, 2019, 1079, 212–219 CrossRef CAS PubMed.
- J. Jia, W. J. Lu, L. Li, Y. Jiao, Y. F. Ga and S. M. Shuang, Chin. J. Anal. Chem., 2019, 47, 560–566 CAS.
- Y. J. Zhan, Y. B. Zeng, L. Li, F. Luo, B. Qiu, Z. Y. Lin and L. H. Guo, ACS Sens., 2019, 4, 1252–1260 CrossRef CAS PubMed.
Footnote |
| † Electronic supplementary information (ESI) available. See https://doi.org/10.1039/d2ra00973k |
| This journal is © The Royal Society of Chemistry 2022 |

