 Open Access Article
Exploring the similarity of single-layer covalent organic frameworks using electronic structure calculations†
Antonios Raptakis ab,
Alexander Croy
 c,
Arezoo Dianata,
Rafael Gutierrez
 *a and
Gianaurelio Cunibertiad
aInstitute for Materials Science and Max Bergmann Center of Biomaterials, TU Dresden, 01062 Dresden, Germany. E-mail: rafael.gutierrez@tu-dresden.de
bMax Planck Institute for the Physics of Complex Systems, 01187 Dresden, Germany
cInstitute of Physical Chemistry, Friedrich Schiller University Jena, 07737 Jena, Germany
dDresden Center for Computational Materials Science (DCMS), TU Dresden, 01062 Dresden, Germany
First published on 22nd April 2022
Abstract
Two-dimensional Covalent Organic Frameworks (2D COFs) have attracted considerable interest because of their potential for a broad range of applications. Different combinations of the monomeric units can lead to potentially novel materials with varying physico-chemical properties. In this study, we investigate the electronic properties of various 2D COFs with square lattice topology based on a tight-binding density functional theory approach. We first classify the 2D COFs into different classes according to the degree of π-conjugation. Interestingly, this classification is recovered by using a similarity measure based on specific features of the electronic band-structure of the COFs. Further, we study the effect of aromaticity on the electronic structure of fully-conjugated COFs. Our results show that the conjugation and aromaticity are keys in the electronic band-structure of COFs.
1 Introduction
Two-dimensional covalent organic frameworks (2D COFs) are an emerging class of porous and crystalline nanostructures with considerable potential for applications in many fields.1–5 Their organic networks consist of covalently linked organic ligands made from light elements such as carbon, nitrogen, and oxygen. The resulting covalent molecular architecture gives them a high thermal and chemical stability6 and has led to various emerging applications: as supercapacitors,7,8 in optoelectronics,9,10 for nanoelectronics,11 for energy12,13 and gas14,15 storage, as sensors,16,17 and in chemical- and photo-catalysis.18–20The synthesis of 2D COFs makes use of reticular chemistry via the covalent linkage of different molecular building block combinations. The interesting electronic properties observed in other monolayer materials, such as graphene and transition metal dichalcogenides, have triggered considerable interest in the properties of atomically thin COF films.21 Different strategies have been used to synthesize single-layers of 2D COFs, including exfoliation of COF sheets from a presynthesized stacked 2D COF and the growth of a monolayer directly on the surface. For example, the monolayer exfoliation can be achieved by the sonication in a delaminating solvent22–25 and the mechanical grinding,26,27 whereas monolayers have been synthesized on surfaces of Ag(111)28 and highly oriented pyrolytic graphite (HOPG).29 Very promising is the synthesis of COFs at air–water interfaces10,30–34 and at water–surfactant interfaces.35,36
The properties of the synthesized materials can be changed according to the linkage, the geometry of the organic monomeric units and the lattice shape of the resultant material.3–5 This intrinsically combinatorial nature of COFs makes theoretical and computational studies invaluable for systematizing and exploring the landscape of their chemical and physical properties. Such in silico explorations contribute not only to explain and confirm experimental results, but also are expected to help accelerating the discovery of novel COF architectures. Computational methods have thus been used to study methane adsorption,37 gas storage,38–40 photocatalysis,41 carbon capture42,43 and drug adsorption44 in 2D COFs. Also, studies correlating the properties of monomeric units with global COF properties have recently been presented.45
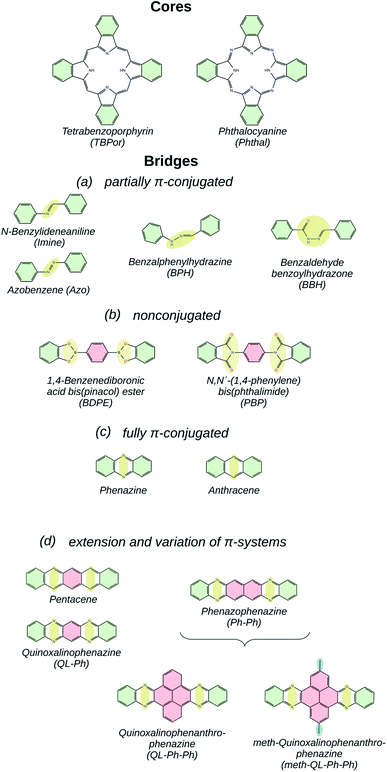
At the same time, high-throughput calculations of potential COFs generate large amounts of data,40 which have to be screened and categorized in order to be of practical value. In this context, the question of similarity is of particular interest: how can one determine if two COFs can be considered similar with respect to a certain target application? For (opto)electronic devices, the electronic band-structure certainly plays a decisive role, and quantities like the band-gap and the effective masses are used as key indicators.46 Since in computational studies one typically has access to the whole band-structure, we introduce in the current study a similarity measure based on the energetic difference between bands of two different COFs. With high accuracy, we are able to classify the COFs built from the core and bridge molecules shown in Fig. 1 according to the degree of conjugation in the latter building blocks. In the figure, the name of the bridge molecules is given under each structure, and the areas highlighted in yellow and red indicate the linkage and the linker, respectively. In order to avoid the ambiguity of splitting a framework into core and bridge, we consider the benzene rings highlighted in green as part of both building-blocks. The resulting COFs are denoted as core-bridge-COF. Specifically, the core molecules are metal-free tetrabenzoporphyrin (TBPor) and phthalocyanine (Phthal). Due to the chemistry of the linkages, all the considered COF crystals feature a simple square lattice topology.
The choice of the bridges is motivated by the goal of understanding the influence of the linkage and linker geometry on the π-electron conjugation of the COFs and their electronic structure.47 Fig. 1(a) shows partially π-conjugated bridge molecules. N-Benzylideneaniline (Imine)- and Azobenzene (Azo)48-linkaged COFs connect the two cores with C–N and N–N double bonds, respectively. Benzalphenylhydrazine (BPH) and benzaldehyde benzoylhydrazone (BBH) include a linear chain of carbon and nitrogen atoms. 1,4-Benzenediboronic acid bis(pinacol) ester (BDPE) and N,N′-(1,4-phenylene) bis(phthalimide) (PBP),49 which are classified as nonconjugated bridge molecules and are shown in Fig. 1(b), consist of functionalized pyrroles connected via a phenyl. The fully π-conjugated bridges are anthracene50 and phenazine (see Fig. 1(c)), which are made up of fused rings, which increase the aromaticity. Fig. 1(d) shows extensions and variations of π-systems, which have been chosen to specifically gauge the effect of reduced aromaticity on the electronic properties. In this category, functionalized pyrene with methyl group linker51,52 (meth–QL–Ph–Ph in Fig. 1(d)) has been included in order to understand the effect of side chains in the linker for the electronic band structure.
The manuscript is structured as follows. In Section 2 the computational methods are summarized. There, we present the approach for the effective mass calculation and the details for the similarity matrix calculation. In Section 3 we present and discuss the results of our study: similarity matrix classification for selected bridges and the electronic band-structures of the bridges as they are classified in Fig. 1(a)–(e). A summary and conclusions are given in Section 4.
2 Computational details
In this work, we mainly use a Density Functional based Tight Binding (DFTB) method to compute the electronic properties of various COFs. The DFTB method is much faster than ab initio and Density Functional Theory (DFT) approaches and is, therefore, particularly attractive in applications to large systems as well as for extensive sampling of the configuration space. The calculations were performed using the self-consistent charge extension (SCC) of DFTB53,54 implemented in dftb+ with the Slater–Koster set of matsci-0-3.55 For all of the calculations, periodic boundary conditions were used. The single layers were optimized using the SCC method with 30 Å distance between the layers. The sampling of the Brillouin zone was implemented with (7, 7, 1) k-points according to Monkhorst and Pack.56In some selected cases, we have carried out benchmark calculations based on full DFT as implemented in the VASP package,57 and using the GGA-PBE level for the exchange-correlation functional.58 Single point calculations with hybrid functionals were also employed. Additionally, the influence of the parametrization of the matrix elements on the electronic band-structure has been studied by using two additional Slater–Koster sets: 3ob-3-1 and mio-1-159 and ob2-1-160 (see Fig. S1 in ESI†).
2.1 Effective mass calculation
For systems with parabolic Highest Occupied Crystal Orbital (HOCO) and Lowest Unoccupied Crystal Orbital (LUCO) bands, the hole and electron effective masses, and
and  , are determined from the top of the HOCO and the bottom of the LUCO band, respectively, following the usual expression:
 | (1) |
This equation implies that for bands with large curvature the effective mass is small and the charge carrier mobility can be expected to be high. On the other hand, flat conduction and/or valence bands formally lead to infinite effective masses. For these cases, charge carriers are largely localized and their mobility cannot be defined in general in terms of the band structure exclusively. The concept of band transport thus breaks down in this situation and alternative charge transport mechanisms, such as thermally activated transport61 or polaron hopping,62 play a dominant role.
2.2 Definition of a similarity matrix
In order to determine the similarity of two COFs, we rely on a comparison of their respective band-structures. More specifically, we compute the differences of the conduction (ν = LUCO) and valence (ν = HOCO) bands for each k-point and calculate the mean square deviation for two COFs x = A, B as follows:
 | (2) |
Here,  is the average value (over the k points) of the band energies in band ν for COF A/B, calculated as:
 | (3) |
The energy difference given by eqn (2) is then converted to a measure of similarity via an exponential function:
 | (4) |
This similarity measure gives values between 0 (completely different) and 1 (identical). The arbitrary constant E0 introduces an energy scale which allows tuning the coarseness of the similarity, i.e. which energy differences are still considered as similar. Here, we use with T being equal to room temperature.
It should be noted that there are many possible choices for the difference of the band energies  and also for the similarity measure sA,B. Depending on those choices, the similarity can be sensitive or insensitive to certain features of the bands. For example, our choice yields a similarity of sA,B = 1 for all pairs of COFs with completely flat conduction and valence bands.
3 Results and discussion
For all the bridge molecules, the electronic band-structure of both molecular cores has been calculated as described in Sec. 2. A summary of the results for the electronic band-gaps and the effective masses can be found in Table 1.| Bridge | TBPor | Phthal | ||||
|---|---|---|---|---|---|---|
| Gap (eV) | Eff. mass(×me) | Gap (eV) | Eff. mass(×me) | |||
| Electrons | Holes | Electrons | Holes | |||
| Imine | 1.26 | — | −0.60 | 0.97 | — | −0.64 |
| Azo | 0.87 | 6.57 | −0.33 | 0.65 | 6.50 | −0.34 |
| BPH | 1.15 | 1.13 | −0.42 | 0.85 | 1.35 | −0.43 |
| BBH | 1.60 | 7.52 | −2.52 | 1.27 | 7.65 | −2.55 |
| PBP | 1.52 | — | — | 1.21 | — | — |
| BDPE | 1.65 | — | — | 1.33 | — | — |
| Anthracene | 0.81 | 0.38 | −0.19 | 0.62 | 0.34 | −0.18 |
| Phenazine | 0.66 | 1.23 | −0.25 | 0.55 | 0.73 | −0.25 |
3.1 Similarity matrix classification
Before discussing the features of the band structures for each degree of conjugation, we use the similarity matrix to obtain a classification of the different COFs based on their electronic band structures. Fig. 2(a) shows the similarity matrix for the Phthal-based COFs with the bridges of Fig. 1(a)–(c). One can see that the similarity matrix correctly classifies the selected structures with respect to the degree of conjugation indicated in Fig. 1. The only exception is the Phthal-BBH-COF which is falsely classified from the similarity matrix as non-conjugated. As will be shown later, the reason for this deviation is the presence of rather flat bands. Maybe surprisingly, phenazine and anthracene-based COFs are found to have a relatively low similarity (∼0.21). However, the comparison of the effective masses of the two COFs shows that the electrons in phenazine-based COFs are heavier by a factor of 2 (Phthal) and 3 (TBPor). The respective conduction bands are thus flatter compared to the ones of the anthracene-based COFs, which leads to the observed low similarity. Nevertheless, the mutual similarity of phenazine and anthracene is much higher than the similarity with any other COF under investigation. In the supplement, Fig. S4(a)† shows the similarity for the bridges of Fig. 1(a)–(c) for different values of E0 and in Fig. S2(b)† we also include one band below and above the valence and the conduction band, respectively, in the expression given in eqn (2). One can see that the concept of the similarity matrix is robust.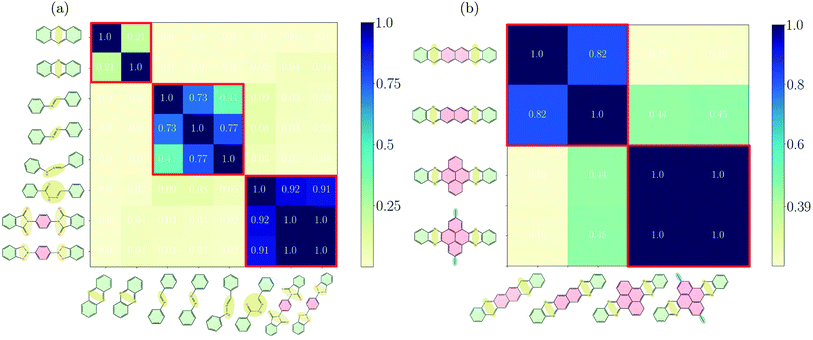 | ||
| Fig. 2 Similarity matrix sA,B as given by eqn (4) for Phthal-based COFs with bridges that (a) have been identified as fully-, partially- and non-conjugated, (b) for hexacene, Ph–Ph, QL–Ph–Ph and meth–QL–Ph–Ph. The colorbar indicates the degree of similarity, ranging from 0 (not similar) to 1 (identical). | ||
Fig. 2(b) shows the similarity matrix for selected structures of the extended π-conjugated and varied COFs as shown in Fig. 1(d) and (e). Interestingly, the similarity measure is able to distinguish between the two categories quite well.
3.2 Partially π-conjugated COFs
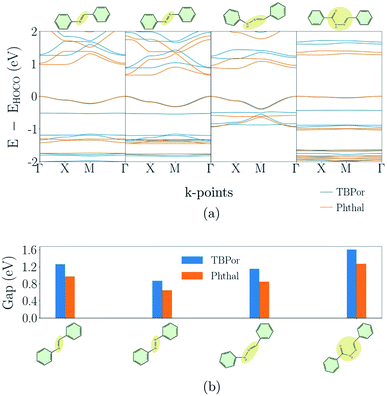
Fig. 3(a) shows the electronic band-structures for the COFs with bridges as depicted in Fig. 1(a). Each line color corresponds to a different molecular core, the blue one to TBPor and the orange one to Phthal-based COFs. In the following comparison, we first focus on the different bridges for Phthal-based COFs and later we extend the discussion to the other core.Imine- and Azo–COFs have two similar structures with the linkage being the main difference. For the latter, the Azo bond leads to a better band dispersion, which is confirmed by the effective mass calculation: the hole effective mass for Phthal–Azo–COF is lower than the one for Phthal–Imine–COF, 0.34me and 0.64me respectively. Compared to imine, in the BPH–COF, an additional secondary group (NH) is present in the linkage. This group is connected via single bonds to one of the phenyl rings and to the other nitrogen atom. In the BBH–COF a carbonyl group (C![[double bond, length as m-dash]](https://www.rsc.org/images/entities/char_e001.gif) O) is present and one additional single bond is formed. The existence of single bonds is a repressive factor for electron delocalization. They impose fewer constraints on conformational degrees of freedom and, therefore, increase the probability for out-of-plane configurations. Correspondingly, we find that almost all of the atoms of BPH–COF lie in a plane, except the N–NH bond which is slightly pushing the neighboring atoms outwards. Similarly, in BBH-COFs all the atoms in the chain lie out of the plane. The geometry of these linkages leads to a tilt angle between neighboring pz-orbitals. This structural feature is reflected in the electronic band-structure leading, for example, to a reduction of the band dispersion with increasing tilt angle.46 The resulting nearly flat conduction and valence bands are the reason why the BBH–COF is classified as non-conjugated by the similarity matrix.
O) is present and one additional single bond is formed. The existence of single bonds is a repressive factor for electron delocalization. They impose fewer constraints on conformational degrees of freedom and, therefore, increase the probability for out-of-plane configurations. Correspondingly, we find that almost all of the atoms of BPH–COF lie in a plane, except the N–NH bond which is slightly pushing the neighboring atoms outwards. Similarly, in BBH-COFs all the atoms in the chain lie out of the plane. The geometry of these linkages leads to a tilt angle between neighboring pz-orbitals. This structural feature is reflected in the electronic band-structure leading, for example, to a reduction of the band dispersion with increasing tilt angle.46 The resulting nearly flat conduction and valence bands are the reason why the BBH–COF is classified as non-conjugated by the similarity matrix.
The change of the molecular core from TBPor to Phthal leads to structures with essentially the same shape. However, the electronic band structure is influenced by the modification. Comparing the band dispersion for the different cores (blue vs. orange line) in Fig. 3(a), one can see that the bands are similar in shape but are energetically shifted. This shift is a result of the substitution of some of the carbon atoms by nitrogen in the molecular core. The substituted atoms lead to n-doping which causes the observed shift. 63 The calculations of the effective masses for the different cores, as summarized in Table 1, lead to very close values, so the change of the molecular core is almost irrelevant for the charge carriers. Fig. 3(b) shows the comparison of the electronic band-gap for the specific bridges and the two different cores. For all bridges the energy difference between the two cores is ∼0.21–0.33 eV (cf. Table 1). Note, that the HOMO–LUMO energy difference between TBPor and Phthal as isolated molecules is found to be 0.24 eV when using DFTB/matsci-0-3. It is clear that the HOMO–LUMO differences of the cores transfer into electronic band-gap differences of the COFs.
3.3 Nonconjugated COFs
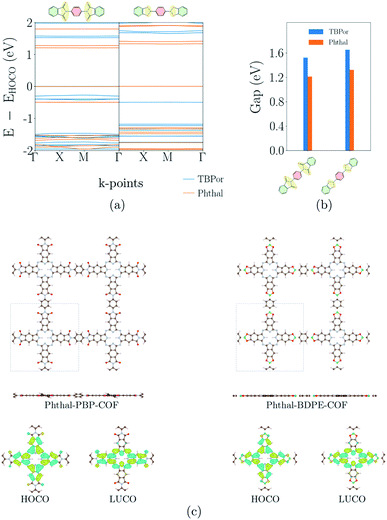
Fig. 4(a) shows the electronic band-structures of COFs with the bridges depicted in Fig. 1(b). The bands are flat for both cases independent of the molecular core. Consequently, as previously remarked, the nonconjugated COFs were assigned in this case a high similarity score. The σ-bonds in the succinimide moiety of the bridge are leading to electron localization on the core. Fig. 4(b) shows the comparison of the electronic band-gap for the specific bridges and the two different cores. As already mentioned above, the HOMO–LUMO difference of the core molecule largely determines the band-gap of the respective COFs. Comparing the two cores for these bridges, it is therefore clear that TBPor-based COFs lead to larger electronic band-gaps than Phthal-based COFs. The values are listed in Table 1 and the difference between the band-gaps of COFs with two different cores is found to be ∼0.3 eV. Fig. 4(c) shows the structures of two COFs with PBP and BDPE bridges, respectively, with the respective charge distribution of the HOCO and LUCO overlaid. For both structures this shows that the electron localization is on the molecular core. To further investigate the nonconjugated COFs, we changed the length of the bridge. Firstly, we added and subtracted phenyls in the linker for both molecular cores, and secondly we added fused rings at Phthal such that this extended core can be assumed as a phthalocyanine derivative, tetrad-Phthal. We find that if there is no phenyl in the linker, the COF gap depends on the molecular core (for TBPor 1.65 eV, for Phthal 1.33 eV and for tetrad-Phthal 1.19 eV) and by changing the number of phenyls in the linker for all different cores the electronic gap remains the same as without any phenyl, which is to be expected since the wave functions are mainly localized on the core and the linker, respectively, and are thus electronically decoupled. The comparison of the electronic band-gap for the three different cores and the different number of phenyls in the linker is shown in Fig. S3 in the ESI†.3.4 Fully π-conjugated COFs
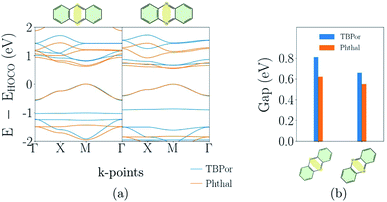
Finally, the electronic band-structures for the bridges depicted in Fig. 1(c) which were classified as fully conjugated are shown in Fig. 5(a). The whole atomic structure for all four COFs in this category lies in one plane. One can see that the dispersion remains basically the same for all COFs, although the conduction band of TBPor-based COFs shifts to higher energies compared to the one of the Phthal-based COFs as discussed above. The effective masses of the charge carriers indicate more delocalization in anthracene than in phenazine-based COFs (see Table 1). Fig. 5(b) shows the comparison of the electronic band-gap for the specific bridges and the two different cores. Comparing the two bridges, anthracene-based COFs have a larger band-gap than phenazine-based COFs. On the other hand, for the same bridge but different cores, the band-gap difference is ∼0.1–0.2 eV. The HOMO–LUMO difference between porphyrin and porphyrazine is 0.1 eV using DFTB/matsci-0-3. The difference of the band-gap energies can thus again be attributed to the electronic structure of the core molecules.3.5 Extension and variation of π-systems
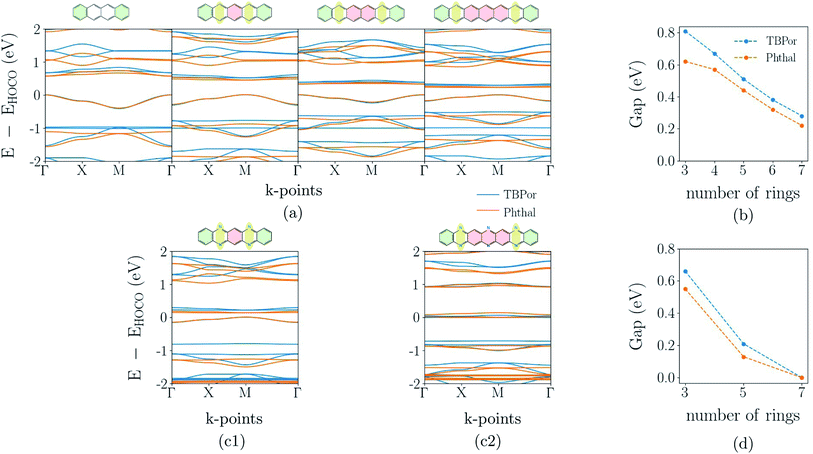
The band-structure calculations for the fully π-conjugated COFs show that these systems are promising candidates for electronic applications. Keeping the conjugation, we consider different numbers of phenyl rings in the linkers shown in Fig. 1(c). The resulting extended bridges for anthracene are tetracene, pentacene, hexacene and heptacene, and for phenazine they are quinoxalino–phenazine (QL–Ph) and diquinoxalino–phenazine (DQL–Ph). For the latter cases, the phenyl rings were added such that the symmetry class of the bridge remains C2.Fig. 6(a) shows the electronic band-structures for tetracene, pentacene, hexacene and heptacene-based COFs, in which the different line colors correspond to the different cores. The respective bridge is shown on the top of each plot. As one can see, the band dispersion remains the same independently of the core. Moreover, while rings are added in the bridge, the band-gap point is alternating between Γ- and M-point of the Brillouin zone. A similar alternation has been observed before and can be understood in terms of a change of the phase of hopping matrix elements within a tight-binding description.64 Fig. 6(b) shows the change of the electronic band-gap as the number of rings in the bridge increases. As before, TBPor-based COFs maintain a larger electronic band-gap compared to the respective structures based on Phthal.
Fig. 6(c1) and (c2) show the electronic band-structure for QL–Ph and DQL–Ph COFs. The number of rings in the bridge is always odd and the band-gap is, in all cases, found at the M-point of the Brillouin zone. Fig. 6(d) shows the change of the electronic band-gap as the number of rings in the bridge increases. Again, TBPor-based COFs have the larger electronic band-gap compared to the respective structures of Phthal. Interestingly, DQL–Ph COFs lead to a vanishing band-gap already for seven rings, which means that we started from a semiconductor (Ph-based) and ended up with a semi-metal (DQL–Ph-based).
Part of the variation of π-systems are bridges such as phenazo–phenazine (Ph–Ph), as shown in Fig. 1(d), and an extended bridge (An–DP). The electronic band-structures of Phthal–Ph–Ph–COF and Phthal–An–DP–COF are shown in the first two plots of Fig. 7(a) and (b), respectively, starting from the left. The electronic band-gap is estimated to be 90 meV and 10 meV respectively, indicating the metallic character of the materials. Compared to the result mentioned in the previous subsection, the Phthal–hexacene–COF shows a band-gap of 320 meV. Apparently, the positions of the nitrogen atoms in the fused rings alongside the bridge lead to smaller electronic band-gap values.
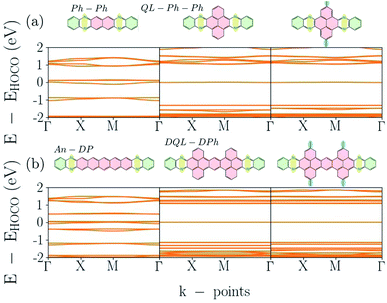 | ||
| Fig. 7 Electronic band-structures for Phthal-based COFs. From left to right (a) Ph–Ph, QL–Ph and meth–QL–Ph; (b) An–DP, DQL–DPh and meth–DQL–DPh. | ||
However, adding fused rings in the linker can also lead to semiconducting materials with flat band dispersion. In the case that the bridge changes from Ph–Ph to QL–Ph–Ph where the geometry of the linker alters from naphthalene to pyrene, a less aromatic molecule, the electronic band-structure changes drastically. The structure of the respective bridge is located on the top of the middle graph in Fig. 7(a). The electronic band-gap increases from 90 meV in Ph–Ph to 1020 meV in QL–Ph COF, and the flat conduction and valence bands forebodes electron localization. Fig. S4 in the ESI† shows the orbitals of these levels.
In order to understand the effect of adding side chains in the linker, we add a methyl group on top and at the bottom of the pyrene in QL–Ph COF. The right graph in Fig. 7(a) shows the electronic band-structure of the corresponding structure, which is shown on the top. Compared to QL–Ph, there is no effect. Electronic band-gap and band dispersion remain as in QL–Ph–Ph. The same process was followed for An–DP COF; the first two plots in Fig. 7(b) show the electronic band-structures (bottom) and the structural change (top) from An–DP to DQL–DPh. The latter COF has the same band-gap as the QL–Ph COF. The additional methyl group on top and bottom of the two pyrenes in the linker are not making any difference for the band-structure compared to the DQL–DPh COF.
4 Summary and conclusions
In summary, we investigated different ways to engineer the electronic properties of different 2D COFs using electronic band-structure calculations based on DFTB. The investigated COFs with square lattice topology are based on metal-free tetrabenzoporphyrin or phthalocyanine as cores and have different bridges, which were chosen according to their π-electron conjugation.To establish a classification of the bridges, the concept of similarity based on the difference of two electronic band-structures was introduced and the similarity matrix for pairs of COFs was computed. This matrix shows that the electronic band-structure allows to categorize the COFs according to their degree of π-electron conjugation of their bridges.
The partially conjugated COFs have a linear chain of carbon and/or nitrogen atoms in the linkage. As the chain becomes longer including single bonds between carbon atoms, the electron delocalization becomes more difficult. For the non-conjugated COFs, the bands are totally flat. On the other hand, the fully π-conjugated systems have a smaller band-gap compared to the rest. Independently of conjugation, changing the molecular core from Phthal to TBPor leads to COFs with higher electronic band-gap, consistent with the difference in HOMO–LUMO energy difference of the cores as isolated molecules. Additionally, the effect of functionalization was studied for specific extended fully π-conjugated systems. The transition from Phthal–Ph–Ph–COF to Phthal–QL–Ph–Ph–COF creates an electronic band-gap difference ∼1.1 eV, while the functionalization by adding a side chain does not make any difference to the electronic band-gap. The same applies for a change from Phthal–An–DP–COF to Phthal–DQL–DPh–COF.
We believe that our theoretical work provides a strategical conceptualization for the manipulation of the electronic properties of fully π-conjugated COF-monolayers.
Author contributions
Antonios Raptakis: investigation, methodology, conceptualization, visualization, writing – original draft, writing – review & editing. Alexander Croy: supervision, methodology, writing – review & editing. Arezoo Dianat: supervision, methodology, writing – review & editing. Rafael Gutierrez: supervision, methodology, writing – review & editing. Gianaurelio Cuniberti: funding acquisition, supervision, writing – review & editing.Conflicts of interest
There are no conflicts to declare.Acknowledgements
A. R. thanks the International Max Planck Research School “Many Particle Systems in Structured Environment” and the Chair of Materials Science and Nanotechnology in the Faculty of Mechanical Engineering of TU Dresden for financial support; A. Ciesielski and L. Cusin for the proposed linker molecules; M. Sgarzi and D. Pastoetter for the helpful discussions. This project has received funding from the European Union's Horizon 2020 research and innovation programme under the Marie Skłodowska-Curie grant agreement No. 813036 and DFG funding (CRC1415, No. 417590517). We also acknowledge the Center for Information Services and High Performance Computing (ZIH) at TU Dresden for computational resources.Notes and references
- X. Li, P. Yadav and K. P. Loh, Chem. Soc. Rev., 2020, 49, 4835–4866 RSC
.
- D. Rodríguez-San-Miguel, C. Montoro and F. Zamora, Chem. Soc. Rev., 2020, 49, 2291–2302 RSC
.
- J. W. Colson and W. R. Dichtel, Nat. Chem., 2013, 5, 453–465 CrossRef CAS
.
- C. S. Diercks and O. M. Yaghi, Science, 2017, 355, eaal1585 CrossRef PubMed
.
- S. Kim and H. C. Choi, ACS Omega, 2020, 5, 948–958 CrossRef CAS PubMed
.
- S.-Y. Ding and W. Wang, Chem. Soc. Rev., 2013, 42, 548–568 RSC
.
- H. Peng, J. Raya, F. Richard, W. Baaziz, O. Ersen, A. Ciesielski and P. Samorì, Angew. Chem., Int. Ed., 2020, 59, 2–10 CrossRef
.
- M. Wang, H. Guo, R. Xue, Q. Li, H. Liu, N. Wu, W. Yao and W. Yang, ChemElectroChem, 2019, 6, 2984–2997 CrossRef CAS
.
- A. K. Mandal, J. Mahmood and J.-B. Baek, ChemNanoMat, 2017, 3, 373–391 CrossRef CAS
.
- M. Wang, M. Ballabio, M. Wang, H.-H. Lin, B. P. Biswal, X. Han, S. Paasch, E. Brunner, P. Liu, M. Chen, M. Bonn, T. Heine, S. Zhou, E. Cánovas, R. Dong and X. Feng, J. Am. Chem. Soc., 2019, 141, 16810–16816 CrossRef CAS PubMed
.
- X. Feng, L. Liu, Y. Honsho, A. Saeki, S. Seki, S. Irle, Y. Dong, A. Nagai and D. Jiang, Angew. Chem., Int. Ed., 2012, 51, 2618–2622 CrossRef CAS PubMed
.
- F. Xu, S. Yang, X. Chen, Q. Liu, H. Li, H. Wang, B. Wei and D. Jiang, Chem. Sci., 2019, 10, 6001–6006 RSC
.
- Z. Li, X. Feng, Y. Zou, Y. Zhang, H. Xia, X. Liu and Y. Mu, Chem. Commun., 2014, 50, 13825–13828 RSC
.
- M. G. Rabbani, A. K. Sekizkardes, Z. Kahveci, T. E. Reich, R. Ding and H. M. El-Kaderi, Chem. - Eur. J., 2013, 19, 3324–3328 CrossRef CAS PubMed
.
- Z. Li, X. Feng, Y. Zou, Y. Zhang, H. Xia, X. Liu and Y. Mu, Chem. Commun., 2014, 50, 13825–13828 RSC
.
- X. Liu, D. Huang, C. Lai, G. Zeng, L. Qin, H. Wang, H. Yi, B. Li, S. Liu, M. Zhang, R. Deng, Y. Fu, L. Li, W. Xue and S. Chen, Chem. Soc. Rev., 2019, 48, 5266–5302 RSC
.
- L. Ascherl, E. W. Evans, J. Gorman, S. Orsborne, D. Bessinger, T. Bein, R. H. Friend and F. Auras, J. Am. Chem. Soc., 2019, 141, 15693–15699 CrossRef CAS
.
- S. Y. Ding, J. Gao, Q. Wang, Y. Zhang, W. G. Song, C. Y. Su and W. Wang, J. Am. Chem. Soc., 2011, 133, 19816–19822 CrossRef CAS PubMed
.
- S. Lin, C. S. Diercks, Y. B. Zhang, N. Kornienko, E. M. Nichols, Y. Zhao, A. R. Paris, D. Kim, P. Yang, O. M. Yaghi and C. J. Chang, Science, 2015, 349, 1208–1213 CrossRef CAS PubMed
.
- H. Hu, Q. Yan, R. Ge and Y. Gao, Chin. J. Catal., 2018, 39, 1167–1179 CrossRef CAS
.
- C. Chen, T. Joshi, H. Li, A. D. Chavez, Z. Pedramrazi, P.-N. Liu, H. Li, W. R. Dichtel, J.-L. Bredas and M. F. Crommie, ACS Nano, 2018, 12, 385–391 CrossRef CAS PubMed
.
- D. N. Bunck and W. R. Dichtel, J. Am. Chem. Soc., 2013, 135, 14952–14955 CrossRef CAS PubMed
.
- G. Das, B. P. Biswal, S. Kandambeth, V. Venkatesh, G. Kaur, M. Addicoat, T. Heine, S. Verma and R. Banerjee, Chem. Sci., 2015, 6, 3931–3939 RSC
.
- G. Li, K. Zhang and T. Tsuru, ACS Appl. Mater. Interfaces, 2017, 9, 8433–8436 CrossRef CAS
.
- C. Zhang, S. Zhang, Y. Yan, F. Xia, A. Huang and Y. Xian, ACS Appl. Mater. Interfaces, 2017, 9, 13415–13421 CrossRef CAS PubMed
.
- S. Wang, Q. Wang, P. Shao, Y. Han, X. Gao, L. Ma, S. Yuan, X. Ma, J. Zhou, X. Feng and B. Wang, J. Am. Chem. Soc., 2017, 139, 4258–4261 CrossRef CAS PubMed
.
- S. Chandra, S. Kandambeth, B. P. Biswal, B. Lukose, S. M. Kunjir, M. Chaudhary, R. Babarao, T. Heine and R. Banerjee, J. Am. Chem. Soc., 2013, 135, 17853–17861 CrossRef CAS
.
- N. A. A. Zwaneveld, R. Pawlak, M. Abel, D. Catalin, D. Gigmes, D. Bertin and L. Porte, J. Am. Chem. Soc., 2008, 130, 6678–6679 CrossRef CAS
.
- J. F. Dienstmaier, A. M. Gigler, A. J. Goetz, P. Knochel, T. Bein, A. Lyapin, S. Reichlmaier, W. M. Heckl and M. Lackinger, ACS Nano, 2011, 5, 9737–9745 CrossRef CAS PubMed
.
- A. Ortega-Guerrero, H. Sahabudeen, A. Croy, A. Dianat, R. Dong, X. Feng and G. Cuniberti, ACS Appl. Mater. Interfaces, 2021, 13, 26411–26420 CrossRef CAS PubMed
.
- H. Sahabudeen, H. Qi, B. A. Glatz, D. Tranca, R. Dong, Y. Hou, T. Zhang, C. Kuttner, T. Lehnert, G. Seifert, U. Kaiser, A. Fery, Z. Zheng and X. Feng, Nat. Commun., 2016, 7, 13461 CrossRef CAS PubMed
.
- W. Dai, F. Shao, J. Szczerbiński, R. McCaffrey, R. Zenobi, Y. Jin, A. D. Schlüter and W. Zhang, Angew. Chem., Int. Ed., 2016, 55, 213–217 CrossRef CAS PubMed
.
- R. Dong, T. Zhang and X. Feng, Chem. Rev., 2018, 118, 6189–6235 CrossRef CAS PubMed
.
- F. Shao, W. Dai, Y. Zhang, W. Zhang, A. D. Schlüter and R. Zenobi, ACS Nano, 2018, 12, 5021–5029 CrossRef CAS PubMed
.
- T. Zhang, H. Qi, Z. Liao, Y. D. Horev, L. A. Panes-Ruiz, P. S. Petkov, Z. Zhang, R. Shivhare, P. Zhang, K. Liu, V. Bezugly, S. Liu, Z. Zheng, S. Mannsfeld, T. Heine, G. Cuniberti, H. Haick, E. Zschech, U. Kaiser, R. Dong and X. Feng, Nat. Commun., 2019, 10, 1–9 CrossRef
.
- K. Liu, H. Qi, R. Dong, R. Shivhare, M. Addicoat, T. Zhang, H. Sahabudeen, T. Heine, S. Mannsfeld, U. Kaiser, Z. Zheng and X. Feng, Nat. Chem., 2019, 11, 994–1000 CrossRef CAS PubMed
.
- S. Keskin, J. Phys. Chem. C, 2012, 116, 1772–1779 CrossRef CAS
.
- M. Suri, M. Dornfeld and E. Ganz, J. Chem. Phys., 2009, 131, 174703 CrossRef PubMed
.
- A. Sharma, A. Malani, N. V. Medhekar and R. Babarao, CrystEngComm, 2017, 19, 6950–6963 RSC
.
- R. Mercado, R.-S. Fu, A. V. Yakutovich, L. Talirz, M. Haranczyk and B. Smit, Chem. Mater., 2018, 30, 5069–5086 CrossRef CAS
.
- Y. Wan, L. Wang, H. Xu, X. Wu and J. Yang, J. Am. Chem. Soc., 2020, 142, 4508–4516 CrossRef CAS PubMed
.
- D. Ongari, A. V. Yakutovich, L. Talirz and B. Smit, ACS Cent. Sci., 2019, 5, 1663–1675 CrossRef CAS PubMed
.
- K. S. Deeg, D. Damasceno Borges, D. Ongari, N. Rampal, L. Talirz, A. V. Yakutovich, J. M. Huck and B. Smit, ACS Appl. Mater. Interfaces, 2020, 12, 21559–21568 CrossRef CAS PubMed
.
- H. Hashemzadeh and H. Raissi, J. Phys. D: Appl. Phys., 2018, 51, 345401 CrossRef
.
- A. Raptakis, A. Dianat, A. Croy and G. Cuniberti, Nanoscale, 2021, 13, 1077–1085 RSC
.
- R. Gutzler, Phys. Chem. Chem. Phys., 2016, 18, 29092–29100 RSC
.
- X. Chen, K. Geng, R. Liu, K. T. Tan, Y. Gong, Z. Li, S. Tao, Q. Jiang and D. Jiang, Angew. Chem., Int. Ed., 2020, 59, 5050–5091 CrossRef CAS PubMed
.
- B. Nath, W.-H. Li, J.-H. Huang, G.-E. Wang, Z.-h. Fu, M.-S. Yao and G. Xu, CrystEngComm, 2016, 18, 4259–4263 RSC
.
- J. Maschita, T. Banerjee, G. Savasci, F. Haase, C. Ochsenfeld and B. V. Lotsch, Angew. Chem., Int. Ed., 2020, 59, 15750–15758 CrossRef CAS PubMed
.
- H. Q. Pham, D. Q. Le, N.-N. Pham-Tran, Y. Kawazoe and D. Nguyen-Manh, RSC Adv., 2019, 9, 29440–29447 RSC
.
- J. Dong, Y. Liu and Y. Cui, J. Am. Chem. Soc., 2021, 143, 17316–17336 CrossRef CAS PubMed
.
- F. Haase and B. V. Lotsch, Chem. Soc. Rev., 2020, 49, 8469–8500 RSC
.
- M. Elstner, D. Porezag, G. Jungnickel, J. Elsner, M. Haugk, T. Frauenheim, S. Suhai and G. Seifert, Phys. Rev. B: Condens. Matter Mater. Phys., 1998, 58, 7260–7268 CrossRef CAS
.
- M. Elstner, J. Phys. Chem. A, 2007, 111, 5614–5621 CrossRef CAS PubMed
.
- B. Lukose, A. Kuc, J. Frenzel and T. Heine, Beilstein J. Nanotechnol., 2010, 1, 3762 Search PubMed
.
- H. J. Monkhorst and J. D. Pack, Phys. Rev. B: Solid State, 1976, 13, 5188–5192 CrossRef
.
- https://www.vasp.at/.
- J. P. Perdew, K. Burke and M. Ernzerhof, Phys. Rev. Lett., 1996, 77, 3865–3868 CrossRef CAS PubMed
.
- M. Gaus, A. Goez and M. Elstner, J. Chem. Theory Comput., 2013, 9, 338–354 CrossRef CAS PubMed
.
- V. Q. Vuong, J. Akkarapattiakal Kuriappan, M. Kubillus, J. J. Kranz, T. Mast, T. A. Niehaus, S. Irle and M. Elstner, J. Chem. Theory Comput., 2018, 14, 115–125 CrossRef CAS PubMed
.
- T. J. Slade, J. A. Grovogui, J. J. Kuo, S. Anand, T. P. Bailey, M. Wood, C. Uher, G. J. Snyder, V. P. Dravid and M. G. Kanatzidis, Energy Environ. Sci., 2020, 13, 1509–1518 RSC
.
- J. H. Bombile, S. Shetty, M. J. Janik and S. T. Milner, Phys. Chem. Chem. Phys., 2020, 22, 4032–4042 RSC
.
- C. Bronner, S. Stremlau, M. Gille, F. Brauße, A. Haase, S. Hecht and P. Tegeder, Angew. Chem., Int. Ed., 2013, 52, 4422–4425 CrossRef CAS PubMed
.
- P. Tipirneni, V. Jindal, M. J. Janik and S. T. Milner, Phys. Chem. Chem. Phys., 2020, 22, 19659–19671 RSC
.
Footnote |
| † Electronic supplementary information (ESI) available: it includes additional band structure analysis and the cif data. See https://doi.org/10.1039/d2ra01007k |
| This journal is © The Royal Society of Chemistry 2022 |

