 Open Access Article
Highly crystallized glass-ceramics from high content gold tailings via a one-step direct cooling method†
Ke Jiang,
Wei Wu,
Boyong Ren,
Meng Li,
Jiaxing He,
Enze Xu,
Junwu Liu,
Guoqing Tong ,
Honghai Zhong* and
Yang Jiang
 *
*
School of Materials Science and Engineering, Hefei University of Technology, Hefei 230009, China. E-mail: apjiang@hfut.edu.cn; zhonghhustc@hfut.edu.cn
First published on 11th May 2022
Abstract
Highly crystalline glass-ceramics were successfully manufactured via a one-step direct cooling method using Shuangqishan (Fujian, China) gold tailings as raw materials. A series of glass-ceramics were prepared by controlling the gold tailings addition and post-treatment. X-ray diffraction results show that the crystalline phase of glass-ceramics samples with high tailing addition content (65–80 wt%) is akermanite phase (Ca2MgSi2O7). By contrast, the main phase of 60 wt% and 55 wt% tailings addition samples is diopside (CaMgSi2O6) crystalline phase. In addition, although glass-ceramics have typical fracture characteristics of brittle materials, the crack propagation in the fracture process is disturbed by grains, resulting in the deviation of the fracture path in terms of macroscopic and microcosmic observation. Based on the investigation of samples with different tailings additions, glass-ceramics with 60 wt% tailings contents show excellent mechanical properties with a density of 2.89 g cm−3, a Vickers hardness value of 8.17 GPa, and a flexural strength of 116 MPa after 950 °C heat treatment. This study further confirms the possibility of using Shuangqi Mountain gold tailings as the raw materials for highly crystalline glass-ceramics, which shows great potential for application in mass production.
1. Introduction
The increasing of exploitation quantifiers of various ores has attracted more and more attention because of the development of metallurgy, chemical industry, and other mining industries.1 However, large amounts of the production of tailings and wastes originating from the smelting process of ores have been the critical issues. The less available components in the tailings and wastes will not only increase the cost of the further sorting, but also cause environmental pollution.2 Therefore, how to make full use of these tailings and wastes is imperative. Considering the fact that tailing ores are one of the raw materials for production, the low cost makes them more comparative compared to the conventional industrial minerals. Additionally, the tailing ores as the raw materials can also reduce the usage of synthetic chemicals, which is kind to the environment because of the non-radioactive and less toxic nature.3–5Recently, the glass-ceramics have attracted considerable attention and been widely used in the field of building materials, electric power, coal, and mining because of their excellent mechanical properties, corrosion resistance and wear resistance, etc.6,7 It is well known that the polycrystalline structure of glass-ceramics contains two kinds of phases of crystalline and glassy phases.6,8 These glass-ceramic materials are obtained by melt quenching and subsequent crystallization with proper post-treatment. Moreover, glass-ceramics are regarded as the candidates to replace the conventional natural stones in production, which can significantly reduce the over-exploitation of natural stones.
The constituents of tailings and wastes are mainly CaO, MgO, SiO2, Al2O3 and other inorganic oxides. In the preparation of certain glass-ceramic materials, we'd like to take advantage of the above components. According to the present studies, the CaO–Al2O3–SiO2 system and MgO–Al2O3–SiO2 system are regarded as the suitable systems for the preparation of tailings glass-ceramics.1 For example, Xu et al. developed a melt-integral crystallization method to produce the glass-ceramics using Bayan Obo tailings as raw materials. The resultant glass-ceramics exhibited an excellent flexural strength of 219 MPa.9 Similarly, Li and coworkers proposed to use the tungsten tailings as raw materials by the sintering crystallization technique to fabricate the glass-ceramics and realized high volume density (2.82 g cm−3), high Vickers hardness (6.3 GPa), and high bending strength (97.56 MPa).10 Although the tailings glass-ceramics exhibit outstanding physical and chemical properties compared to the other natural stones, high melting temperature, and complex fabrication procedures still impede the further improvement of glass-ceramics.
In this work, we demonstrated a strategy for preparation of glass-ceramics using the Shuangqi Mountain gold tailings (Fujian, China). The temperature range for the microcrystallization of glass-ceramics was determined by DSC curves, and the most optimal microcrystallization temperature was determined by investigating the XRD and SEM of the final samples. In particular, the fracture mechanism of the glass-ceramics was analyzed to understand the role of the crystals in the fracture process. By testing the properties of the final samples, the possibility of using the gold tailings from Shuangqi Mountain as a raw material for glass-ceramics was determined. Glass-ceramics with higher tailings additions also showed excellent properties.
2. Experimental procedure
2.1 Raw materials
The gold tailings were obtained from the Dehua Shuangqishan gold mine in Quanzhou, China. The chemical composition of the gold tailings was determined using an X-ray fluorescence spectrometer (XRF-1800). The corresponding results are summarized in Table 1. The gold tailings contain a large number of network-forming oxides (such as SiO2 and Al2O3). In addition, Na2O and K2O in the tailings can be used as a flux, and Fe2O3 can be incorporated as a nucleating agent. The tailings should be dried, then ground and passed through 200 mesh sieves to remove large particles and impurities.| Component | SiO2 | Al2O3 | CaO | MgO | Na2O | K2O | Fe2O3 | IL |
| Content (wt%) | 66.28 | 12.79 | 2.63 | 2.21 | 2.72 | 3.38 | 3.18 | 4.17 |
2.2 Composition of glass
In this work, the CaO–Al2O3–SiO2 system was used to add different percentages of gold tailings. The composition of basic glass can be determined according to the phase diagram of the CaO–Al2O3–SiO2 ternary system.11,12 The main components of CaO–Al2O3–SiO2 glass-ceramics are listed as follows: SiO2 45–60 wt%, Al2O3 5–15 wt%, and CaO 15–30 wt%. The auxiliary materials were introduced by chemical-grade drugs, except SiO2 that is introduced by quartz sand. Quartz sands were obtained from the Pengyuan Mineral powder plant in Hebei, China. The content of the silicon dioxide was above 99 wt%.2.3 Preparation of glass-ceramics
Firstly, the gold tailings and auxiliary materials were weighed according to Table 2. The tailings additions were 80 wt%, 75 wt%, 70 wt%, 65 wt%, 60 wt%, and 55 wt%, respectively (abbreviated as S1, S2, S3, S4, S5, and S6). Then, the tailings additions were fully ground in a mortar for at least two hours. The raw material was loaded into an alumina crucible that was placed in a muffle furnace. The temperature of the furnace was set from room temperature to 1450 °C, keeping at this temperature for 2 hours. Then, the temperature was cooled down to reach the proper temperature for heat treatment for another 2 hours.| S1 | S2 | S3 | S4 | S5 | S6 | |
|---|---|---|---|---|---|---|
| Gold tailings | 80 | 75 | 70 | 65 | 60 | 55 |
| SiO2 | 0 | 4 | 7 | 10 | 14 | 17 |
| Al2O3 | 0 | 1 | 1 | 2 | 3 | 3 |
| CaO | 15 | 16 | 16 | 16 | 16 | 16 |
| Li2O | 1 | 0 | 2 | 2 | 2 | 2 |
| ZnO | 0 | 0 | 0 | 1 | 1 | 3 |
| TiO2 | 2 | 2 | 2 | 2 | 2 | 2 |
| Cr2O3 | 2 | 2 | 2 | 2 | 2 | 2 |
2.4 Characterization
The basic glass sample selenium was crushed after drying, and ground into powder, and the sieved sample was tested by the differential heating method. DSC curves were obtained using a differential scanning calorimeter (STA449F3) at a heating rate of 10 °C min−1 from ambient temperature to 1100 °C under a nitrogen atmosphere, in which the reference material was Al2O3 powder. The XRD patterns of the glass-ceramics were obtained using a PANalytical X-Pert PRO MPD. The cross-sectional morphologies of the glass-ceramics were investigated using an SU8020 SEM, in which the samples were sprayed with gold.2.5 Physical performance tests
The density of the samples was measured using an analytical balance (AUY120) based on the Archimedes method. Vickers hardness experiments were conducted on a microhardness tester (HVS-1000) with a 100 g load and a loading time of 10 seconds. Flexural strength results were obtained using a microcomputer controlled-electronic universal testing machine (WDW-T20) in combination with the three-point method. The glass-ceramic samples were prepared as rectangular bars with a dimension of 4 mm × 4 mm × 30 mm.3. Results and discussion
3.1 DSC analyses
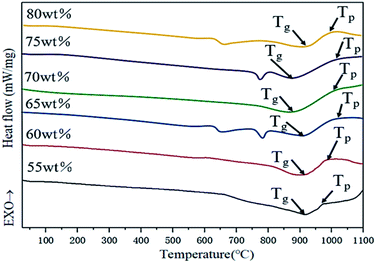
Glass-ceramics were prepared by a one-step direct cooling method in this work. Fig. 1 illustrates the different heat treatment methods of glass-ceramics. As shown in Fig. 1(a), the nucleation and crystal growth process were observed with the increase of temperatures. It is worth noting that the nucleation and crystal growth behaviors occur simultaneously in the overlapping regions. In this stage, the temperature of TNG is defined as the heat treatment. The one-step direct cooling method curve is displayed as seen in Fig. 1(b) which shows a slow cooling procedure of the molten glass from a relatively high temperature to the TNG temperature and maintains at this temperature for a predetermined time, which aims to accelerate the nucleation and crystal growth.13 In contrast, the conventional heat treatment (Fig. 1(c)) involves the reheating process to the Tg temperature (glass transition temperature) and the Tp temperature (peak-to-peak temperature of crystallization) for recrystallization. Additionally, one-step heat treatment Fig. 1(d) is usually reheating the matrix glass at the TNG temperature.14Fig. 2 shows the differential scanning calorimeter (DSC) curves of the base glasses. Several exothermic peaks can be found in the DSC curves of base glasses with S1, S2, S3, and S4, respectively, which indicates that different crystalline phases can be successfully precipitated at different heat treatment temperatures of glass-ceramics. It is worth noting that there is only an apparent exothermic peak in the differential thermal curves of the base glasses with S5 and S6 samples. The broad exothermic peak area at a temperature of 1000 °C indicates that only one crystalline phase or multiple crystalline phases are precipitated simultaneously during the heat treatment. According to the above analysis, the Tg and Tp of glass-ceramics were calibrated in the DSC curves as seen in Fig. 2.15 On the basis of DSC results, the heat treatment temperatures of 900 °C, 950 °C, and 1000 °C were used for the following experiments.
Traditional processes include fusing and sintering processes. The fusion method uses glass formation that enables the preparation of complex shapes. However, the melting temperature is too high and the product requires two sintering steps, which needs high costs. The sintering method reheats the glass particles after water quenching. Although the sintering temperature is low, melting the glass particles and crystallization also need to be done in two steps, so the energy consumption is high and the denseness of the product is low. Compared with the traditional process, the one-step direct cooling method just has one simple step, glass-ceramics is fired in one step, the firing temperature is low, and the physical heat of the glass solution can be used, which means low energy consumption. Glass-ceramics exhibit high density and good performance.
The crystallization of glass-ceramics in this work is mainly influenced by TiO2 and Cr2O3 as seen in Table S1 and Fig. S1.† TiO2 is one of the most commonly used oxide nucleating agents in glass-ceramics, in which the titanium ion shows two kinds of states at different temperatures. One is six-liganded state and the other one is four-liganded state. When the TiO2 is treated at a high temperature, the Ti4+ participates in the silica-oxygen network as a tetra-ligand and is miscible with the molten state glass. As the temperature decreases, the tetra-ligand will change to the hexa-ligand. It is worth noting that these two coordination structures show different structures, in which the TiO2 can be separated from the silicon-oxygen network with other RO types of oxides. These separated phases serve as the nucleation sites to prompt the glass microcrystallization. Cr2O3 as a nucleating agent precipitates in the form of spinel during the melt cooling to form small particles. As the base glass is heated to the nucleation temperature, it will provide an interface for non-uniform nucleation and accelerate nucleation.
3.2 XRD analyses
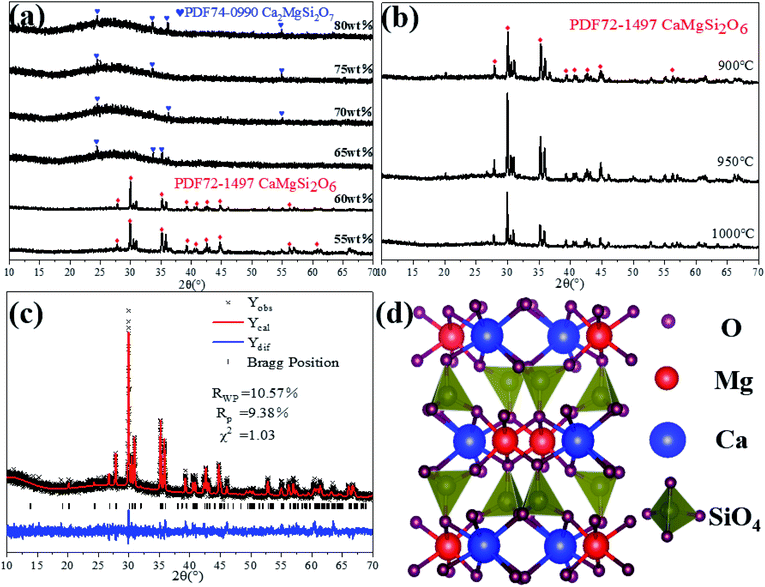
To obtain insight into the phase structures of samples, the XRD patterns of crystallization of glass-ceramics based on S1–S6 samples are summarized in Fig. 3(a), in which the samples are heated at 950 °C for 2 hours. It is clear to see that the wollastonite phase in the CaO–Al2O3–SiO2 system is transferred into the ordinary diopside phase,16 because the existence of magnesium oxide (MgO) in the tailing powder can reduce the mass fraction of Ca2+ and Si4+ ions in the melt. In addition, the replacement of Si4+ ions by partial Al3+ ions shows six coordination, which causes an increase of bond angle and bond length of Si–O–Si, resulting in a difference of crystal structure in glass-ceramics and the fundamental transformation of crystal morphology.17 Moreover, the compositions of iron oxide and titanium dioxide in gold tailings are favourable to the formation of the diopside phase. Besides, the incorporation of chromium oxide as a nucleating additive facilitates the formation of diopside group crystals during the glass melting and micro crystallization heat treatment processes.18–20 From the XRD patterns, it is found that S1, S2, S3, and S4 samples show the akermanite phase (Ca2MgSi2O7 PDF 74-0990). On the contrary, the main crystalline phases of S5 and S6 samples are the diopside phase (CaMgSi2O6 PDF 72-1497). Importantly, the samples containing less than 60 wt% tailings addition exhibit excellent crystallinity with strong peak intensity. Fig. 3(b) shows the XRD patterns of samples following a post-treatment from 900 °C to 1000 °C. The peak intensity reveals an increase at first and then decreases as temperature increases, which indicates that the crystallinity of the sample is highly dependent on the temperature and shows similar behavior. Following a sintering temperature of 950 °C, the sample exhibits an improved crystallinity of the diopside crystalline phase.Fig. 3(c) is a refined image of Rietveld's X-ray diffraction pattern of the S5 sample at 950 °C. The lower error coefficient and higher fitting degree (RWP = 0.1057, RP = 0.0938, χ = 1.03) further demonstrate the high purity of the crystalline phase, which indicates that only the diopside crystalline phase is formed in the glass-ceramics. All refined crystallographic parameters are listed in Table 3. The calculated values of a, b, and c of CaMgSi2O6 (space group: C12/C1) are 9.677, 8.793, and 5.287 Å, respectively, which are in agreement with the previously reported results (a = 9.7397 Å, b = 8.9174 Å, and c = 5.2503 Å).21 Fig. 3(d) shows the crystal structure of the diopside. The silicon-oxygen tetrahedron is connected with oxygen ions by sharing two of the four corner tops to form a continuous chain of (SiO3)n. The distance along the chain extension is 5.2 Å, which determines the crystal cell parameter of c. In the lateral direction, they are connected by cations (Ca2+, Mg2+, Fe2+, Fe3+, Na+, etc.). These cations are labeled M1 and M2: M1 atoms are basically located in top corners of the tetrahedron of the silicon-oxygen chain. In contrast, M2 atoms are located between the bottom surfaces of the tetrahedron of the chain. Ions with a larger radius (Ca2+ and Na+) generally occupy the M2 position rather than the M1 position.
| CaMgSi2O6 | C12/C1 | ||
|---|---|---|---|
| Atom | x | y | z |
| Mg | 0 | 0.90808 | 0.25 |
| Ca | 0 | 0.30148 | 0.25 |
| Si | 0.28619 | 0.09319 | 0.22936 |
| O1 | 0.1154 | 0.0869 | 0.14186 |
| O2 | 0.36094 | 0.25019 | 0.31776 |
| O3 | 0.35073 | 0.01744 | 0.99543 |
| a = 9.677471 Å b = 8.79296 Å c = 5.28715 Å α = γ = 90° β = 106.1539° v = 432.139387Å3 | |||
| Ref. 21 a = 9.7397 Å, b = 8.9174 Å, c = 5.2503 Å α = γ = 90° β = 105.866° | |||
3.3 The macro morphology and micrograph analysis
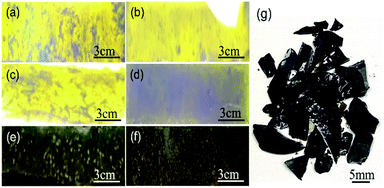
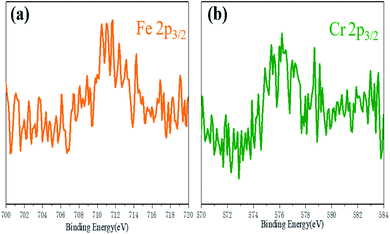
The cross-section photos of different samples (S1, S2, S3, and S4) are shown in Fig. 4(a–f). The yellow transparent glass-ceramics can be explained by the following: First, the iron mainly exists as Fe3+ with an electronic shell structure of 3d54s0, in which it is a half-filled 3d orbital. Therefore, it shows an inferior coloring ability. However, the existence of tetrahedron [FeO4] in the glass-ceramics is similar to the [SiO4], which strongly absorbs the ultraviolet light, and extends the light absorption to the visible region, resulting in the yellow color feature of glass-ceramics. To identify our hypothesis, X-ray photoelectron spectroscopy (XPS) was performed to characterize the valence state of elements in the glass-ceramics. The 80 wt% tailing addition glass-ceramics sample was selected as a representative sample. Fig. 5(a) shows the Fe 2p3/2 spectrum of the glass-ceramics sample. The typical peak of Fe 2p indicates the presence of Fe in the sample. The binding energy of 710.98 eV for Fe 2p3/2 is assigned to Fe3+, which is well consistent with our hypothesis.22 By contrast, the S5 and S6 samples show green color in Fig. 4(e, f), which can be explained by the reduction of the Fe2O3. As the reduction of Fe3+, the Cr ion shows more influence on the glass-ceramics in terms of the color feature. There are two kinds of states of Cr in the glass-ceramics including Cr3+ and Cr6+. Due to the fact that Cr6+ is unstable at high temperatures, Cr ions are prone to forming Cr3+ in the glass. The electronic shell structure of Cr3+ is 3d54 s0 with an ionic radius of 0.65 Å, which forms octahedral coordination with O2− in the glass, resulting in the green feature of glass. Here, the 60 wt% tailing addition glass-ceramics sample was selected as a representative sample. Fig. 5(b) shows the Cr 2p peak. The binding energy of 576.36 eV for Cr 2p3/2 is assigned to Cr3+, which further demonstrates the existence of Cr3+ in the glass-ceramics.23The fracture failure specimen of glass-ceramics is shown in Fig. 4(g), in which the sample exhibits a cone shape. The rest of the debris is irregular long and/or cloudy fragments. It is worth noting that the fracture is flat without any plastic deformation. In addition, brittle fracture in terms of fracture mode essentially indicates that the glass-ceramics belong to the typical brittle material. Furthermore, the existence of crushing products and cones is ascribed to the fact that the crack of the sample is also affected by other stress or microstructure during the propagation along the direction of principal stress, resulting in the occurrence of shear failure.
The typical cross-section SEM images of glass-ceramics samples after the bending resistance test are shown in Fig. 6. It is well known that glass-ceramics is an interlaced spatial structure composed of a crystalline phase and glass phase. From Fig. 6(a–d), it is found that the low crystalline phases of the S1, S2, S3, and S4 samples are brittle glass fractures with a smooth fracture surface. Additionally, the layered tearing edge (marked by a white arrow) representing brittle fracture characteristics is observed in Fig. 6(a). The corresponding roughness of the fracture surfaces gradually decreases with the decrease of crystallization. However, the roughness of the cross-sections of samples S5 and S6 increases significantly (Fig. 6(e, f)), which is attributed to the increase of crystallization degree and the interlacing of the crystalline phase and glass phase. The existence of the crystalline phase makes the corresponding fracture type change from glass brittle fracture to intergranular or trans-granular fracture.24 Besides, several micropore defects were observed in the sample (Fig. 6(e, f), white arrow), which are formed in the process of glass-ceramics sintering and cooling process. In general, a large number of microcracks always appeared on the fracture surface of glass-ceramics at the beginning, which are located in the junction of the crystalline phase and the glass phase (Fig. 6(a)) and the internal microporous defects (Fig. 6(e, f)), etc. The grain orientations in the microstructure are different. Therefore, the microcracks will encounter the constraints of adjacent grain boundaries and stop propagation in the process of formation and propagation, which will redistribute the stress state in the material and further stimulate the formation and propagation of microcracks in adjacent areas.25 On the basis of the above results, it is found that the glass-ceramics are brittle materials, with a discontinuous fracture process. The crack front of the main crack is affected by local disturbance.
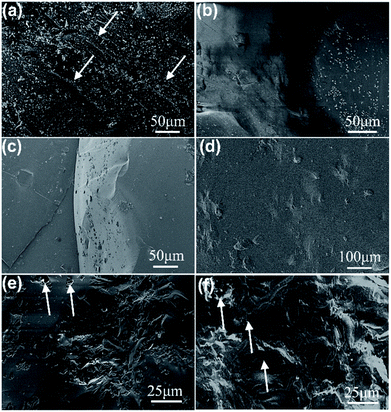 | ||
| Fig. 6 Fracture micromorphology of tailings glass-ceramics samples: (a) 80 wt%, (b) 75 wt%, (c) 70 wt%, (d) 65 wt%, (e) 60 wt%, and (f) 55 wt% tailing addition glass-ceramics samples. | ||
3.4 Properties of glass-ceramics
The physical and mechanical properties of glass-ceramics samples are shown in Fig. 7(a–c). The volume density of glass-ceramics highly depends on the density of sintered samples, the amount of precipitation, and the inner structure of the glass-ceramics crystal.26 It can be seen that the volume density gradually decreases in terms of S1–S4 and S5–S6 samples (Fig. 7(a)). The smaller bulk density of samples is ascribed to the decrease of crystallization (Fig. 8). For example, the diopside has a better crystallinity in comparison with the akermanite phase, which results in an enhanced volume density in terms of samples S5 and S6.27 The volume density of diopside crystals is 3.3–3.6 g cm−3. It is worth noting that the density of samples is lower than that of the pure diopside phase because of the existence of many glass phases in the tailings glass-ceramics samples. The density of the S5 sample is higher than that of the S6 sample, which is due to the reduction of the internal microporous defects. The reduction of tailings content and the increase of low melting point oxides such as Li2O facilitate glass crystallization, but excessive crystal growth rate can substantially deteriorate the internal crystal growth environment, leading to an increased presence of undesirable microporous defects in the glass-ceramics. Moreover, the loose bonding between particles in the tailings microcrystalline glass increases the volume of the specimen, which decreases the density of samples. The sample treated at 900 °C showed a lower density because of the low crystallinity and the glass phase as the main component at this condition. As the crystallization temperature increases, the crystal growth rate is substantially accelerated (Fig. 9). The volume density reaches a maximum value of 2.89 g cm−3 at 950 °C, and then shows a decreasing trend. This behavior can be explained by the following reasons: First, the generation of the internal defects has a significant influence on the density of the sample, resulting in a low volume density. Second, with the increase of crystallization, the glass phase will substantially decrease, which is beneficial for the increase of density. Therefore, it is essential to control the proper crystallization temperature for improving the volume density of glass-ceramics.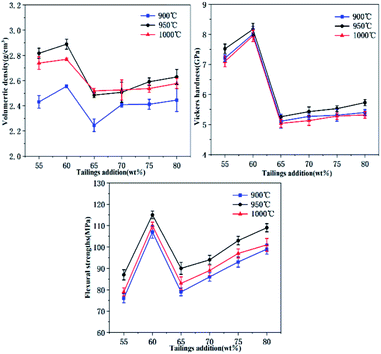 | ||
| Fig. 7 Physical and mechanical properties of tailings glass-ceramics: (a) volumetric density, (b) Vickers hardness, and (c) flexural strength. | ||
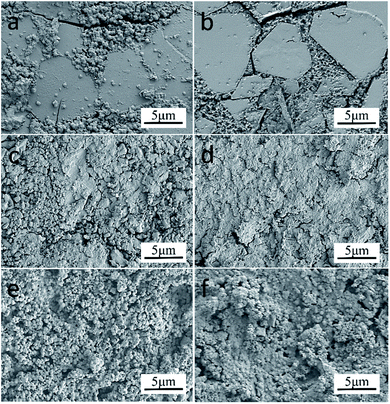 | ||
| Fig. 8 SEM images of glass-ceramics treated at 950 °C under different addition: (a) S1; (b) S2; (c) S3; (d) S4; (e) S5; (f) S6. | ||
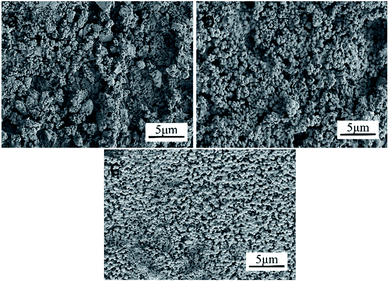 | ||
| Fig. 9 SEM images of glass-ceramics with 60 wt% tailings addition at different heat treatment temperatures: (a) 900 °C, (b) 950 °C, and (c) 1000 °C. | ||
The microhardness of glass-ceramics has a more extensive relationship with the internal crystal structure.28 As seen in Fig. 7(b), with the increase of tailings additions, the crystalline phase changed simultaneously. The microhardness of S5 and S6 samples is higher than that of the other samples, yielding the highest value of 8.17 GPa. This excellent performance is attributed to the dense structure of the diopside phase. At the initial stage of crystallization, the crystals are wrapped by glass phases. The microhardness mainly depends on the properties of the glass phase. As the crystallization temperature increases the microhardness of tailings glass-ceramics increases at first and then decreases (Fig. 9).29 Similarly, the increased temperature facilitates crystallization of tailing glass-ceramics, which is helpful for improving the microhardness. However, as the temperature continuously increases, the amount of the internal defects increases significantly, resulting in an inferior microhardness of the tailing glass-ceramics.
The flexural strength of glass-ceramics is mainly affected by the precipitation, dimension of crystal, internal crystal structure, and defects.30 Material fracture usually starts from grain boundaries. It will take more time for the propagation along the grain boundary during the period of crack owing to the improved crystallinity and increased grains. In addition, the initial crack length in the material is equivalent to the grain size, the smaller the grain size is prone to forming the smaller the initial crack size, leading to the improved critical flexural strength. Fig. 7(c) shows the test results of the flexural strength. The flexural strength of the samples from S4 to S1 samples increases gradually, which is ascribed to the increase of the mass fraction of Fe2O3. Fe2O3 as the nucleating agent component of the tailing glass-ceramics facilitates the precipitation of the crystalline phase, which results in the formation of higher fracture surface energy, leading to an increase in the flexural strength (Fig. 8).31 In contrast, although the crystalline phase diopside structure precipitated from S5 and S6 samples is conducive to improving the flexural strength, there are micropore defects inside the samples (S6 samples are more serious), so the improvement of flexural strength is not great compared with the previous glass samples.32 As the temperature increases, the crystallization of tailing glass-ceramics increases (Fig. 9). On the basis of this high temperature, the higher surface energy is formed, and the corresponding flexural strength increases accordingly, which yields a maximum of 116 MPa.
Table 4 shows a comparison of the main properties of CAS glass-ceramics and natural stone (marble and granite).1 The volume density, flexural strength, and Mohs hardness of natural stone are approximately 2.70 g cm−3, 20 MPa, and 6, respectively. The tailings glass-ceramics in this experiment are fully comparable to natural stone in several aspects of performance.
4. Conclusions
In summary, we developed a one-step direct cooling method to produce the gold tailings glass-ceramics. The resultant products showing excellent physical and mechanical properties were also obtained with higher tailings addition, which confirmed the possibility of using gold tailings from Shuangqi Mountain (Fujian, China) as raw materials for glass-ceramics. The glass-ceramics shows the akermanite phase (Ca2MgSi2O7) in terms of the sample with tailing addition ranging from 65 wt% to 80 wt%. The crystalline phase of glass-ceramics with 60 wt% and 55 wt% tailings addition is the diopside phase (CaMgSi2O6). Moreover, the crack propagation of glass-ceramics will be hindered by the crystals, which will be deflected rather than continuous penetration. On the basis of investigation of different tailing additions, the sample with 60 wt% tailings addition exhibits excellent properties under optimized heat treatment (950 °C, 2 h). The corresponding volume density, microhardness, and flexural strength of glass-ceramics can reach up to the maximum values of 2.89 g cm−3, 8.17 GPa, and 116 MPa, respectively. Our results demonstrate that the glass-ceramics obtained from 80 wt% tailings addition show good crystallinity, with improved performance in comparison with the general natural stone, which satisfies the standard of building use. This application of high content gold tailings is beneficial to the environment and the regeneration of resources.Author contributions
Author 1 (first author): conceptualization, methodology, software, investigation, formal analysis, and writing – original draft; author 2: data curation and writing – original draft; author 3: visualization and investigation; author 4: resources and supervision; author 5: software and validation; author 6: visualization and writing – review & editing; author 7: supervision and writing – review & editing; author 8: supervision and writing – review & editing; author 9 (corresponding author): conceptualization, resources, supervision, and writing – review & editing; author 10 (corresponding author): conceptualization, funding acquisition, resources, supervision, and writing – review & editing.Conflicts of interest
There are no conflicts to declare.Acknowledgements
This work was supported by grants from the National Natural Science Foundation of China (Grant No. U1632151) and the Key Research and Development Project of Anhui Province of China (Grant No. 1704a0902023).Notes and references
- R. D. Rawlings, J. P. Wu and A. R. Boccaccini, J. Mater. Sci., 2006, 41, 733–761 CrossRef CAS.
- G. A. Khater, J. Non-Cryst. Solids, 2010, 356, 3066–3070 CrossRef CAS.
- W. Chen, Y. Li, P. La, Y. Xue, Z. Li, S. Xu and J. Sheng, Ferroelectrics, 2021, 579, 23–32 CrossRef CAS.
- Q. Tang, X. Mu, X. Duan, C. Srinivasakannan, J. Liang, D. Ding and Z. Zhao, Arabian J. Sci. Eng., 2018, 43, 5919–5927 CrossRef CAS.
- K. Peng, C. Lv and H. Yang, Ceram. Int., 2014, 40, 10291–10296 CrossRef CAS.
- G. H. Beall and D. A. Duke, Glass-Ceramic Technology, The American Ceramic Society, Westerville, 1983. Search PubMed.
- L. Baowei, D. Leibo, Z. Xuefeng and J. Xiaolin, J. Non-Cryst. Solids, 2013, 380, 103–108 CrossRef.
- D. Holland, Glass Ceram., 1988, 4, 78–79 Search PubMed.
- W. Xu, K. Shen, Z. Cao, F. Liu, Y. Zhang, T. Zhang, N. Wu and S. Ouyang, Mater. Chem. Phys., 2021, 263, 124334 CrossRef CAS.
- B. Li, Y. Guo and J. Fang, J. Alloys Compd., 2020, 838, 155503 CrossRef CAS.
- Y. Wang, Q. Jiang, G. Luo, W. Yu and Y. Ban, J. Metall., 2012, 2012, 1–6 Search PubMed.
- H.-P. Liu, L.-P. Ma, X.-F. Huang, J.-X. Tang, J. Yang and J. Yang, RSC Adv., 2016, 6, 87696–87702 RSC.
- K. Chen, Y. Li, L. Meng, Y. Yi and Z. Guo, Cham, 2018, 415–428 Search PubMed.
- W. Shang, Z. Peng, Y. Huang, F. Gu, J. Zhang, H. Tang, L. Yang, W. Tian, M. Rao, G. Li and T. Jiang, J. Cleaner Prod., 2021, 317, 155503 CrossRef.
- A. A. Francis, J. Eur. Ceram. Soc., 2004, 24, 2819–2824 CrossRef CAS.
- B. Li, Y. Guo and J. Fang, J. Alloys Compd., 2021, 881, 159821 CrossRef CAS.
- H. N. Shi and X. H. Hou, J. Indian Ceram. Soc., 2018, 77, 118–122 CrossRef CAS.
- F. Pei, G. Zhu, P. Li, H. Guo and P. Yang, J. Aust. Ceram. Soc., 2019, 56, 979–986 CrossRef.
- S. Zhang, Y. Zhang and Z. Qu, Mater. Chem. Phys., 2020, 252, 123115 CrossRef CAS.
- D. He, C. Gao, J. Pan and A. Xu, Ceram. Int., 2018, 44, 1384–1393 CrossRef CAS.
- R. M. Thompson and R. T. Downs, Am. Mineral., 2008, 93, 177–186 CrossRef CAS.
- X. Hu, J. C. Yu, J. Gong, Q. Li and G. Li, Adv. Mater., 2007, 19, 2324–2329 CrossRef CAS.
- Virpal, J. Kumar, R. Thangaraj, S. Sharma and R. C. Singh, Appl. Surf. Sci., 2017, 416, 296–301 CrossRef CAS.
- I. L. Aurelio, S. Fraga, L. S. Dorneles, M. A. Bottino and L. G. May, Dent. Mater., 2015, 31, e316–e324 CrossRef CAS PubMed.
- M. W. Chen, J. W. McCauley, D. P. Dandekar and N. K. Bourne, Nat. Mater., 2006, 5, 614–618 CrossRef CAS PubMed.
- L. Zeng, H. Sun, T. Peng and T. Hui, Mater. Chem. Phys., 2021, 260, 124120 CrossRef CAS.
- F. Pei, H. Guo, P. Li, B. Yan, J. Li, P. Yang and G. Zhu, Ceram. Int., 2018, 44, 20132–20139 CrossRef CAS.
- D. S. Baik, K. S. No, J. S. Chun and H. Y. Cho, J. Mater. Process. Technol., 1997, 67, 50–54 CrossRef.
- D. Xiong, H. Li and J. Cheng, J. Mater. Sci.: Mater. Electron., 2009, 21, 882–888 CrossRef.
- J. Lu, X. Cong and Z. Lu, Mater. Chem. Phys., 2016, 174, 143–149 CrossRef CAS.
- W. Zhao, X. Huang, B. Yan, S. Hu, H. Guo and D. Chen, Sustainability, 2021, 13, 11144 CrossRef CAS.
- D. Feng, Y. Zhu, F. Li and Z. Li, J. Eur. Ceram. Soc., 2016, 36, 2579–2585 CrossRef CAS.
Footnote |
| † Electronic supplementary information (ESI) available. See https://doi.org/10.1039/d2ra01012g |
| This journal is © The Royal Society of Chemistry 2022 |


