 Open Access Article
Thermally stable mesoporous tetragonal zirconia through surfactant-controlled synthesis and Si-stabilization†
Ken L. Abel a,
Sebastian Weber
 bc,
David Poppitz
 a,
Juliane Titus
 a,
Thomas L. Sheppard
 bc and
Roger Gläser
 *a
*a
aInstitute of Chemical Technology, Universität Leipzig, 04299 Leipzig, Germany. E-mail: roger.glaeser@uni-leipzig.de
bInstitute for Chemical Technology and Polymer Chemistry, KIT (Karlsruhe Institute of Technology), 76131 Karlsruhe, Germany
cInstitute of Catalysis Research and Technology, Karlsruhe Institute of Technology (KIT), 76344 Eggenstein-Leopoldshafen, Germany
First published on 7th June 2022
Abstract
Thermally stable, highly mesoporous Si-stabilized ZrO2 was prepared by sol–gel-synthesis. By utilizing the surfactant dodecylamine (DDA), large mesopores with a pore width of ∼9.4 nm are formed. Combined with an NH3-treatment on the hydrogel, a high specific surface area of up to 225 m2 g−1 and pore volume up to 0.46 cm3 g−1 are obtained after calcination at 973 K. The individual contributions of Si-addition, DDA surfactant and the NH3-treatment on the resulting pore system were studied by inductively coupled plasma with optical emission spectrometry (ICP-OES), X-ray diffraction (XRD), N2 sorption, and transmission electron microscopy (TEM). Electron tomography was applied to visualize and investigate the mesopore network in 3D space. While Si prevents the growth of ZrO2 crystallites and stabilizes the t-ZrO2 phase, DDA generates a homogeneous mesopore network within the zirconia. The NH3-treatment unblocks inaccessible pores, thereby increasing specific surface area and pore volume while retaining the pore width distribution.
Introduction
Owing to a unique combination of weak acid, basic, oxidizing and reducing surface properties, ZrO2 is a versatile catalyst and catalyst support. Paired with its high thermal and chemical stability, it is for example applied in the dry reforming of methane, a reaction conducted at >1000 K.1,2 Recently, it is increasingly discussed as a support for CO2 hydrogenation to form both methane3 or methanol.4 Here, tetragonal ZrO2 is of special interest, since several studies suggest a superior catalytic activity of this modification over monoclinic ZrO2.5–8 However, the preparation of ZrO2 with high specific surface area (>100 m2 g−1) which is stable at elevated temperatures relevant for catalytic applications (≥873 K) is challenging.9 This is because hydrous ZrO2, derived from sol–gel synthesis, transforms from an X-ray amorphous phase to the metastable tetragonal ZrO2 (t-ZrO2) phase at around 673–723 K.10 Further heating results in the formation of monoclinic ZrO2 (m-ZrO2), generally observed between 773 and 873 K.9,11 Since the transition from t- to m-ZrO2 is associated with a volume expansion of ca. 4%,12 m-ZrO2 typically exhibits a low specific surface area (<60 m2 g−1), while zirconia with high specific surface area (>100 m2 g−1) is mostly present in the t-ZrO2 phase.9In order to maintain a high specific surface area, the stabilization of t-ZrO2 towards higher temperatures has therefore received considerable attention. One way to achieve this is the introduction of sulfate to the surface of ZrO2.13,14 Sulfated ZrO2 prepared in this way may exhibit superacidity,15,16 and has been used as a catalyst in various hydrocarbon conversion reactions, such as hydrocracking17 or the isomerization of light alkanes.18 However, sulfur atoms at the surface of the material may act as catalyst poison, in particular for applications, which require metals as an active component of the material.19 An alternative strategy to prevent the tetragonal to monoclinic phase transition is by doping with rare or alkaline earth metals.20,21 Apart from doping with metal ions, the stabilization of t-ZrO2 by introduction of Si has been thoroughly investigated.9,22–24 Commonly, Si is incorporated into ZrO2 through the dissolution of Si from glass vessels during basic treatment of hydrous ZrO2 precipitates, often referred to as “digestion”.25 From these studies, a correlation between the Si content and the specific surface area of the zirconia has been reported,22,23 though the reproducible dissolution of Si from glass may be problematic. However, Si can also be incorporated into ZrO2 in a more controlled manner by supplying an external Si precursor such as tetraethyl orthosilicate (TEOS) or Na2SiO3.23 Si mole fractions as low as 3.2 mol% (0.73 wt%) are reportedly sufficient to stabilize the t-ZrO2 phase and retain a specific surface area of 102 m2 g−1 after calcination at 873 K.26
The stabilization mechanism of t-ZrO2 by Si incorporation has been thoroughly investigated and is ascribed to two main effects,27 both of which are related to the t-ZrO2 crystallite size. Several reports suggest the existence of a minimum crystallite size necessary for the phase transition of t-ZrO2 to m-ZrO2 to occur.28,29 Depending on the preparation conditions, this critical size is typically between 10 and 30 nm. At higher Si mole fractions (>25 mol%), a rigid, amorphous SiO2 network forms around the ZrO2 particles, which prevents crystallization and crystal growth.30,31 Such a constraining effect, however, cannot explain the stabilization of t-ZrO2 at lower Si mole fractions (<10 mol%). Instead, several studies have shown that there is an enrichment of SiO2 on the ZrO2 surface, with 29Si NMR and FT-IR spectroscopy indicating Si–O–Zr bonds.22,27,31 This SiO2 coverage inhibits the ZrO2 crystallite growth through hampered diffusion and lattice deformations at the surface, which kinetically stabilizes the t-ZrO2 phase towards higher temperatures.
Although Si incorporation results in a high specific surface area and hinders the transition towards m-ZrO2, a comparably low specific pore volume (<0.20 cm3 g−1) is obtained after calcination with only small (<4 nm) mesopores, if any, present.32 When used as a catalyst support, this may lead to deactivation of the catalyst as a result of pore blocking effects. Thus, several structure-directing agents such as amines,33 alkylammonium salts,34 organic sulfates35 or block-copolymers36 as well as “hard” templates37 have been applied to generate additional mesopores within ZrO2 during sol–gel synthesis. However, while these strategies can lead to ZrO2 with both high specific surface area (>200 m2 g−1) and mesopore volume (>0.4 cm3 g−1),33 two common limitations are observed. Firstly, the mean pore width is typically lower than 6 nm, even if a certain control is achieved via, e.g., variation of the surfactant chain length.38 Secondly and more importantly, the mesopore structure generally collapses as a result of crystallization and/or the t- to m-ZrO2 transition, if the material is exposed to elevated temperatures ≥873 K.39,40
Hence, to prepare mesoporous ZrO2 with high thermal stability, the use of both a structure-directing agent and a t-ZrO2 stabilizing element is generally required.21,41,42 For Si-stabilized ZrO2, the reported syntheses still rely on the dissolution of Si from glass vessels during “digestion” procedures,43 often without reporting the Si content.26,44,45 In earlier work, our group demonstrated that the pore width of mesoporous SiO2–ZrO2 can be controlled by variation of the pH value using NH4OH solution.46 However, the ill-defined nature of glass surfaces and the narrow pH regime (9–12) restrict the practicality and control of this synthesis approach. Moreover, since the Si incorporation occurs during the NH4OH-treatment on the hydrogel, it is not possible to differentiate the effects of Si and the “digestion” on the material properties.
In this report, we, therefore, follow a different approach towards Si-stabilized ZrO2, i.e., supplying Si before gelation without the need for an additional “digestion” step.47 In order to generate mesopores, we combine this synthesis approach with the use of the surfactant dodecylamine (DDA), as previously described by both Cassiers et al.43 and by our group.46 This strategy allows to independently investigate the effects of Si, DDA and an NH3-treatment of the hydrogel on both textural properties and thermal stability of the zirconia, which we thoroughly analyze in this study. Consequently, an experimental procedure is provided for reliably preparing thermally stable, mesoporous t-ZrO2 dominant materials with potential applications even under harsh catalytic or thermal conditions.
Experimental section
Synthesis of mesoporous SiO2–ZrO2
The zirconia preparation was adapted from our previously described procedure.47 In order to generate mesopores in the material, DDA was added to the gelation solution, as reported earlier.46 From the initial synthesis, the pH value was adjusted to 10 using aqueous NH4OH solution and scaled accordingly to give 1–10 g product. The chemicals used were zirconyl nitrate hydrate (ZrO(NO3)2·xH2O, 99%, Aldrich), Ludox® AS 40 colloidal silica (Ludox®, 40 wt% suspension in H2O, Aldrich), dodecylamine (DDA, ≥98%, Fluka), ammonia (NH4OH, 32 wt% in H2O, RECTAPUR®, VWR) and ethanol (EtOH, 99.5%, denaturated with 1% butan-2-one, VWR).11.55 g ZrO(NO3)2·xH2O was dissolved in H2O to obtain a concentration of 0.57 mol L−1. Based on thermal analysis, “x” was assumed to be 6 in all calculations. In a separate container, appropriate amounts of Ludox® (40 wt% in H2O) and DDA were dissolved in an EtOH–H2O mixture (nZr/nEtOH/nH2O = 1/160/400) and heated up to 313 K. After reaching this temperature, the Zr-containing solution was added dropwise to the EtOH–H2O solution while stirring vigorously at 650 rpm. During precipitation, the pH was monitored with a pH electrode (Metler InLab Routine Pro) and kept constant at a value of 10 using aqueous diluted NH4OH (c = 8.3 mol L−1). After precipitation, the mixture was heated up to 343 K, stirred at this temperature for 1 h without pH monitoring, and allowed to cool to room temperature. The aged hydrogel was then filtered under reduced pressure and washed with EtOH (nEtOH/nZr = 50) and H2O (nH2O/nZr = 300). Finally, the washed gel was dried at 383 K for 12 h and calcined at either 923 or 973 K for 8 h in air, both using a heating rate of 2 K min−1, to obtain a white, brittle solid. As shown in section S1 of the ESI,† the difference in calcination temperature did not have a major impact on the crystal structure and textural properties of the materials.
In order to investigate the Si- and DDA-dependency of the synthesis, the volume of the Ludox® solution and mass of DDA used were varied. The experimentally determined Si mole fraction in mol%, based on n(Zr+Si), is denoted by the prefix “yS” (y ranging from 0 to 47) in the sample name. The DDA mole fraction in mol%, based on nZr, is indicated by the suffix “zD” (z ranging from 0 to 30) in the sample name. For example, sample 15SZ-20D exhibits a Si mole fraction of 15 mol% and was prepared in the presence of 20 mol% DDA during gelation. Selected hydrogels were subjected to a treatment in aqueous NH4OH in PTFE vessels prior to filtration and drying, indicated by the notation “-at” in the sample name. Diluted aqueous NH4OH (c = 4.7 mol L−1, nNH4OH/nZr = 44) was added, the vessel was sealed and heated up to 363 K for 140 h.
Characterization
Inductively coupled plasma optical emission spectrometry (ICP-OES) was conducted using a PerkinElmer Optima 8000 instrument equipped with a Scott/cross flow sample injection system. The samples were dissolved in a mixture of hydrofluoric, nitric, and hydrochloric acid in an Anton Paar Multiwave 3000 microwave prior to analysis. An experimental error of ±0.3 wt% is expected for the Si mass fraction.CHN elemental analysis was conducted on a Vario EL MICRO element analyzer manufactured by Heraeus. Samples were crimped within a container made of aluminum and analyzed via heat extraction.
Powder X-ray diffraction (XRD) patterns were recorded using a Huber G670 Guinier geometry diffractometer equipped with an image-plate detector. Reflections were recorded between 2θ = 4° and 2θ = 100° using Cu-Kα radiation (λ = 0.15406 nm), with a step size of 0.005 ° and an irradiation time of 15 min per scan. Topas software by Bruker48 was used for Rietveld refinements of XRD data.49,50 Detailed information on the refinements can be found in the ESI (Section S3.2†).
N2 sorption analysis was conducted on a Micromeritics ASAP 2010 for samples calcined at 923 K and a Porotec Sorptomatic 1990 instrument for samples calcined at 973 K. Samples were degassed at 523 K for at least 4 h. The adsorption and desorption isotherms were recorded at 77 K and analyzed using the ASiQwin software by Quantachrome Instruments. The total pore volume was determined at p/p0 ≥ 0.95. Specific surface area and pore width distribution were determined by the BET method51 (adsorption branch) and BJH method52 (desorption branch), respectively. An experimental error of 5% is expected for specific surface area, specific pore volume and pore width.
Transmission electron microscopy (TEM) analysis was performed on a Jeol JEM2100Plus operated at 200 kV acceleration voltage with a maximum point resolution of 2.3 nm. The microscope was equipped with an EDAX Octane T EDS system for elemental analysis.
Lamellas of the pure ZrO2 and 15SZ-20D were prepared for electron tomography measurements using a FIB Strata 400S (FEI, USA) with a Ga+ ion beam. Electron tomography measurements of the sample lamellas prepared via FIB were performed using a Fischione 2020 tomography holder on a Titan 80-300 (FEI) microscope with an acceleration voltage of 300 kV in STEM mode. Tomograms were acquired over an angular range of ±60° with 2° per step resulting in 60 projections per tomogram. Detailed information on the data collection and processing is given in the ESI (Section S4.1.1†)
Results and discussion
Stabilization of t-ZrO2 by Si
To investigate the effect of Si in the synthesis, zirconia was synthesized without the addition of Si (pure ZrO2) and with 15 mol% Si (15SZ). As displayed Fig. 1, TEM images of these samples exhibit very different morphologies. While aggregated but clearly distinguishable particles with a diameter of about 10–40 nm are formed in the absence of Si (Fig. 1a), the Si-stabilized sample (Fig. 1b) shows significantly smaller ZrO2 particles (<5 nm). Selected area electron diffraction (SAED, see insets) displays typical patterns for polycrystalline materials in both samples with additional distinct reflections for the pure ZrO2 sample, indicative of larger crystals. From both XRD and these SAED patterns (Fig. S5 and S6 in ESI†), it is possible to identify the dominant presence of m-ZrO2 for Si-free ZrO2 and t-ZrO2 for 15SZ, respectively.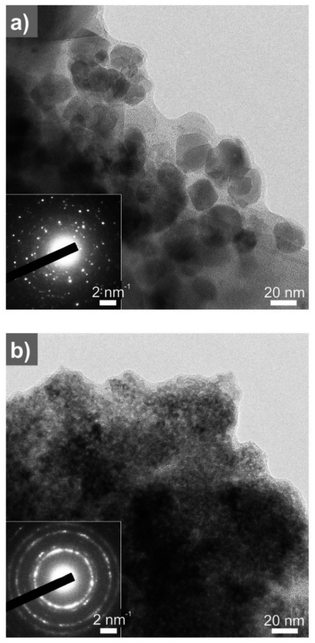 | ||
| Fig. 1 TEM micrographs of (a) pure ZrO2; (b) 15SZ (Si-stabilized ZrO2), calcined at 923 K. The insets show SAED patterns obtained from the region displayed in the images. | ||
According to Rietveld refinements given in the ESI (Fig. S7, S8 and Tables S1, S2†), the pure ZrO2 sample contains 95 wt% m-ZrO2 and 5 wt% t-ZrO2, while a refinement with pure t-ZrO2 led to the best fit for sample 15SZ. Additionally, the average ZrO2 crystallite size calculated from the microstructure analysis as part of the Rietveld refinements decreased from 16.05(16) nm for the m-ZrO2 contribution in the pure ZrO2 sample to 8.15(10) nm for the t-ZrO2 phase in sample 15SZ. This clearly supports the interpretation of Si as an inhibitor for the ZrO2 crystallite growth, which prevents the t–m-ZrO2 transition. Notably, Yin et al.23 reported very similar results. Using the Scherrer equation, the authors calculated crystallite sizes of 15–16 nm for a Si-free, predominantly m-ZrO2 and 5–6 nm for a Si-containing t-ZrO2 (xSi ∼ 20 mol%), both after calcination at 1073 K.
Nevertheless, full stabilization of the t-ZrO2 phase has been reported at much lower Si mole fractions. In good agreement, Rezaei et al.26 reported this to occur at ∼3.2 mol% (0.73 wt%) Si after calcination at 873 K, while Nahas et al.27 determined ∼3.5 mol% (0.8 wt%) Si, after calcination at 823 K, to be sufficient to fully stabilize t-ZrO2. Similar to the prevention of the t–m-ZrO2 transition, the crystallization of ZrO2 can be inhibited even more effectively if high Si mole fractions are used, so that only X-ray amorphous ZrO2 is formed. For example, both del Monte et al.28 and Nagarajan et al.30 reported that SiO2–ZrO2 containing 50 mol% Si remained amorphous after calcination at 1073 K, and t-ZrO2 was formed only after calcination at 1273 K. Therefore, at a given calcination temperature, crystalline t-ZrO2 is expected to exist only within a defined Si mole fraction regime, with the m-ZrO2 phase being predominantly formed below and an amorphous, SiO2-like material above that certain range. In order to explore the influence of Si-content for the synthesis presented here, zirconia with different Si mole fractions between 0 and 27 mol% were prepared and calcined at 973 K. A comparison of the XRD patterns is given in Fig. 2. Indeed, without Si, m-ZrO2 is predominantly found, but a transition to mostly t-ZrO2 is already observed when 5 mol% Si are used. However, according to Rietveld refinement, ∼21.4 wt% m-ZrO2 are still present in 5SZ (Table 1). Essentially pure t-ZrO2 with a calculated m-ZrO2 fraction of only ∼1.2 wt% is obtained at 8 mol% Si and above. At higher Si molar fractions, t-ZrO2 reflections visibly broaden, until an X-ray amorphous material is formed at 27 mol% Si (27SZ).
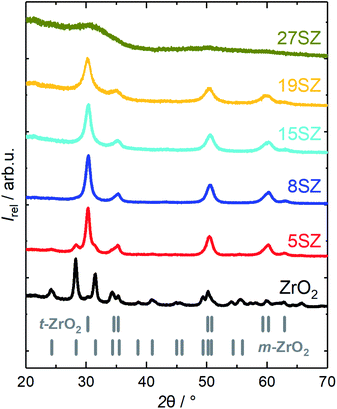 | ||
| Fig. 2 XRD patterns of zirconia samples calcined at 923 K with different mole fractions y of Si (denoted as “ySZ”). | ||
As the Si mole fraction increases, the calculated crystallite sizes decrease from 23.7 nm (pure ZrO2) to 7.5 nm (19 mol% Si) (Table 1). These findings are in good agreement with recently published results from Min et al.,24 who reported 20.7 nm (pure ZrO2) and 8.9 nm (20 mol% Si), obtained from the same calcination temperature of 973 K. At a Si mole fraction of 27 mol%, no XRD reflections are found, likely due to even smaller crystallite sizes, as an amorphous, growth-constraining SiO2 network forms around the ZrO2 crystallites.
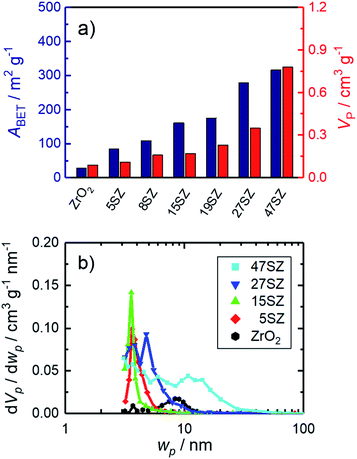
Additional support for this interpretation is given by N2 sorption studies. According to the IUPAC definition,53 samples reported in this work generally show a type IV isotherm with a H1 hysteresis (exemplary in Section S2 in ESI†). Starting from 28 m2 g−1 and 0.09 cm3 g−1 for pure ZrO2, both specific surface area (ABET) and pore volume (VP) increase with increasing Si mole fraction (Fig. 3a). Assuming hard, non-porous cubes of uniform size with a density of 6 g cm−3, a reduction of the crystallite size from 25 to 7 nm would result in an increase of ABET from 40 m2 g−1 to 143 m2 g−1.54 Thus, it is reasonable to assume that the observed increase of the specific surface area with the Si mass fraction (Fig. 3a) is primarily caused by a decrease of the ZrO2 crystallite sizes. The decrease in crystallite size within the lower Si mole fraction regime (≤15 mol%) is accompanied with the formation of small mesopores (2–4 nm, Fig. 3b). However, as an amorphous SiO2 network forms (>19 mol% Si), the pore width distribution broadens significantly and shifts to larger pores. At the same time, a rapid increase of both ABET and VP is observed (Fig. 3a). Thus, we can confirm the previously reported Si-dependency for mesoporous ZrO2,26–28 although essentially full t-ZrO2 stabilization is observed at a higher Si mole fraction of 5–8 mol%. Amorphous ZrO2 is then formed at higher fractions between 19 and 27 mol% Si, though lower if compared to 50 mol% Si as reported in other sources.28,30
Mesopore generation in the presence of dodecylamine
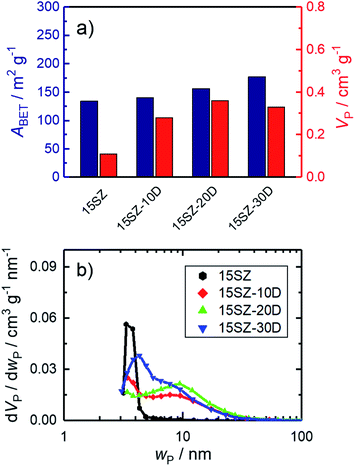
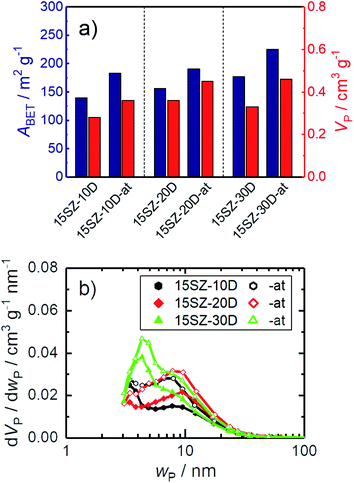
To study the effect of the surfactant DDA on the pores of the material, sample 15SZ was chosen, since it contains the lowest molar fraction of Si, at which the pure t-ZrO2 phase was obtained. Though exhibiting high specific surface area of 137 m2 g−1 after calcination at 923 K, the resulting specific pore volume of 0.11 cm3 g−1 for ZrO2 with 15 mol% Si is still fairly low.32 Hence, in order to generate mesopores within this Si-stabilized ZrO2, 10–30 mol% DDA (based on nZr) were added to the gelation solution while using a constant Si mole fraction of 15 mol%. The specific surface area and pore volume for calcined SiO2–ZrO2 samples are given in Fig. 4a. As can be clearly recognized, specific surface area increases with the used amount of DDA from 137 m2 g−1 for 15SZ to 186 m2 g−1 for 15SZ-30D. More significantly though, the specific pore volume more than triples from 0.11 cm3 g−1 for the DDA-free synthesis to 0.36 cm3 g−1 for 15SZ-20D, followed by a slight decrease to ultimately 0.28 cm3 g−1 for 15SZ-30D. As demonstrated by the pore width distributions of the same samples displayed in Fig. 4b, the increase of VP is caused by the generation of mesopores. While in the absence of DDA only small mesopores (∼3–4 nm) are present, an addition until 20 mol% DDA leads to the formation of a broad distribution of larger mesopores (∼4–40 nm), with a modal pore width (wP) of 9.4 nm for sample 15SZ-20D. Hg porosimetry analysis performed on the 15SZ-20D sample (Section S4.2 in ESI†) confirms that the material is essentially only mesoporous (specific macropore volume <0.05 cm3 g−1). A further increase of the DDA concentration within the gelation solution leads to a sharpening and shift of the pore width distribution back to smaller pores, with wP of 4.9 nm for 15SZ-30D. We observed that DDA is insoluble in the gelation solution above a concentration of 20 mol% DDA. Therefore, it is possible that the decrease of both pore volume and mean pore width are caused by DDA molecules emulsified within the gelation mixture through rapid stirring.In order to investigate the nature of the pore generation by DDA, CHN elemental analysis was conducted on 15SZ-20D after drying and subsequent calcination. Prior to calcination, the dried sample contained 0.9 wt% N, 7.9 wt% C and 3.2 wt% H. After calcination, no nitrogen and carbon were detected, and the hydrogen mass fraction reduced to 0.5 wt%. Therefore, it is reasonable to assume that DDA remains in the solid during the applied drying procedure and is only removed during calcination. However, given the rather broad pore width distribution, we consider it unlikely that DDA acts as a soft template. Instead, we hypothesize that DDA acts as an organic binder, promoting the aggregation or partial agglomeration of SiO2–ZrO2, which is removed upon calcination to generate voids, whose width distribution is not strictly defined. This interpretation is supported by additional studies, in which the surfactant chain length as well as the type of structure-directing agent itself were varied, which led to similar pore width distributions (see Section S4.4 in ESI†). The results presented in Fig. 4 represent zirconia with unusually large mesopores, stable until to a calcination temperature of 873 K. To the best of our knowledge, thermally stable ZrO2 with mean pore widths of >10 nm have so far only been prepared through the use of organic polymers.41,55 R. Liu et al.41 prepared ZrO2 stabilized with 10 mol% Al in the presence of the block-copolymer Pluronic F127. After calcination at 973 K, a pore width distribution similar to 15SZ-20D was formed, though ABET (46 m2 g−1) and VP (0.15 cm−3 g−1) were considerably lower than the values obtained in this work. X. Liu et al.55 prepared mesoporous ZrO2 using Pluronic P123, which exhibited a very similar pore structure to 15SZ-20D as well as similar ABET (195 m2 g−1) and VP (0.41 cm−3 g−1). Unfortunately, the Si fraction of this material was not analyzed, though refluxing the hydrogels in NH3 for 48 h in glass vessels, known to dissolve Si,9 was included in the preparation procedure. Compared to these reports, we obtain a highly porous and thermally stable ZrO2 by using the non-ionic surfactant DDA.
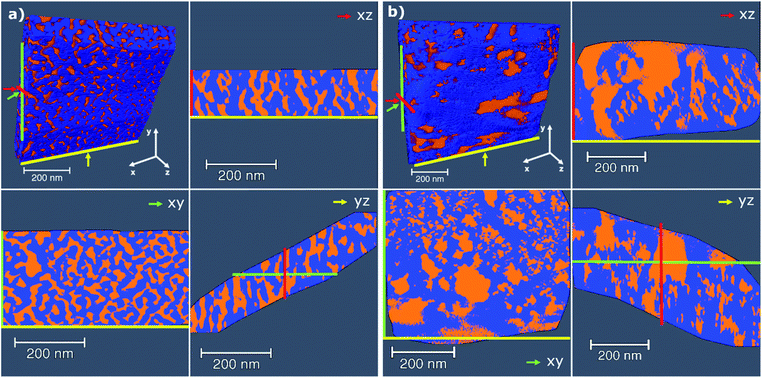
As N2-sorption studies report on the bulk properties of the sample, the influence of DDA addition on the specific geometry of the generated mesopore system was further investigated by electron tomography as shown for pure ZrO2 (Fig. 5a) and 15SZ-20D (Fig. 5b). The effective resolution of the tomograms is estimated at 13 nm according to the Crowther criterion (see Section S4.1 in the ESI†). Considering the effective resolution and the limited number of projections ±60° in 2° steps, it is not appropriate to discuss mesopores below 13 nm despite their presence in the samples indicated by N2 sorption and Hg porosimetry analysis. The results of the quantitative porosity analysis of the tomograms are shown in Section S4.1.4 in the ESI.† The pure zirconia material in absence of Si and DDA shows a quite homogeneous distribution of pores and pore shapes. The addition of Si and DDA in 15SZ-20D leads to increased pore sizes with significant presence of macropores (>50 nm). However, 15SZ-20D shows rather irregular pore shapes and less homogenous pore sizes compared to pure ZrO2. Qualitative comparison based on the volume images is also confirmed by quantitative analysis of the pore size distribution (see Section S4.1.1 in ESI†). For pure ZrO2 a mean pore diameter of 38.1 ± 0.4 nm, and for 15SZ-20D of 60.8 ± 9.7 nm is obtained. The results of electron tomography should rather be qualitatively compared with those of N2 sorption and Hg porosimetry, due to the presence of mesopore features down to 3–4 nm which may not be accurately resolved. On the other hand, electron tomography as performed here enables observation of larger mesopore and small macropore features, which may not be accurately quantified by N2 sorption techniques. Furthermore, a qualitative impression of the homogeneity, connectivity, shape, and ordering of the pore system is possible through tomography, which is not directly accessible by N2 sorption or Hg porosimetry.
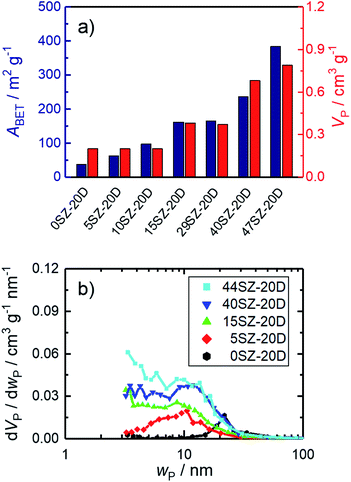
Without DDA addition, pure t-ZrO2 was found to exist only within a Si mole fraction regime between 8 and 27 mol% (Table 1). In order to investigate this dependency on the presence of DDA within the gelation solution, a similar series of SiO2–ZrO2 samples with Si fractions between 0 and 47 mol% was prepared. A concentration of 20 mol% DDA was chosen for this series, since this value led to the maximum specific pore volume observed. XRD patterns of this series are shown in Fig. 6. Compared to zirconia prepared in the absence of DDA, a qualitatively similar Si molar fraction dependency is observed if DDA is present in the gelation solution. For example, m-ZrO2 still remains as the dominant crystalline phase with a calculated mass fraction of ∼95 wt% when no Si is used (Table 2). Moreover, full stabilization of t-ZrO2 is observed when the Si content is ≥10 mol%, while the XRD reflections visibly broaden as the Si fraction increases. Consequently, the calculated t-ZrO2 crystallite sizes decrease from 14.6(2) nm in 5SZ-20D to 8.10(12) nm in 29SZ-20D (Table 2). The sample 40SZ-20D, similar to 27SZ, shows no distinct reflections in the XRD pattern, likely caused by the constraining effect of an amorphous SiO2 network formed as described in the previous section. Nevertheless, it must be noted that more Si is required to achieve a stabilizing effect of t-ZrO2 when DDA is used, compared to the syntheses without DDA. For example, at a Si molar fraction of 5 mol%, the t-ZrO2 fraction is only 38.08(11) wt% when 20 mol% DDA are used (5SZ-20D), compared to 78.6(2) wt% without DDA (5SZ). Additionally, in the presence of DDA, the transition from tetragonal to amorphous ZrO2 occurs at much higher Si molar fractions compared to preparations without DDA. Complementary to this, N2 sorption analysis reveals an increase of ABET and VP with the Si mole fraction (Fig. 7a), yet two major differences to the trend in absence of DDA (Table 1) are found. Firstly, the specific pore volume at low Si fractions (≤15 mol%) is higher, which may be due to the pore-generating effect of DDA. Secondly, however, the rapid increase of ABET and VP starts between 29 and 40 mol% Si.
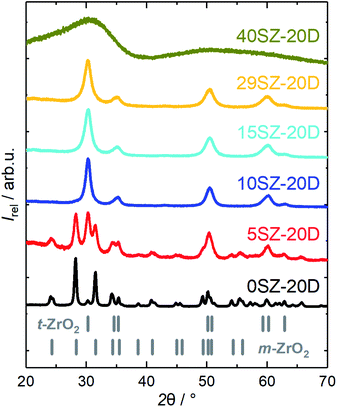 | ||
| Fig. 6 XRD patterns of zirconia samples calcined at 973 K with different mole fractions of Si (yS), prepared in the presence of 20 mol% DDA during gelation. | ||
It therefore appears that the presence of DDA within the gelation solution retards the stabilizing effect of Si. It is reasonable to suggest that this may be caused by an interaction between ZrO2 nanocrystals and DDA, which disturbs the SiO2–ZrO2 interaction. An alternative explanation can be deduced from the electron tomography studies (Fig. 5). These demonstrate that by the use of DDA, much more previously inaccessible bulk ZrO2 is exposed to the material surface. This is supported by the fact that DDA addition led to a slight increase of specific surface area, even though the specific pore volume increased considerably (Fig. 4a). Consequently, more Si is needed to cover the additional surface to restrict the crystallization of t-ZrO2 and prevent the t- to m-ZrO2 phase transition. This clearly shows that the effects of the structure-directing agent and the structure-stabilizing promoter are not independent. Instead, they presumably influence each other, demonstrating that their combined effect must be considered for a reasonable understanding about the concurrent development of thermal stability and textural properties. The influence of the Si mole fraction on the pore width distribution for zirconia prepared in the presence of DDA (Fig. 7b) is an instructive example for this statement. Without Si, much larger pores are formed when the gelation solution contained 20 mol% DDA (pure ZrO2 sample in Fig. 3b vs. 0SZ-20D in Fig. 7b). However, the pore width distribution continuously broadens with a significant contribution of smaller mesopores <10 nm forming as the Si mole fraction increase. Thus, the Si-stabilizing effect must be balanced with the pore-generating effect of DDA for a targeted design of the pore system. Interestingly, the pore width distributions of 47SZ and 44SZ-20D are very similar to each other, which implies that the effect of Si may ultimately compensate the pore-generating effect of DDA. DDA addition is therefore most effective at low Si mole fractions (≤15 mol%).
NH3-treatment on zirconia hydrogels
There is ample evidence for the benefits of basic treatments of zirconia hydrogels prior to drying in order to increase specific surface areas and pore volumes.9 However, in many studies, the effect of the basic treatment cannot be differentiated from Si stabilization since glass containers are commonly used. One exception for this is the report of Yin et al.23 Therein, the specific surface area of ZrO2 with ∼5 wt% Si (equivalent to ∼20 mol%) was 104 m2 g−1 after calcination at 873 K but increased to 154 m2 g−1 when an NH3-treatment step on the hydrogel was included. Thus, there seems to be an additional benefit of basic treatment of zirconia hydrogels. Additionally, to the best of our knowledge, an independent study on only the effect of basic NH3-treatment has so far not been conducted for mesoporous zirconia, prepared in the presence of a structure-directing agent. Therefore, selected hydrogels prepared with 15 mol% Si and 10–30 mol% DDA, were subjected to an NH3-treatment for 144 h. As shown in Fig. 8a, the NH3-treatment led to increases of both ABET and VP at all investigated DDA mole fractions. For 30 mol% DDA, remarkable values of the specific surface area (225 m2 g−1) and pore volume (0.46 cm3 g−1) were achieved. Interestingly, the increase of both ABET and VP did not change the pore width distribution significantly (Fig. 8b), implying a cumulative increase in accessible porosity without altering the pore characteristics. This is a highly useful material property because it enables the adjustment of the accessible void fraction and surface area while retaining the mean pore width in the material.The observed increase of ABET may be partially related to a further decrease of the crystallite size, since a slight broadening of the reflections is found during XRD analysis for SiO2–ZrO2 calcined after NH3-treatment (Fig. 9). Indeed, Rietveld refinements indicate a crystallite size reduction from 9.1 nm to 6.6 nm for 10 mol% DDA and from 9.9 nm to 7.8 nm for 20 mol% DDA (Tables S14–S17 in ESI†). However, this cannot explain the significant increase of the specific pore volume while retaining the pore width distribution. Given that the mean pore width does not increase and is largely retained instead, leaching of the pore walls appears unlikely. This particularly applies to the Si component, since its dissolution from the surface of the hydrogel would be expected to reduce both ABET and VP (Fig. 3a and 7a). Therefore, we assume that the enhancement of ABET and VP rather arises from dissolution and reprecipitation processes, which make previously blocked pores accessible to the surface. Such reprecipitation processes could also explain the decrease of the average crystallite size.
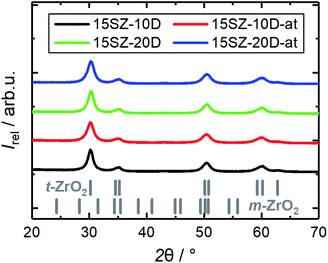 | ||
| Fig. 9 XRD patterns of Si-stabilized zirconia samples calcined at 923 K, prepared in the presence of 10–20 mol% DDA (-zD) during gelation, with and without NH3-treatment of the hydrogels (-at). | ||
Conclusions
Tetragonal ZrO2, stabilized by 15 mol% Si, with distinctively large mesopores (∼4–40 nm with modal pore width of 9.4 nm) is successfully prepared. The effects of incorporation of Si, the surfactant DDA and an NH3-treatment on the hydrogel and the resulting properties are resolved. Si incorporation stabilizes the t-ZrO2 phase by blocking aggregation of large ZrO2 particles. This results in a considerable reduction of the crystallite size, which leads to a high specific surface area of up to 225 m2 g−1. The presence of DDA enables the generation of a broad distribution of large mesopores (∼4–40 nm), possibly by the promotion of SiO2–ZrO2 particle aggregation and/or agglomeration. The basic hydrogel treatment with NH4OH solution increases both the specific surface areas and pore volumes while retaining the pore width distribution. Likely, this is due to dissolution and reprecipitation processes, which can open previously blocked pores. From the Si-dependence both in the absence and presence of DDA during gelation, it is concluded that Si-stabilization and mesopore generation by DDA are correlated. Thus, the combined effects of stabilization of t-ZrO2 by Si as the structural promoter and DDA as the porogen must be considered to balance thermal stability and the resulting mesopore system. This result is likely not only relevant for the preparation of ZrO2, but also for other materials where a phase transition may interfere with the thermal removal of the structure-directing agent. Based on the high thermal stability, mesoporous nature along with high specific surface area of up to 225 m2 g−1 and pore volume of 0.46 cm3 g−1, the Si-stabilized ZrO2 presented in this study is a promising mesoporous catalyst support with applications in demanding chemical environments, such as the dry reforming of methane or CO2 hydrogenation with H2. Additionally, it can be sulfated and used as a porous, superacidic catalyst for hydrocarbon conversion reactions.Conflicts of interest
There are no conflicts to declare.Acknowledgements
Support of this work by the German Research Foundation (Deutsche Forschungsgemeinschaft, DFG) within the priority program SPP2080 (406914011; GL 290/13-1 and SH 1281/1-1) is gratefully acknowledged. Also, we acknowledge support from Universität Leipzig for Open Access Publishing. Moreover, we thank Simon Sprocq, Timm Reimann, Markus Wertz and Patricia Seidel for their assistance in the synthetic work. Also, Manuela Roßberg, Institute of Inorganic Chemistry, Heike Rudzik, Institute of Chemical Technology, Leipzig University, and Sebastian Geisler, Institute of Mineralogy, Crystallography and Material Science (all Universität Leipzig), are acknowledged for CHN elemental analyses as well as ICP-OES and XRD measurements, respectively. We would like to thank Yakub Fam, Wu Wang and Di Wang (all Karlsruhe Institute of Technology) for support during electron tomography experiments.Notes and references
- J. Titus, M. Goepel, S. A. Schunk, N. Wilde and R. Gläser, The role of acid/base properties in Ni/MgO-ZrO2–based catalysts for dry reforming of methane, Catal. Commun., 2017, 100, 76–80 CrossRef CAS.
- M. Rezaei, S. M. Alavi, S. Sahebdelfar, P. Bai, X. Liu and Z.-F. Yan, CO2 reforming of CH4 over nanocrystalline zirconia-supported nickel catalysts, Appl. Catal., B, 2008, 77, 346–354 CrossRef CAS.
- X. Jia, X. Zhang, N. Rui, X. Hu and C.-j. Liu, Structural effect of Ni/ZrO2 catalyst on CO2 methanation with enhanced activity, Appl. Catal., B, 2019, 244, 159–169 CrossRef CAS.
- K. Li and J. G. Chen, CO2 Hydrogenation to Methanol over ZrO2-Containing Catalysts: Insights into ZrO2 Induced Synergy, ACS Catal., 2019, 9, 7840–7861 CrossRef CAS.
- W. Li and Z. Zhao, Hierarchically structured tetragonal zirconia as a promising support for robust Ni based catalysts for dry reforming of methane, RSC Adv., 2016, 6, 72942–72951 RSC.
- K. Samson, M. Śliwa, R. P. Socha, K. Góra-Marek, D. Mucha, D. Rutkowska-Zbik, J.-F. Paul, M. Ruggiero-Mikołajczyk, R. Grabowski and J. Słoczyński, Influence of ZrO2 Structure and Copper Electronic State on Activity of Cu/ZrO2 Catalysts in Methanol Synthesis from CO2, ACS Catal., 2014, 4, 3730–3741 CrossRef CAS.
- M. C. Campa, G. Ferraris, D. Gazzoli, I. Pettiti and D. Pietrogiacomi, Rhodium supported on tetragonal or monoclinic ZrO2 as catalyst for the partial oxidation of methane, Appl. Catal., B, 2013, 142–143, 423–431 CrossRef CAS.
- M. Yamasaki, H. Habazaki, K. Asami, K. Izumiya and K. Hashimoto, Effect of tetragonal ZrO2 on the catalytic activity of Ni/ZrO2 catalyst prepared from amorphous Ni–Zr alloys, Catal. Commun., 2006, 7, 24–28 CrossRef CAS.
- S. Jaenicke, G. K. Chuah, V. Raju and Y. T. Nie, Structural and Morphological Control in the Preparation of High Surface Area Zirconia, Catal. Surv. Asia, 2008, 12, 153–169 CrossRef CAS.
- M. Li, Z. Feng, G. Xiong, P. Ying, Q. Xin and C. Li, Phase Transformation in the Surface Region of Zirconia Detected by UV Raman Spectroscopy, J. Phys. Chem. B, 2001, 105, 8107–8111 CrossRef CAS.
- D. A. Ward and E. I. Ko, Synthesis and structural transformation of zirconia aerogels, Chem. Mater., 1993, 5, 956–969 CrossRef CAS.
- G. Xu, Y.-W. Zhang, B. Han, M.-J. Li, C. Li and C.-H. Yan, Unusual calcination temperature dependent tetragonal–monoclinic transitions in rare earth-doped zirconia nanocrystals, Phys. Chem. Chem. Phys., 2003, 5, 4008–4014 RSC.
- L. Zhang, C. Han, H. Wang, H. Pu, D. Du, J. Li and Y. Luo, One-step synthesis of mesoporous nanosized sulfated zirconia via liquid-crystal template (LCT) method, Mater. Res. Bull., 2012, 47, 3931–3936 CrossRef CAS.
- S.-Y. Chen, L.-Y. Jang and S. Cheng, Synthesis of thermally stable zirconia-based mesoporous materials via a facile post-treatment, J. Phys. Chem. B, 2006, 110, 11761–11771 CrossRef CAS PubMed.
- Y. J. Wang, H. Yuan and H. Zhang, Preparation, characterization and application of ordered mesoporous sulfated zirconia, Res. Chem. Intermed., 2019, 45, 1073–1086 CrossRef CAS.
- V. G. Deshmane and Y. G. Adewuyi, Mesoporous nanocrystalline sulfated zirconia synthesis and its application for FFA esterification in oils, Appl. Catal., A, 2013, 462–463, 196–206 CrossRef CAS.
- S. J. Sekewael, R. A. Pratika, L. Hauli, A. K. Amin, M. Utami and K. Wijaya, Recent Progress on Sulfated Nanozirconia as a Solid Acid Catalyst in the Hydrocracking Reaction, Catalysts, 2022, 12, 191 CrossRef CAS.
- T. Yamaguchi, Alkane isomerization and acidity assessment on sulfated ZrO2, Appl. Catal., A, 2001, 222, 237–246 CrossRef CAS.
- W. Gac, W. Zawadzki, M. Rotko, G. Słowik and M. Greluk, CO2 Methanation in the Presence of Ce-Promoted Alumina Supported Nickel Catalysts: H2S Deactivation Studies, Top. Catal., 2019, 62, 524–534 CrossRef CAS.
- P. D. L. Mercera, J. G. van Ommen, E. B. M. Doesburg, A. J. Burggraaf and J. R. H. Ross, Stabilized tetragonal zirconium oxide as a support for catalysts, Appl. Catal., 1991, 78, 79–96 CrossRef CAS.
- H. Che, S. Han, W. Hou, A. Liu, S. Wang, Y. Sun and X. Cui, Mesoporous nanocrystalline zirconium oxide: novel preparation and photoluminescence property, J. Porous Mater., 2011, 18, 57–67 CrossRef CAS.
- S. Sato, R. Takahashi, T. Sodesawa, S. Tanaka, K. Oguma and K. Ogura, High-Surface-Area SiO2–ZrO2 Prepared by Depositing Silica on Zirconia in Aqueous Ammonia Solution, J. Catal., 2000, 196, 190–194 CrossRef CAS.
- S.-F. Yin and B.-Q. Xu, On the preparation of high-surface-area nano-zirconia by reflux-digestion of hydrous zirconia gel in basic solution, ChemPhysChem, 2003, 4, 277–281 CrossRef CAS PubMed.
- H.-K. Min, Y. W. Kim, C. Kim, I. A. M. Ibrahim, J. W. Han, Y.-W. Suh, K.-D. Jung, M. B. Park and C.-H. Shin, Phase transformation of ZrO2 by Si incorporation and catalytic activity for isopropyl alcohol dehydration and dehydrogenation, Chem. Eng. J., 2022, 428, 131766 CrossRef CAS.
- G. K. Chuah, S. Jaenicke, S. A. Cheong and K. S. Chan, The influence of preparation conditions on the surface area of zirconia, Appl. Catal., A, 1996, 145, 267–284 CrossRef CAS.
- M. Rezaei, S. M. Alavi, S. Sahebdelfar, Z.-F. Yan, H. Teunissen, J. H. Jacobsen and J. Sehested, Synthesis of pure tetragonal zirconium oxide with high surface area, J. Mater. Sci., 2007, 42, 1228–1237 CrossRef CAS.
- N. Nahas, P. Afanasiev, C. Geantet, M. Vrinat, F. Wiss and S. Dahar, On the mechanism of zirconia textural stabilization by siliceous species during digestion under basic conditions, J. Catal., 2007, 247, 51–60 CrossRef CAS.
- F. del Monte, W. Larsen and J. D. Mackenzie, Stabilization of Tetragonal ZrO2 in ZrO2–SiO2 Binary Oxides, J. Am. Ceram. Soc., 2000, 83, 628–634 CrossRef CAS.
- P. D. L. Mercera, J. G. van Ommen, E. B. M. Doesburg, A. J. Burggraaf and J. R. H. Ross, Zirconia as a Support for Catalysts, Appl. Catal., 1990, 57, 127–148 CrossRef CAS.
- V. S. Nagarajan and K. J. Rao, Crystallization studies of ZrO2-SiO2 composite gels, J. Mater. Sci., 1989, 24, 2140–2146 CrossRef CAS.
- F. del Monte, W. Larsen and J. D. Mackenzie, Chemical Interactions Promoting the ZrO2 Tetragonal Stabilization in ZrO2–SiO2 Binary Oxides, J. Am. Ceram. Soc., 2000, 83, 1506–1512 CrossRef CAS.
- G. Aguila, S. Guerrero, F. Gracia and P. Araya, Improvement of the thermal stability of hydrous zirconia by post-synthesis treatment with NaOH and NH4OH solutions, Appl. Catal., A, 2006, 305, 219–232 CrossRef CAS.
- P. Nayak, B. B. Nayak and A. Mondal, Surfactant assisted synthesis of high surface area ceria modified mesoporous tetragonal zirconia powder and its chromium adsorption study, Mater. Chem. Phys., 2011, 127, 12–15 CrossRef CAS.
- U. Ciesla, M. Fröba, G. Stucky and F. Schüth, Highly Ordered Porous Zirconias from Surfactant-Controlled Syntheses: Zirconium Oxide–Sulfate and Zirconium Oxo Phosphate, Chem. Mater., 1999, 11, 227–234 CrossRef CAS.
- E. Zhao, O. Hernández, G. Pacheco and J. J. Fripiat, Thermal behaviour and texture of mesoporous zirconia obtained from anionic surfactants, J. Mater. Chem., 1998, 8, 1635–1640 RSC.
- P. Yang, D. Zhao, D. I. Margolese, B. F. Chmelka and G. D. Stucky, Block Copolymer Templating Syntheses of Mesoporous Metal Oxides with Large Ordering Lengths and Semicrystalline Framework, Chem. Mater., 1999, 11, 2813–2826 CrossRef CAS.
- D. Gu, W. Schmidt, C. M. Pichler, H.-J. Bongard, B. Spliethoff, S. Asahina, Z. Cao, O. Terasaki and F. Schüth, Surface-Casting Synthesis of Mesoporous Zirconia with a CMK-5-Like Structure and High Surface Area, Angew. Chem., Int. Ed., 2017, 56, 11222–11225 CrossRef CAS PubMed.
- M. J. Hudson and J. A. Knowles, Preparation and characterisation of mesoporous, high-surface-area zirconium(IV) oxide, J. Mater. Chem., 1996, 6, 89–95 RSC.
- M. Mokhtar, S. N. Basahel and T. T. Ali, Effect of synthesis methods for mesoporous zirconia on its structural and textural properties, J. Mater. Sci., 2013, 48, 2705–2713 CrossRef CAS.
- U. K. H. Bangi and H.-H. Park, Evolution of textural characteristics of surfactant-mediated mesoporous zirconia aerogel powders prepared via ambient pressure drying route, Int. Nano Lett., 2018, 8, 221–228 CrossRef CAS.
- R. Liu and C.-a. Wang, Synthesis of aluminum-doped mesoporous zirconia with improved thermal stability, Microporous Mesoporous Mater., 2014, 186, 1–6 CrossRef CAS.
- G. Huang, W. Li and Y. Song, Preparation of SiO2–ZrO2 xerogel and its application for the removal of organic dye, J. Sol-Gel Sci. Technol., 2018, 86, 175–186 CrossRef CAS.
- K. Cassiers, T. Linssen, K. Aerts, P. Cool, O. Lebedev, G. van Tendeloo, R. van Grieken and E. F. Vansant, Controlled formation of amine-templated mesostructured zirconia with remarkably high thermal stability, J. Mater. Chem., 2003, 13, 3033 RSC.
- L. D'Souza, A. Suchopar, K. Zhu, D. Balyozova, M. Devadas and R. M. Richards, Preparation of thermally stable high surface area mesoporous tetragonal ZrO2 and Pt/ZrO2: an active hydrogenation catalyst, Microporous Mesoporous Mater., 2006, 88, 22–30 CrossRef.
- V. G. Deshmane and Y. G. Adewuyi, Synthesis of thermally stable, high surface area, nanocrystalline mesoporous tetragonal zirconium dioxide (ZrO2): effects of different process parameters, Microporous Mesoporous Mater., 2012, 148, 88–100 CrossRef CAS.
- A. Peters, F. Nouroozi, D. Richter, M. Lutecki and R. Gläser, Nickel-Loaded Zirconia Catalysts with Large Specific Surface Area for High-Temperature Catalytic Applications, ChemCatChem, 2011, 3, 598–606 CrossRef CAS.
- B. Stolze, J. Titus, S. A. Schunk, A. Milanov, E. Schwab and R. Gläser, Stability of Ni/SiO2-ZrO2 catalysts towards steaming and coking in the dry reforming of methane with carbon dioxide, Front. Chem. Sci. Eng., 2016, 10, 281–293 CrossRef CAS.
- A. A. Coelho and Bruker AXS, TOPAS and TOPAS-Academic: an optimization program integrating computer algebra and crystallographic objects written in C++, J. Appl. Crystallogr., 2018, 51, 210–218 CrossRef CAS.
- H. M. Rietveld, Line profiles of neutron powder-diffraction peaks for structure refinement, Acta Crystallogr., 1967, 22, 151–152 CrossRef CAS.
- H. M. Rietveld, A profile refinement method for nuclear and magnetic structures, J. Appl. Crystallogr., 1969, 2, 65–71 CrossRef CAS.
- S. Brunauer, P. H. Emmett and E. Teller, Adsorption in Gases in Multimolecular Layers, J. Am. Chem. Soc., 1938, 60, 309–319 CrossRef CAS.
- E. P. Barrett, L. G. Joyner and P. P. Halenda, The Determination of Pore Volume and Area Distributions in Porous Substances, J. Am. Chem. Soc., 1951, 73, 373–380 CrossRef CAS.
- M. Thommes, K. Kaneko, A. V. Neimark, J. P. Olivier, F. Rodriguez-Reinoso, J. Rouquerol and K. S. W. Sing, Physisorption of gases, with special reference to the evaluation of surface area and pore size distribution (IUPAC Technical Report), Pure Appl. Chem., 2015, 87, 1051–1069 CrossRef CAS.
- S. Lowell, Characterization of porous solids and powders. Surface area, pore size and density, Springer, Dordrecht, 1st edn, 2010 Search PubMed.
- Y. Liu and Y. Sun, Preparation of tailored pore size mesoporous zirconia with enhanced thermal stability via controlled sol-gel process, Stud. Surf. Sci. Catal., 2005, 156, 249–256 CrossRef CAS.
Footnote |
| † Electronic supplementary information (ESI) available. See https://doi.org/10.1039/d2ra01459a |
| This journal is © The Royal Society of Chemistry 2022 |

