 Open Access Article
Matrix-assisted laser desorption/ionization time-of-flight mass spectrometry combined with chemometrics to identify the origin of Chinese medicinal materials†
Huan Fang‡
a,
Yue Chen‡a,
Hai-Long Wu *a,
Yao Chen*ab,
Tong Wanga,
Jian Yangc,
Hai-Yan Fud,
Xiao-Long Yang
 d,
Xu-Fu Lie and
Ru-Qin Yu
 a
a
aState Key Laboratory of Chemo/Biosensing and Chemometrics, College of Chemistry and Chemical Engineering, Hunan University, Changsha, 410082, PR China. E-mail: hlwu@hnu.edu.cn; chenyao717@hnu.edu.cn
bHunan Key Lab of Biomedical Materials and Devices, College of Life Sciences and Chemistry, Hunan University of Technology, Zhuzhou, 412008, PR China
cNational Resource Center for Chinese Materia Medica, China Academy of Chinese Medical Sciences, State Key Laboratory Breeding Base of Dao-di Herbs, Beijing, 100700, PR China
dThe Modernization Engineering Technology Research Center of Ethnic Minority Medicine of Hubei Province, School of Pharmaceutical Sciences, South-Central University for Nationalities, Wuhan, 430074, PR China
eBeijing Tongrentang Pingjiang Atractylodes Macrocephala Koidz Co., Ltd, Pingjiang, 414500, PR China
First published on 7th June 2022
Abstract
Geographical origin and authenticity are two core factors to promote the development of traditional Chinese medicine (TCM) herbs perception in terms of quality and price. Therefore, they are important to both sellers and consumers. Herein, we propose an efficient, accurate method for discrimination of genuine and non-authentic producing areas of TCM by matrix-assisted laser desorption/ionization time-of-flight mass spectrometry (MALDI-TOF MS). Take Atractylodes macrocephala Koidz (AMK) of compositae as an example, the MALDI-TOF MS spectra data of 120 AMK samples aided by principal component analysis-linear discriminant analysis (PCA-LDA), partial least squares discriminant analysis (PLS-DA) and random forest (RF) successfully differentiated Zhejiang province, Anhui province and Hunan province AMK according to their geographical location of origin. The correct classification rates of test set were above 93.3%. Furthermore, 5 recollected AMK samples were used to verify the performance of the classification models. The outcome of this study can be a good resource in building a database for AMK. The combined utility of MALDI-TOF MS and chemometrics is expected to be expanded and applied to the origin traceability of other TCMs.
1 Introduction
In China and some eastern Asian countries, traditional Chinese medicines (TCMs) have been widely used for the prevention and treatment of human diseases since thousands of years ago.1,2 Among them, authentic medicinal materials, also called “Dao-di” medicinal materials by the Chinese, usually refer to medicinal materials that come from a specific producing area, have a long planting history, fine cultivation techniques, good quality, and remarkable curative effects. They are generally used as a synonym for high-quality medicinal materials.3 With the continuous expansion and deepening of the research field of traditional Chinese medicine, the quality and effective ingredients of TCMs have attracted more and more attention. In China's traditional Chinese medicines, it pays great attention to the origin of TCMs. Therefore, regionalism is closely related to the quality and curative effect of TCMs. TCMs come from the different origin, its nature, efficacy and price will have obvious differences.4,5 However, in the process of “modernization” and “globalization” of TCMs, in order to gain more benefits, some unscrupulous businesses always create false label, such as non-authentic medicinal materials pretend to be authentic medicinal materials.6 That may increase the risk of accidents in TCMs which will affect the export of Chinese herbal. On the other hand, it also has a negative impact on the safe use of traditional Chinese medicine in TCM clinical. Therefore, it is urgent to implement a geographic traceability system for traditional Chinese medicines to provide convenient information records and geographic traceability for the circulation of traditional Chinese medicines.Many methods were developed for the analysis of the origin of TCMs, such as high-performance liquid chromatography (HPLC),7 attenuated total reflection-Fourier-transform mid-infrared (ATR-FTMIR) spectroscopy,8 gas chromatography (GC),9 liquid chromatography-mass spectrometry (LC-MS),10 gas chromatography-mass spectrometry (GC-MS),11 stable isotope.12 However, these instruments still have some limitations, such as time-consuming, laborious and large sample size required. Matrix-assisted laser desorption/ionization time-of-flight mass spectrometry (MALDI-TOF MS), a soft ionization technique, has the characteristics of large mass range, high ion detection sensitivity, high salt and buffer tolerance, simple and fast analysis.13 MALDI-TOF MS is a powerful tool that can be used to analyze bioactive ingredients in TCMs rapidly without complex pretreatment steps. Recently, MALDI-TOF MS was becoming a common method on the quality estimation of TCMs.14–16
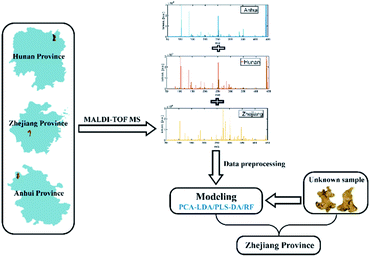
In this research, our goal is to determine the fingerprints of TCMs from different sources by using MALDI-TOF MS, as well as to combine pattern recognition methods to discriminate the samples on the basis of geographical origin. Taking Atractylodes macrocephala Koidz (AMK) of compositae as an example, it is an important and common traditional Chinese medicine, which has the functions of invigorating spleen and stomach, moistening water and preventing perspiration.17–19 AMK in Zhejiang province is considered as the authentic medicinal material, compared with other producing areas, it has the highest nutritional value and market price. The flow chart for geographical origin traceability of AMK is shown in Fig. 1. Firstly, the experimental conditions were optimized, including the optimization of matrix, extraction solvent and AMK weight. Secondly, the obtained MALDI-TOF MS data were pre-processed in order to reduce invalid information and extract effective variables. In addition, 13 major bioactive components in AMK samples were analyzed. Thirdly, the data of 120 AMK samples were divided into 90 training samples (3/4) and 30 test samples (1/4) by a random sampling method, and then three chemometrics methods, namely principal component analysis-linear discriminant analysis (PCA-LDA), partial least squares discriminant analysis (PLS-DA) and random forest (RF), were adopted to build the classification models, respectively. Finally, 5 new AMK samples were further used to prove the practicability of the proposed methods.
2 Experiment
2.1 Chemicals and reagents
13 bioactive standards including atractylenolide I (AT I), atractylenolide II (AT II), atractylenolide III (AT III), trans-2,4-decadienal (DEC), atractylodin (ATLODIN), atractylon (ATLON), costunlide (COS), luteolin (LUT), caffeic acid (CAF), scopoletin (SCO), 7-hydroxycoumarin (HYD), β-eudesmol (EUD), α-caryophyllene (CAR) were collected and their detailed information are shown in Table S1.† These 13 bioactive components have been reported more frequently.17,20 According to the Chinese Pharmacopoeia, these bioactive components play important roles in anti-tumor, anti-inflammatory, regulating digestive system and glucose and lipid metabolism. MALDI-TOF MS matrices including α-cyano-4-hydroxycinnamic acid (HCCA), sinapinic acid (SA), and 2,5-dihydroxybenzoic acid (DHB), 3-hydroxypicolinic acid (HPA), dithranol (DI) and 5,10,15,20-tetrakis(pentafluorophenyl)porphyrin (TP) were purchased from Sigma-Aldrich. Trifluoroacetic acid (TFA) was purchased from International Laboratory U.S.A. (San Bruno, CA). Methanol, ethanol, acetonitrile, trichloromethane and n-hexane were all chromatographic grades and purchased from OCEANPAK Company (Germany).2.2 Sample collection
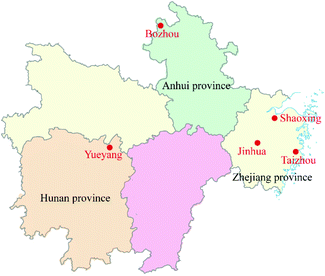
AMK cultivated in Zhejiang Province is usually regarded as the “Dao-di” medicinal materials, which means it has higher medical value and price. Meanwhile, Hunan and Anhui are two of the largest AMK production areas, and their planting scales both exceed 10 km2. The medical parts (rhizome) of 120 fresh AMK samples were collected based on the five-point sampling method, including 45 samples from Bozhou City, Anhui province, 45 samples from Yueyang City, Hunan province and 30 samples from Jinhua, Taizhou, Shaoxing, Zhejiang province. The sampling location of AMK is indicated in Fig. 2. Detailed sampling information including sampling date, elevation, temperature, humidity and so on are shown in Table S2.† All AMK samples were cultivated for the same time and in the mature stage in the experiment, and the picking interval was not more than one week to ensure that the samples of AMK were all in the same developmental stage. In this study, 3/4 samples of AMK from Anhui province, Hunan province and Zhejiang province were selected as the training set to build models and optimize parameters, and the remaining 1/4 samples were selected as the test set to test the classification performance of these models. After the classification models were established, 5 additional AMK samples were collected to further prove the practicality of these models.2.3 Sample preparation
The drying of AMK samples refers to the following traditional Chinese processing technology, and the processing of each batch is consistent. Firstly, 150–200 kg fresh AMK samples were washed, and then baked for 2–3 h under 60–70 °C. Each oven can only be put AMK samples from the same origin. After 2–3 h, AMK samples were turn up and down once, and then baked for 2–3 h until the roots of AMK were completely dry. Remove AMK samples from the oven, remove the fibrous roots of AMK and put it on the drying rack to let the water inside the AMK slowly ooze out. After 24 h, the stacked AMK was placed in the oven and baked at 60 °C for 24 h. Then, the AMK samples were taken out and placed on the drying rack for 24 h to make the internal moisture slowly penetrate outwards and the skin of AMK became soft. Repeat the process for a day until there was no moisture on the surface of the AMK.The dry AMK samples were crushed and sieved for 80 mesh to obtain AMK powder. A certain amount of AMK powder was dissolved in acetonitrile, performing ultrasound for 20 min, standing for 24 h, and then centrifuged for 2 min at 4000 rpm. The supernatant was placed in a 2 mL centrifuge tube and stored in 4 °C.
2.4 Instrument, parameters and conditions
The MALDI sample matrixes HCCA, SA, DHB, HPA and DI were dissolved in TA50 solution (ACN![[thin space (1/6-em)]](https://www.rsc.org/images/entities/char_2009.gif) :
:![[thin space (1/6-em)]](https://www.rsc.org/images/entities/char_2009.gif) 0.1% TFA-H2O, V/V = 50/50) and TP was dissolved in chloroform at a concentration of 10 mg mL−1. 1 mg mL−1 and 5 mg mL−1 HCCA were also prepared. An aliquot of 1 μL of AMK sample matrix solution (VAMK/Vmatrix = 50/50) was manually spotted onto the stainless steel target plate (Bruker Daltonics). The droplet was air-dried at room temperature, and the sample was analyzed on an Ultraflextreme MALDI-TOF/TOF MS (Bruker Daltonics, Germany) equipped with a 355 nm and 2 kHz solid state Nd:YAG Smart Beam laser. Voltage settings for the ion source 1, source 2, lens, reflector 1 and reflector 2 were 19.99 kV, 17.64 kV, 8.01 kV, 21.08 kV and 11.03 kV, respectively. The ratio of laser output power and delayed extraction time were set to 100% and 140 ns, respectively. Each mass spectrum was obtained within the mass-to-charge ratio (m/z) range of 0–660 in positive ion mode by accumulation of 50 laser shots with a repetitive frequency of 1000 Hz. Each AMK sample was analyzed five times at different points based on five-point sampling method. Blank sample of each matrix was also tested five times.
0.1% TFA-H2O, V/V = 50/50) and TP was dissolved in chloroform at a concentration of 10 mg mL−1. 1 mg mL−1 and 5 mg mL−1 HCCA were also prepared. An aliquot of 1 μL of AMK sample matrix solution (VAMK/Vmatrix = 50/50) was manually spotted onto the stainless steel target plate (Bruker Daltonics). The droplet was air-dried at room temperature, and the sample was analyzed on an Ultraflextreme MALDI-TOF/TOF MS (Bruker Daltonics, Germany) equipped with a 355 nm and 2 kHz solid state Nd:YAG Smart Beam laser. Voltage settings for the ion source 1, source 2, lens, reflector 1 and reflector 2 were 19.99 kV, 17.64 kV, 8.01 kV, 21.08 kV and 11.03 kV, respectively. The ratio of laser output power and delayed extraction time were set to 100% and 140 ns, respectively. Each mass spectrum was obtained within the mass-to-charge ratio (m/z) range of 0–660 in positive ion mode by accumulation of 50 laser shots with a repetitive frequency of 1000 Hz. Each AMK sample was analyzed five times at different points based on five-point sampling method. Blank sample of each matrix was also tested five times.
2.5 Software and procedures
Experimental data were treated by MATLAB. PCA-LDA and PLS-DA were achieved by using classification-toolbox 5.1 (ref. 21) and RF was written by ourself based on the original literature.21 The data and other home-made codes used in this study are available if necessary.2.6 Data analysis
All samples were analyzed by MALDI-TOF MS and each sample was measured five times based on five-point sampling method. First of all, the range of MS data was selected from 50 to 450 m/z to remove invalid information, and the data size of each test is 1 × 124![[thin space (1/6-em)]](https://www.rsc.org/images/entities/char_2009.gif) 817. Secondly, the Savitzky–Golay method was used to smooth each test data,23 and then the five measured data of the same sample were simply added. Therefore, considering 120 AMK samples, a data matrix with the size of 120 × 124
817. Secondly, the Savitzky–Golay method was used to smooth each test data,23 and then the five measured data of the same sample were simply added. Therefore, considering 120 AMK samples, a data matrix with the size of 120 × 124![[thin space (1/6-em)]](https://www.rsc.org/images/entities/char_2009.gif) 817 can be obtained. In addition, MS channels with a background intensity greater than 2 and MS channels with signal intensity less than 5 in all samples are not analyzed, so the data size can be further reduced to 120 × 61
817 can be obtained. In addition, MS channels with a background intensity greater than 2 and MS channels with signal intensity less than 5 in all samples are not analyzed, so the data size can be further reduced to 120 × 61![[thin space (1/6-em)]](https://www.rsc.org/images/entities/char_2009.gif) 373 (number of samples × number of m/z channels). At last, one-way analysis of variance (one-way ANOVA) was used for variable selection and data feature reduction. The first 1000 important variables were selected, and the size of the final data matrix was 120 × 1000 for chemometrics modeling. The 120 AMK samples were divided into two parts: 90 samples (three-fourths of the total samples) were treated as the training set, while another 30 samples (a quarter of the total samples) were treated as the test set. Therefore, the matrix size of the training set is 90 × 1000, and the matrix size of the test set is 30 × 1000.
373 (number of samples × number of m/z channels). At last, one-way analysis of variance (one-way ANOVA) was used for variable selection and data feature reduction. The first 1000 important variables were selected, and the size of the final data matrix was 120 × 1000 for chemometrics modeling. The 120 AMK samples were divided into two parts: 90 samples (three-fourths of the total samples) were treated as the training set, while another 30 samples (a quarter of the total samples) were treated as the test set. Therefore, the matrix size of the training set is 90 × 1000, and the matrix size of the test set is 30 × 1000.
The following methods were used to perform statistical analysis of the pre-processed mass spectrum data: (1) Principal component analysis-linear discriminant analysis (PCA-LDA),24 principal component analysis (PCA) was first used for data dimensionality reduction, and then the use of linear discriminant analysis (LDA) was based on the scores of PCs. LDA defines a low-dimensional hyperplane where the points will be projected from the higher dimension and maximizes the ratio of between-class variance and minimize the ratio of within class variance. (2) Partial least squares discriminant analysis (PLS-DA)25 is a multivariate statistical analysis method for discriminant analysis and can provide graphical visualization. The key to construct PLS-DA model is to search for LVs with a maximum covariance with the Y-variables. At the same time, it should be noted that the choice of the number of variables is crucial to the classification results of PLS-DA method. In some cases, if the number of variables exceeds the number of samples, the final classification results may appear over-fitting.26 (3) Random forest (RF), first proposed by Leo Breiman,22 which uses bootstrap resampling method to select multiple samples from the original data set, build a decision tree model for each bootstrap resampling, and then combine the predictions of multiple decision trees, and get the final prediction results through voting. RF is one of the best classification algorithms with high prediction accuracy, good tolerance to outliers and noise, and is not prone to overfitting.
3 Results and discussion
3.1 The optimization of experimental conditions
3.2 MS profiles of AMK samples
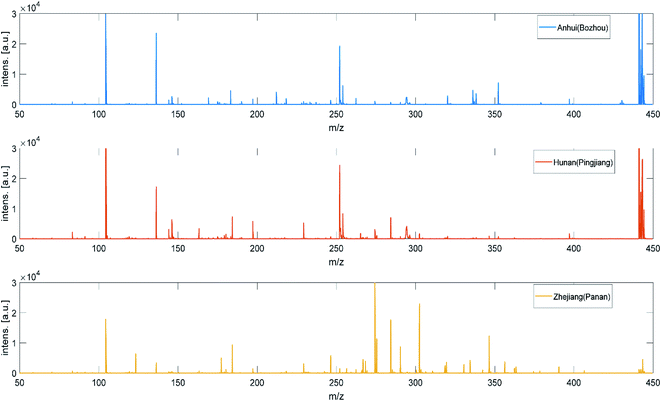
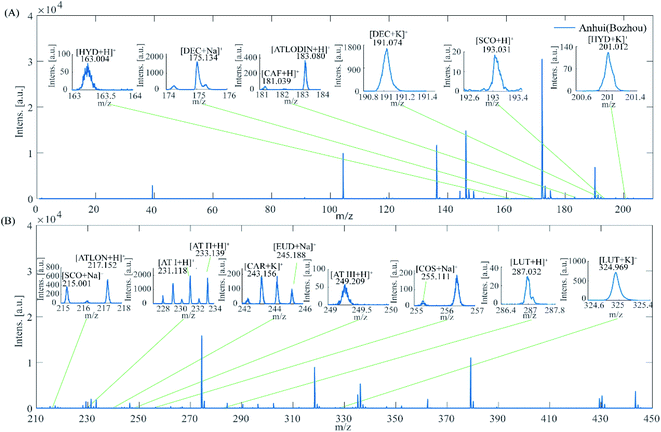
MALDI-TOF MS has been considered as an excellent tool to investigate TCMs profiles. However, few studies have researched MALDI-TOF MS suitability to evaluate the authentic medicinal materials. Herein, we attempted to develop an efficient method to characterize the AMK and to discriminate the AMK samples according to geographical origin by using MALDI-TOF MS. For this purpose, 120 AMK samples from 3 provinces, 45 samples from Bozhou City, Anhui province, 45 samples from Yueyang City, Hunan province and 30 samples from Jinhua, Taizhou, Shaoxing, Zhejiang province, were analyzed. In Fig. 3, one representative example MS profile of each type is illustrated. Peaks with 0 to 450 m/z can be well observed.AMK has various bioactive components, such as AT I, AT II, AT III, DEC, ATLODIN, ATLON, COS, LUT, CAF, SCO, HYD, EUD and CAR. As can be seen from the Fig. 4, some peaks could be assigned to bioactive components by comparison with their standard MS. Besides, sodium adduct [M + Na]+ and potassium adduct [M + K]+ ions were also observed in positive ion mode. The m/z peaks at 163.004, 175.134, 181.039, 183.080, 191.074 and 193.031, 201.012 were confirmed to be the major m/z peaks of HYD, DEC, CAF, ATLODIN, DEC, SCO and HYD in the range of 0–210 m/z, respectively. The m/z peaks at 215.001, 217.152, 231.118, 233.139, 243.156, 245.188, 249.209, 255.111 and 287.032 (324.969) were corresponding to SCO, ATLON, AT I, AT II, CAR, EUD, AT III, COS, LUT in the range of 210–450 m/z, respectively. The ion intensity of DEC, AT I and AT II are stronger than the other 10 active ingredients, and AT I and AT II are the main active ingredients with higher concentrations in AMK samples. The observed masses of protonated ions and adducts with Na+ and K+ for the main active compounds and their errors (ppm) with the calculated mass were shown in Table S3.† Under the proposed experimental conditions, the mass accuracy is within 150 ppm, which may be due to the following reasons: (1) the resolution of the mass spectrometer itself is limited; (2) the molecular weight of the analytes studied is relatively small (<600 m/z); (3) the uniformity and flatness of the measured crystals also affect the accuracy of the MALDI-TOF MS. Those m/z peaks could be used as fingerprints to identify the geographical origin of AMK samples. Based on this, the position and intensity of MS peaks among three provinces were compared in Fig. 3. Their MS data had high similarity to each another, but the relative peaks intensities were different. Compared with the Hunan and Anhui AMK samples, MS peaks of Zhejiang AMK samples were more abundant and stronger in the range of 260–400 m/z which can be related to LUT. Meanwhile, Anhui AMK samples have the most abundant MS peaks in the range of 200–250 m/z which can be related to HYD, SCO, ATLON, AT I, AT II, CAR and EUD. Among the detected bioactive compounds, AT I, AT II and LUT always present relatively higher signal intensity. Moreover, MS peaks of Hunan AMK sample are more abundant and stronger than the other two in the range of 140–190 m/z.
Before establishing the classification model, one-way ANOVA was used to extract the 1000 most important variables from MALDI-TOF MS data, and the selected variables was showed in Fig. S5.† The differences of AMK samples in the three provinces were mainly between 125–185, 270–330 and 350–440 m/z, and the corresponding characteristic active components included HYD, DEC, CAF, ATLCODIN and LUT. This variation can be attributed to the different geographic locations of the AMK samples used in this study. The statistically significant MS peaks in different AMK samples provide the basis for subsequent classification.
3.3 Discrimination of AMK samples from different origins
PCA-LDA, PLS-DA and RF classification methods were used to classify 120 AMK in three different regions. The parameter optimization process of PCA-LDA and PLS-DA is showed in Fig. S6.† As can be seen from Fig. S6A,† when the PCs of PCA-LDA gradually increases to 16, the CCRs of cross-validation present an upward trend and reach the maximum value of 94.4%. The CCRs of training set and test set are also relatively high, which are 98.9% and 93.3%, respectively. Fig. S6B† shows the optimal LVs for PLS-DA was 7, because the best CCR for cross-validation is 91.1% and the CCR for training set is 100%. As to Fig. S6C,† the number of decision trees increases from 70 to 100, the out-of-bag (OOB) error decreases successively. However, when the number of decision trees increase from 100 to 120, the OOB error increases. Therefore, the optimal number of decision trees is set as 100, and the OOB error is 13.3%.The scores plot of PCA-LDA and PLS-DA are shown in Fig. 5. By using the scores of canonical variables and first two LVs for plotting, the performance of PCA-LDA and PLS-DA can be evaluated visually, respectively. The specific classification results are shown in the Table 1. For PLS-DA model, the CCRs of cross-validation, training set and test set were 91.1%, 100% and 96.7%, respectively, which was better than the classification result of PCA-LDA. For RF model, the CCRs of training set and test set were 98.9% and 100.0%, respectively. The results indicate that three classification models can correctly classify AMK samples from different origins. As a supplement, some classification parameters, such as sensitivity and specificity of cross-validation (CV), training set and test set, and the confusion matrix of three models are listed in Tables S4 and S5,† respectively. Sensitivity and specificity of cross-validation (CV), training set and test set obtained by using PCA-LDA, PLS-DA and RF were all greater than 90.0%. By contrast, the classification performance of RF and PLS-DA is slightly better than that of PCA-LDA, and it is more suitable for the geographical origin traceability of AMK samples.
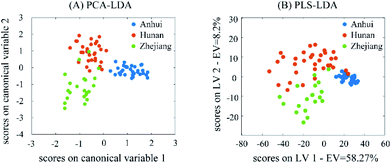 | ||
| Fig. 5 The plots of the scores on the first two canonical variables (CVs) of PCA-LDA (A) and the first two latent variables (LVs) of PLS-DA (B). | ||
| PCA-LDA | PLS-DA | RF | |||||||||
|---|---|---|---|---|---|---|---|---|---|---|---|
| CVsa | CVb | Training | Test | LVsc | CV | Training | Test | Td | OOBe | Training | Test |
| a CVs is the number of canonical variables.b CV is cross-validation.c LVs is the number of latent variables.d T is the number of decision tree.e OOB is the out-of-bag error. | |||||||||||
| 16 | 94.4 | 98.9 | 93.3 | 7 | 91.1 | 100.0 | 96.7 | 100 | 13.3 | 98.9 | 100.0 |
In addition, 5 new AMK samples were taken to verify the reliability of the PCA-LDA, PLS-DA and RF models established previously. The pre-treatment methods and instrument conditions are the same as previously mentioned. The CCRs of 100% were obtained for prediction set, which confirmed that 5 AMK samples were correctly classified into Zhejiang province and the proposed methods that could be well applied to the geographical origin traceability of AMK samples. The proposed method of MALDI-TOF MS combined with PCA-LDA, PLS-DA and RF can be a power tool for discrimination and further quality monitoring of TCMs to ensure the safety and standardization of the Chinese medicine market.
4 Conclusions
This study demonstrates AMK samples produced in three provinces present different MALDI-TOF MS profiles, which can provide a basis for the establishment of geographic traceability database of TCM. This rapid and efficient method was mainly developed to identify authentic medicinal materials, TCM fraud and counterfeiting in Chinese medicinal materials (CMM) markets. Combining MALDI-TOF MS data with PCA-LDA, PLS-DA and RF models can successfully discriminate AMK in Zhejiang province, Hunan province and Anhui province according to geographical origin. The experimental results show that all classification models obtain above 93.3% CCRs for test set, among which the CCR of the RF model is 100%. That means RF has a greater competent for the geographical origin traceability of AMK. In addition, the proposed models correctly distinguish the origin of newly collected AMK samples, which further proves the practical performance of these models. Based on the above results, it is indicated that chemometrics assisted MALDI-TOF MS methodology proposed in this work facilitated the high throughput analysis of the TCM herbs, which shows a great potential for further development. Also, it provides an efficient way for geographic traceability of authentic medicinal materials.Conflicts of interest
There are no conflicts to declare.Acknowledgements
The authors acknowledge the financial support of the National Key R&D Program of China (No. 2020YFC1712700), the National Natural Science Foundation of China (No. 22174036, 21775039, 21575039, 21705044), and the Scientific Research Project of The Education Department of Hunan Province (No. 19C0554).References
- X. Liu, W. Jiang, M. Su, Y. Sun, H. Liu, L. Nie and H. Zang, J. Sep. Sci., 2020, 43, 6–17 CrossRef CAS PubMed.
- J. Jing, H. S. Parekh, M. Wei, W. C. Ren and S. B. Chen, TrAC, Trends Anal. Chem., 2013, 44, 39–45 CrossRef CAS.
- S.-J. Chiou, J. H. Yen, C. L. Fang, H. L. Chen and T. Y. Lin, Planta Med., 2007, 73, 1421–1426 CrossRef CAS PubMed.
- Z. Zhao, P. Guo and E. Brand, J. Ethnopharmacol., 2012, 140, 476–481 CrossRef.
- Z. S. Tang, Y. R. Liu, Y. Lv, J. A. Duan, S. Z. Chen, J. Sun, Z. X. Song, X. M. Wu and L. Liu, Phytomedicine, 2018, 44, 258–269 CrossRef CAS PubMed.
- G. H. Lu, Q. Zhou, S. Q. Sun, K. S. Y. Leung, H. Zhang and Z. Z. Zhao, J. Mol. Struct., 2008, 883, 91–98 CrossRef.
- J. Zhou, Y. Li, J. Zhao, X. Xue, L. Wu and F. Chen, Food Chem., 2008, 108, 749–759 CrossRef CAS.
- Y. F. Pei, L. H. Wu, Q. Z. Zhang and Y. Z. Wang, Anal. Methods, 2019, 11, 113–122 RSC.
- J. J. Xie, X. F. Chen, W. R. Chen, Y. Yao, Z. Y. Yuan, X. S. Zhou, E. E. I. Guangdong and B. Quarantine, Food Sci., 2013, 2013, 18 Search PubMed.
- Z. Pan, F. Xiong, Y. L. Chen, G. G. Wan, Y. Zhang, Z. W. Chen, W. F. Cao and G. Y. Zhou, Molecules, 2019, 24, 4478 CrossRef CAS PubMed.
- E. Anastasaki, C. Kanakis, C. Pappas, L. Maggi, C. P. Del Campo, M. Carmona, G. L. Alonso and M. Polissiou, Eur. Food Res. Technol., 2009, 229, 899–905 CrossRef CAS.
- L. Hu, X. Chen, J. Yang and L. Guo, Rapid Commun. Mass Spectrom., 2019, 33, 1703–1710 CrossRef CAS PubMed.
- J. Gross and K. Strupat, TrAC, Trends Anal. Chem., 1998, 17, 470–484 CrossRef CAS.
- Y. R. Jin, M. J. Oh, H. J. Yuk, H. J. An and D. S. Kim, J. Ginseng Res., 2021, 45(5), 539–545 CrossRef PubMed.
- Y. H. Lai, Q. Wu, P. K. So, D. K. W. Mok, C. T. Che and Z. P. Yao, Int. J. Mass Spectrom., 2018, 434, 258–263 CrossRef CAS.
- Z. Zhu, J. Shen, Y. Xu, H. Guo, D. Kang, T. Yu, H. Wang, W. Xu, G. Wang and Y. Liang, J. Mass Spectrom., 2019, 54, 684–692 CrossRef CAS.
- B. Zhu, Q. L. Zhang, J. W. Hua, W. L. Cheng and L. P. Qin, J. Ethnopharmacol., 2018, 226, 143–167 CrossRef CAS.
- W. Feng, J. Liu, Y. Tan, H. Ao, J. Wang and C. Peng, Food Res. Int., 2020, 138, 109777 CrossRef CAS.
- J. C. Lee, K. Y. Lee, Y. O. Son, K. C. Choi, J. Kim, S. H. Kim, G. H. Chung and Y. S. Jang, Phytomedicine, 2007, 14, 390–395 CrossRef CAS PubMed.
- Y. Xu, H. Cai, G. Cao, Y. Duan, K. Pei, S. Tu, J. Zhou, L. Xie, D. Sun and J. Zhao, J. Chromatogr. B: Anal. Technol. Biomed. Life Sci., 2018, 1083, 110–123 CrossRef CAS.
- D. Ballabio and V. Consonni, Anal. Methods, 2013, 5, 3790–3798 RSC.
- L. Breiman, Mach. Learn., 2001, 45, 5–32 CrossRef.
- P. A. Gorry, Anal. Chem., 1990, 62, 570–573 CrossRef CAS.
- M. Defernez and E. K. Kemsley, TrAC, Trends Anal. Chem., 1997, 16, 216–221 CrossRef.
- M. Imani and H. Ghassemian, Geosci. Rem. Sens. Lett. IEEE, 2014, 11, 1986–1990 Search PubMed.
- P. S. Gromski, H. Muhamadali, D. I. Ellis, Y. Xu, E. Correa, M. L. Turner and R. Goodacre, Anal. Chim. Acta, 2015, 879, 10–23 CrossRef CAS.
Footnotes |
| † Electronic supplementary information (ESI) available. See https://doi.org/10.1039/d2ra02040h |
| ‡ These authors contributed equally to this work. |
| This journal is © The Royal Society of Chemistry 2022 |

