 Open Access Article
Micellization and thermodynamics study of ester functionalized picoline-based ionic liquid surfactants in water†
Dong Fu‡
ab,
Xiaoru Gao‡c,
Jue Wanga,
Haijian Jianga,
Mingming Zhenga,
Peng Lia,
Bo Huanga,
Kan Kan *a and
Xiaochen Zhang*a
aHeilongjiang Academy of Sciences, Institute of Advanced Technology, Harbin, P. R. China. E-mail: kankan.has@foxmail.com; 13946165731@163.com
bCollege of Materials Science and Chemical Engineering, Harbin Engineering University, Harbin, P. R. China
cHarbin Fiber Reinforced Plastic Institute, Harbin, P. R. China
First published on 12th May 2022
Abstract
A novel series of picoline-based ionic liquid surfactants, N-alkyoxycarbonyl-3-picoline bromides [CnEmpy][Br] (n = 10, 12, 14), have been synthesized. The thermal stability, aggregation behavior and surface activity of the synthetic ionic liquid surfactants were investigated systematically though a series of methods, such as thermogravimetric analysis (TGA), differential scanning calorimetry (DSC), tensiometry and conductivity. The thermodynamics of micellization of the ionic liquid surfactants solution were studied by using the conductivity method in the temperature range 278.15–318.15 K. The surface activity parameters and thermodynamics parameters were derived, respectively. The enthalpy–entropy compensation effect was further discussed by using relative thermodynamics parameters. It was found that the [CnEmpy][Br] have moderate surface activity, and their critical micelle concentration (CMC) decreased with the ester-functionalized chain length and exhibited a U-shape with temperature. The calculation results of the thermodynamic parameters showed that the micellization processes of [CnEmpy][Br] were spontaneous, endothermic at low temperature and exothermic at higher temperature.
1. Introduction
Ionic liquids are a class of salts composed of organic cations and organic or inorganic anions with low melting points (<100 °C) that have been widely investigation for their unique physicochemical properties in recent years.1–3 Ionic liquids containing long alkyl groups are similar to cationic quaternary ammonium-based surfactants, which can self-assemble in water due to the intrinsic molecular nature.4 Many literature studies have reported a number of applications of amphiphilic ionic liquid self-assembly, such as liquid–solid extraction,5 synthesis of multi-walled carbon nanotubes,6 phase-transfer catalysis,7 gene delivery,8 and dispersal of petroleum asphaltenes.9 Thus, the analysis and investigation of the aggregation behavior of ionic liquids surfactants (ILSs) is crucial to expand their application possibilities in various fields.Aggregation behavior of ILSs and the mixed micellization behavior of ILSs with conventional surfactants in aqueous solution had been intensively investigated.10–18 Most of the researches used long alkyl-chains ILSs, which were not biodegradable and environmentally unacceptable compounds. Moreover, there are only a few investigations on the micellization behavior of the picoline-based ILSs.10,19–24 Nowadays, the sustainable development of environment has become the primary concern of the research and development of novel surfactants. Researchers around the world are trying to develop the surfactants that are environmentally friendly and easily biodegradable. A number of papers reported that the ester functionalized of the hydrophobic chain could significantly improve the biodegradability of ILSs compared with those containing simple alkyl chains.25,26 However, these researches mainly focused on the basic micellization behavior and antibacterial activity. The effect of ester functionalized chain length on the thermodynamics of micellar process had not been systematically investigated over a wide temperatures range. Therefore, the synthesis and systematic research on micellar process of the new ester-functional ILSs could be a significant contribution to the development and understanding of the surfactants.
Reviewing our past work and understanding on alkylpicoline-based ILSs,27,28 we have attempted to synthesize ester-functionalized picoline-based ILSs by using natural molecules fatty acids and halogenated alcohol. As part of the research on aggregation behavior and surface activity of ester-functionalized ILSs in water, this work aims to investigate the effect of ester-functionalized chain length on the thermodynamics of micellar process in a wide temperature range. A new series of ester-functionalized picoline-based ILSs were studied: N-alkyoxycarbonyl-3-picoline bromides [CnEmpy][Br] (n = 10, 12, 14). The aggregation behavior of ILSs solutions were investigated by several methods, the surfactivity parameters of ILSs were obtained. The conductivity test was conducted to investigate at a wide temperature range, and that the thermodynamic parameters of micellization process were characterized. This study provides theoretical basis for the application and development of ester functionalized picoline-based ionic liquids surfactants.
2. Experimental section
2.1 Reagents
Decanoic acid (98%), dodecanoic acid (97%), myristic acid (98%), 2-bromoethanol (98%), sulfuric acid (98%), 3-picoline (98%), toluene (98%), methyl trichloride (98%), anhydrous sodium sulfate (98%), methanol (98%) and ethyl acetate (98%) were purchased from Aladdin Reagent, all reagents were analytical grade. Deionized water was prepared by using Milli-Q (Millipore, USA).2.2 Structural characterization of [CnEmpy][Br]
FT-IR was measured by attenuated total reflectance infrared spectroscopy on an Agilent Cary 630 spectrometer (Agilent, America) in the spectral range of 4000–660 cm−1 for each sample. 1H NMR and 13C NMR spectra were recorded on a Bruker Avance 600 MHz (Bruker, Germany), each sample was dissolved in CDCl3 containing internal standard tetramethylsilane (TMS).2.3 Thermal stability measurements
The thermal stability properties of the ILSs were evaluated on a TG 209 F3 and a DSC 204 F1 (Netzsch, Germany), scanning to 500 °C at nitrogen atmosphere with a heating rate of 10 °C min−1. All samples were measured at 3 times to confirm the uncertainty of the measurement.2.4 Synthesis of ILSs
The ILSs were synthesized by two-step. First, the commercially available long-chain fatty acids were reacted with 2-bromoethanol to form the desired alkylating agents. Subsequently, the alkylating agents reacted with 3-picoline to form the picoline-based ILSs. The synthetic process and spectra of the ILSs were given in the ESI.† The general synthetic pathways were shown as follows (Scheme 1):2.5 Surfactivity measurement of [CnEmpy][Br]
The surface tension of [CnEmpy][Br] were made at 298.15 ± 0.10 K by the Du Noüy method using a tensiometer (Changji SYD-6541A, China). Glass containers were soaked in chromic acid solution and then washed at least 5 times with deionized water in order to remove any residual deposits. The platinum ring was heating over an alcoholic flame before each measurement. All samples were measured at least 5 times until the measuring results deviation was within ±0.01 mN m−1.2.6 Electroconductivity measurement of [CnEmpy][Br]
The electrical conductivity of the [CnEmpy][Br] were evaluated by a high precision conductometer (DDS-307, China). All samples were conducted to control the temperature by a water bath (temperature control accuracy: ±0.01 K, Guning SC-30, China). All samples were measured were repeated at least 3 times until the measuring results deviation was within ±0.01 μs cm−1.3. Results and discussion
3.1 Thermal stability analysis
The thermal stability of the [CnEmpy][Br] have been measured by TG and DSC (Fig. S4 and S5†). TG analysis shows that all ester-functionalized ILSs lose weight less than 1.5% (<170 °C), which is attributed to the moisture contained in ILSs and the volatilization of trace impurities. Weight loss increased gradually in the temperature range 170–225 °C, thereafter it increased rapidly with temperature. The complete decomposition of [CnEmpy][Br] (n = 10, 12, 14) occurs above at 260 °C, indicating that the ester-functionalized ILSs have high thermal stabilities (Fig. S4†). DSC analysis shows that there are three stages in the phase transition of ILSs (i.e. a crystalline (CR) phase, a liquid-crystalline (LC) phase, and an isotropic liquid (I) phase), which are marked out in Fig. S5.† Table 1 lists the analysis data from TG and DSC. As can be seen from Fig. S5,† the [CnEmpy][Br] (n = 12, 14) have three phase transitions. It is noticed that [C10Empy][Br] is a continuous process from crystalline phase to isotropic liquid phase.| [C10Empy][Br] | [C12Empy][Br] | [C14Empy][Br] | |
|---|---|---|---|
| a Units: Tstart, start decomposition temperature; Tonset, onset decomposition temperatures; T1, melting points; T2, thermal transition temperatures; T3, complete decomposition temperatures. | |||
| T1/°C | — | 50 ± 0.30 | 52 ± 0.26 |
| T2/°C | 92 ± 0.32 | 103 ± 0.30 | 100 ± 0.26 |
| T3/°C | 261 ± 0.32 | 267 ± 0.30 | 269 ± 0.26 |
| Tstart/°C | 170 ± 0.21 | 182 ± 0.28 | 168 ± 0.14 |
| Tonset/°C | 220 ± 0.21 | 226 ± 0.28 | 224 ± 0.14 |
3.2 Conductivity measurements
Conductivity measurements is a classical method to study aggregation behavior. There are two distinct linear regions in the plot of conductivity vs. surfactants concentration, the breakpoint is the CMC of surfactants and the slope ratio of two linear regions is the degree of dissociation of micelles (β), respectively. Here, we use Carpena's approach to obtain the CMC value and β, which is based on non-linear fitting method to process conductivity data.28,29 The experimental data of electroconductivity measurement are fitted by the following equation:
 | (1) |
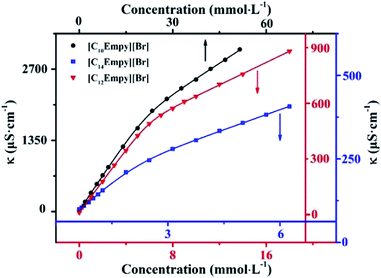 | ||
| Fig. 1 Curves of the conductivity against concentration for [CnEmpy][Br] (n = 10, 12, 14) at 298.15 K. | ||
As shown in Fig. 1, the soaring raise of conductivity below the CMC value is attributed to the increase of free current carriers. The linear regions has a smaller slope above the CMC, two reasons can be explained for this phenomenon, (i) due to the low mobility of micelles, their contribution to charge transport is less than that of freedom ions, (ii) the effective charge of the micellar surface is reduced due to the binding of counter-ions on the micelles surface.22 Obviously, the CMC value decreased with the ester-functionalized chain length. This trend is similar to the conventional surfactants.
The CMC values of the ILSs synthesized are 22.40, 5.930 and 2.163 mmol L−1, respectively. It is interesting to note that the ILSs synthesized in this work are slightly different from the previous literature25 (i.e. the position of alkoxy and carbonyl groups in the ester chain is different). However, the CMC values of the ILSs with the same carbon atom number are quite different (Table 2), which indicates that the structure of ester-functionalized chain has a great influence on the CMC value.
| Surfactants | γCMC | CMC/C20 | pC20 | πCMC | ΓMAX | AMIN | CMC |
|---|---|---|---|---|---|---|---|
| a Units: γCMC, mN m−1; πCMC, mN m−1; ΓMAX, μmol m−2, AMIN, nm2; CMC, mmol L−1. | |||||||
| [C10Empy][Br] | 32.1 | 2.00 | 1.94 | 40.0 | 1.29 | 0.128 | 23.3 |
| [C12Empy][Br] | 31.0 | 2.04 | 2.58 | 41.1 | 1.63 | 0.102 | 5.37 |
| [C14Empy][Br] | 30.1 | 2.16 | 3.06 | 42.0 | 1.95 | 0.085 | 1.88 |
| C10EPyrBr25 | — | — | 2.7 | 41.0 | — | 0.071 | 17 |
| C12EPyrBr25 | — | — | 3.5 | 43.0 | — | 0.064 | 4.1 |
| C14EPyrBr25 | — | — | 4.0 | 48.0 | — | 0.045 | 0.91 |
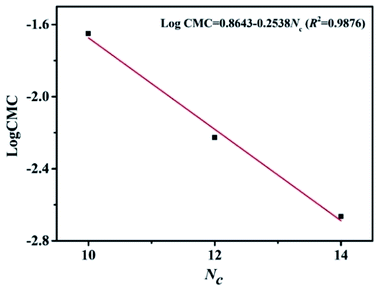
For a homologous series of conventional surfactants, there is a linear relationship between the negative logarithm of CMC value and the number of carbon atoms in the hydrophobic group, which can be expressed by the following equation:13,18,28
log![[thin space (1/6-em)]](https://www.rsc.org/images/entities/char_2009.gif) CMC = A − B × Nc CMC = A − B × Nc
| (2) |
It is evident to find that the carbon number (n) of ester hydrophobic chain is linear with log CMC. For [CnEmpy][Br] (n = 10, 12, 14), the influence trend of ester hydrophobic chain length on CMC is consistent with that of conventional surfactants.13,18
3.3 Surface tension measurements
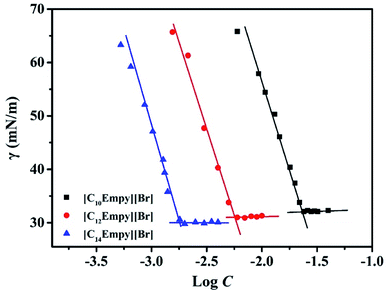
In general, the surface activity of surfactants was evaluated by the measurement of surface tension. Some important surface activity parameters of surfactants can be derived. Fig. 3 shows the plot of the surface tension (γ) versus log[surfactants concentration (C)].Fig. 3 exhibits that the γ values of ILSs solution go down dramatically with the increase of surfactants concentration, which is caused by the adsorption of ILSs molecules on the gas–water interface, and then as the surface tension stops decreasing, there is an obvious breakpoint (i.e. CMC), indicating that the ILSs molecule monomers aggregate into micelles.15,16 After the breakpoint, the γ values of ILSs solution remain almost constant with the increase of ILSs concentration. This phenomenon can be explained by the saturation of ILSs molecules at the gas–water interface.15,16,22 Table 2 lists some important surface activity parameters such as the surface tension at CMC (γCMC), CMC/C20 ratio, adsorption efficiency (pC20), surface pressure (πCMC), maximum adsorption (ΓMAX), and minimum surface cross-sectional area (AMIN). These parameters are crucial for the study of adsorption behavior at gas–water interface. In order to clearly show that the differences in properties between the ionic liquids synthesized in this work and others previously reported, some relevant data are also listed in Table 2. It was found that the variation trend of surface activity parameters of [CnEmpy][Br] is similar to that of parameter of CnEPyrBr.25
As can be seen from Table 2, the γCMC value of [CnEmpy][Br] are 32.1, 31.0 and 30.1 mN m−1, respectively. The CMC/C20 ratio is generally used to evaluate the relative effects of some structural or environmental factors on micellization and on adsorption. The CMC/C20 ratio can explain the reason declining trend of the γCMC value with increasing chain length. A larger CMC/C20 ratio signifies a greater tendency to reduce the γ value. Compares to other ester functionalized ILSs, [C14Empy][Br] has a higher ability to reduce the γ value.
The surface activity of ILSs solutions can be characterized by the adsorption efficiency (pC20) and the surface pressure (πCMC). The adsorption efficiency can be calculated by the following equation:18,27,28
pC20 = −log![[thin space (1/6-em)]](https://www.rsc.org/images/entities/char_2009.gif) C20 C20
| (3) |
The surface pressure (πCMC) is the surface pressure at the CMC value, which can be calculated by following equation:18,27,28
| πCMC = γ0 − γCMC | (4) |
The maximum surface excess (ΓMAX) and the minimum surface cross sectional area (AMIN) of the ILSs are calculated by the following eqn (5) and (6), respectively.18,27,28
 | (5) |
 | (6) |
Here R is the universal gas constant (8.314 J mol−1 K−1), NA is the Avogadro's constant (6.023 × 10²³), T is the Kelvin temperature, (dγ/dlog![[thin space (1/6-em)]](https://www.rsc.org/images/entities/char_2009.gif) C) is the slope of γ versus log
C) is the slope of γ versus log![[thin space (1/6-em)]](https://www.rsc.org/images/entities/char_2009.gif) C, n is taken to be 2 since there is one counter ion that is associated with one ionic head group. The results show that the ΓMAX value increases, AMIN value decreases by the ester-functionalized group length increase, which indicates the longer ester-functionalized chain can make the [CnEmpy][Br] molecules packing more closer.17
C, n is taken to be 2 since there is one counter ion that is associated with one ionic head group. The results show that the ΓMAX value increases, AMIN value decreases by the ester-functionalized group length increase, which indicates the longer ester-functionalized chain can make the [CnEmpy][Br] molecules packing more closer.17
3.4 Temperature dependence of CMC
The curves of conductivity at different concentrations for [CnEmpy][Br] and the correlations between CMC and temperature are shown in Fig. 4. The CMC and β value at different temperatures analyzed based on Fig. 4 are shown in Table 3. The results show that the CMC values change with temperature in a typical U-shape (i.e. the CMC values initially decrease and then reach a least value (CMC*) at a certain temperature (T*). After the T*, the CMC values increase). The CMC versus temperatures curves conform to a quadratic function, the coefficients of the curves, T* and CMC* are listed in Table S1.† This phenomenon can be explained by two opposite effects that influence the micellar formation.30 The first effect is related to the hydration of polar groups of surfactant molecules, which plays a key role in the low temperature range, where hydrogen bonds are easier to form and the strong hydration of polar heads is not conducive to the formation of micelles. The increase in temperature leads to a decrease in the hydration of polar groups, enabling micelles to form at lower concentrations. The second effect is related to hydrophobic hydration of alkyl chains, which alters the structure of the water around the hydrophobic tail. It is well known that the structure of water is strongly dependent on temperature. Therefore, with the increase of temperature, the water structure around the hydrophobic chain becomes loose, and the effect of hydrophobic interaction becomes weaker. This phenomenon shifts the micellar process to a higher concentration range. Competition between these two effects is responsible for the observed U-shaped. Generally for a homologous series of ionic surfactants, T* decrease with the increase of the hydrophobicity chain of surfactants, and the range of T* is 273–313 K.31–33 The variation of T* with ester chain length was similar to that of ionic surfactants, which ranges in 288–294 K.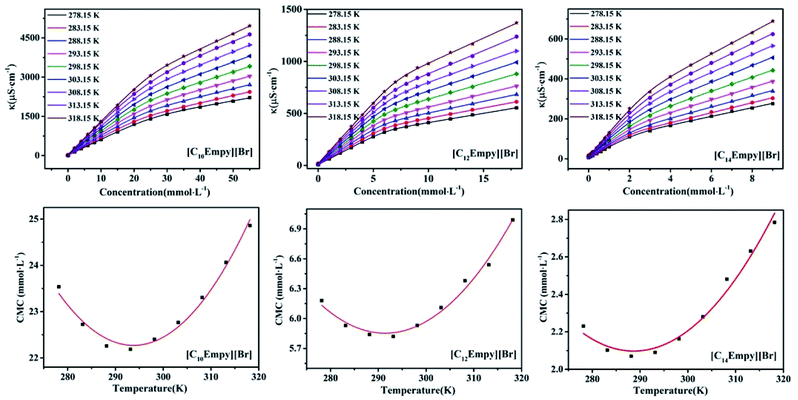 | ||
| Fig. 4 The plot of conductivity vs. concentration of [CnEmpy][Br] at different temperatures and the curves of CMC value vs. temperature of [CnEmpy][Br] at different temperatures. | ||
| Surfactants | T | CMC | β | ΔGmicθ | ΔHmicθ | ΔSmicθ | TΔSmicθ |
|---|---|---|---|---|---|---|---|
| a Units: T, K; CMC, mmol L−1; ΔGmicθ, kJ mol−1; ΔHmicθ kJ mol−1; ΔSmicθ, kJ mol−1 K−1; TΔSmicθ, kJ mol−1. | |||||||
| [C10Empy][Br] | 278.15 | 23.54 | 0.360 | −29.49 | 6.281 | 0.128 | 35.60 |
| 283.15 | 22.72 | 0.378 | −29.78 | 4.336 | 0.120 | 33.98 | |
| 288.15 | 22.26 | 0.398 | −30.01 | 2.286 | 0.112 | 32.27 | |
| 293.15 | 22.19 | 0.414 | −30.24 | 0.1396 | 0.104 | 30.49 | |
| 298.15 | 22.40 | 0.430 | −30.41 | −2.112 | 0.095 | 28.32 | |
| 303.15 | 22.76 | 0.445 | −30.56 | −4.472 | 0.086 | 26.07 | |
| 308.15 | 23.31 | 0.457 | −30.73 | −6.953 | 0.077 | 23.73 | |
| 313.15 | 24.06 | 0.457 | −31.10 | −9.646 | 0.068 | 21.29 | |
| 318.15 | 24.83 | 0.459 | −31.43 | −12.44 | 0.060 | 19.09 | |
| [C12Empy][Br] | 278.15 | 6.18 | 0.321 | −35.34 | 7.116 | 0.149 | 42.56 |
| 283.15 | 5.93 | 0.323 | −36.09 | 4.580 | 0.140 | 40.77 | |
| 288.15 | 5.84 | 0.323 | −36.79 | 1.858 | 0.131 | 38.61 | |
| 293.15 | 5.82 | 0.325 | −37.40 | −1.061 | 0.122 | 36.35 | |
| 298.15 | 5.93 | 0.335 | −37.73 | −4.158 | 0.111 | 33.69 | |
| 303.15 | 6.11 | 0.341 | −38.10 | −7.441 | 0.101 | 30.62 | |
| 308.15 | 6.38 | 0.348 | −38.38 | −10.91 | 0.090 | 27.43 | |
| 313.15 | 6.54 | 0.357 | −38.69 | −14.54 | 0.079 | 24.11 | |
| 318.15 | 6.99 | 0.357 | −39.02 | −18.45 | 0.067 | 20.68 | |
| [C14Empy][Br] | 278.15 | 2.23 | 0.297 | −49.86 | 8.487 | 0.174 | 48.40 |
| 283.15 | 2.09 | 0.304 | −40.65 | 4.749 | 0.160 | 45.30 | |
| 288.15 | 2.07 | 0.319 | −41.06 | 0.759 | 0.145 | 41.78 | |
| 293.15 | 2.09 | 0.324 | −41.60 | −3.463 | 0.130 | 38.12 | |
| 298.15 | 2.16 | 0.335 | −41.90 | −7.923 | 0.114 | 33.99 | |
| 303.15 | 2.28 | 0.339 | −42.27 | −12.67 | 0.098 | 29.71 | |
| 308.15 | 2.48 | 0.347 | −42.41 | −17.66 | 0.080 | 24.65 | |
| 313.15 | 2.63 | 0.348 | −42.82 | −23.00 | 0.063 | 19.73 | |
| 318.15 | 2.78 | 0.350 | −43.21 | −28.64 | 0.046 | 14.63 | |
3.5 Thermodynamic of micellization
The thermodynamic parameters of micellization can be calculated by the CMC values and β in different temperatures. According to the charged pseudo-phase separation model,34–36 the standard Gibbs free energy can be obtained by following equation:15,17
ΔGmicθ = RT × (2 − β) × ln![[thin space (1/6-em)]](https://www.rsc.org/images/entities/char_2009.gif) Xcmc Xcmc
| (7) |
 | (8) |
 | (9) |
The (∂log![[thin space (1/6-em)]](https://www.rsc.org/images/entities/char_2009.gif) Xcmc/∂T)P was calculated by fitting a quadratic function to the plot of log
Xcmc/∂T)P was calculated by fitting a quadratic function to the plot of log![[thin space (1/6-em)]](https://www.rsc.org/images/entities/char_2009.gif) Xcmc vs. temperature and by taking the corresponding temperature derivative.37 The correlation coefficients of quadratic function are listed in Table S2 in ESI.†
Xcmc vs. temperature and by taking the corresponding temperature derivative.37 The correlation coefficients of quadratic function are listed in Table S2 in ESI.†
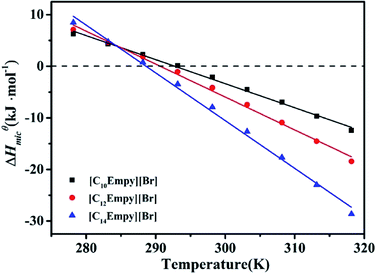
To illustrate the dependence of hydrophobic effect on temperature, we refer to an important parameter, the molar heat capacity (ΔCp,micθ). This parameter is derived by the slope of the curves of ΔHmicθ vs. temperature, which mainly reflects the amount of non-polar solvent accessible area buried on micellization and is highly negative.37 It is worth noting that ΔCp,micθ < 0, the CMC values exhibit a typical U-shaped with temperature.38,39
 | (10) |
Table 3 lists the ΔGmicθ, ΔHmicθ and ΔSmicθ values of ILSs at different temperatures. It is not difficult to find that all the ΔGmicθ are negative, which is indicating that micellar process of ILSs molecules in water is spontaneous.
From the changes enthalpy of micellization at low/high temperatures, it can be concluded that micellization process of ILSs is endothermic at low temperatures and exothermic at high temperatures. In several ionic surfactants, the sign of ΔHmicθ has a similar change with increasing temperature.40,41 This phenomenon can be explained by the subtle relationship between hydrophobic hydration in the nonpolar parts (endothermic) and the counterion binding upon micellization (exothermic). The temperature T0 (ie the temperature at ΔHmicθ = 0) is close to T*,28,32 which is listed in Table S2.†
As shown in Fig. 5, ΔHmicθ decreases with temperature resulting in a negative ΔCp,micθ, this suggests that hydrophobic effect plays a key role. The hydrophobic effect is related to the water removal from the nonpolar surface in order to diminish the extent of less favourable hydrophobic hydration in comparison to clustered water in the bulk. In the aggregation state, water molecules are arranged around the tail of the nonpolar surfactants at low temperature, forming an iceberg structure, or significantly reduced dynamic performance of the water molecules. Thus, the destruction of iceberg structure is a highly endothermic process.42 Although the endothermic contribution of hydrophobic dehydration is partially offset by the presence of favorable hydrogen bonds in the bulk, ion condensation, and other factors. The overall change enthalpy of micellar process is slightly positive at low temperatures. In addition, the water structure of the hydrophobic surface is not as stable at high temperature. Therefore, the endothermic of the hydrophobic dehydration contributes a little to the micellization and eventually the micellization becomes an exothermic process.27,42
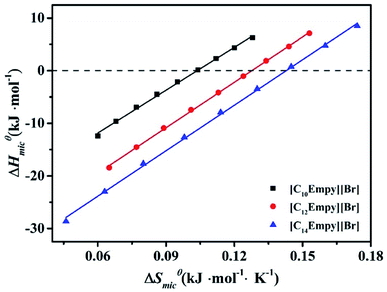
As shown in Fig. 6, the enthalpy and entropy of the micellization decrease simultaneously, which is called entropy-enthalpy compensation effect. For the micellization process, the relationship between changes in ΔSmicθ and ΔHmicθ can be expressed by following equation:
| ΔHmicθ = ΔHcθ + TcΔSmicθ | (11) |
Fig. 6 shows the entropy–enthalpy plots for ILSs, whereas the estimated values of Tc and ΔHcθ are listed in Table S2.† Obviously, the Tc values of ILSs are 271, 287 and 288 K, respectively. For various processes involving small molecules solutions, the range of Tc values are narrow, between 250 and 350 K.43 Furthermore, for hydration to be the dominant process, Tc is 280 K.31,43,45,46 Therefore, according to the Tc value of the studied ILSs, the process is mainly dehydration. When the entropy contribution to micellar process is zero, ΔSmicθ = 0,43 ΔHcθ is assumed to represent the solute–solute interaction strength at surfactants aggregation. Thus, the increase of ΔHcθ leads to the decrease of micellar structure stability.
As can be seen from Table S2,† it is evident that ΔHcθ decrease in the order of [C10Empy][Br] > [C12Empy][Br] > [C14Empy][Br], indicating that the self-assembled structures of C14 are more denser than that of C10. This phenomenon is also common in other ionic surfactants.44,47
The effect of “chemical part” of the micellar process decreases as the length of the ester functionalized chain decreases. For ionic surfactant, the alkyl group length increases by one –CH2–, the ΔHcθ value decreases by ∼3.9 kJ mol−1; for non-ionic surfactant CiE8, the ΔHcθ value decreases by ∼2.9 kJ mol−1.44
As can be seen from Table S2,† from [C10Empy][Br] to [C12Empy][Br], the value of ΔHcθ decreases for 3.8 kJ mol−1; from [C12Empy][Br] to [C14Empy][Br], the value of ΔHcθ decreases for 2.2 kJ mol−1.
For [C10Empy][Br] and [C12Empy][Br], the TΔSmicθ value are greater than the −ΔHmicθ value, which indicates that the entropy gain has a great influence on the association micellization process. The micellization driving force of the [C10Empy][Br] and [C12Empy][Br] is entropy-driven.27,48 However, the driving force of [C14Empy][Br] micellization changes at high temperatures. This phenomenon can be explained as the London dispersion force plays a key role.49
4. Conclusions
A novel series of ILSs base on N-alkyoxycarbonyl-3-picoline bromides have been synthesized, the micellization behavior and adsorption properties of [CnEmpy][Br] (n = 10, 12, 14) are systematic investigated by conductivity and surface tension. The results show that [CnEmpy][Br] have good thermal stability and moderate surface activity. The CMC values of [CnEmpy][Br] present a U-shape with temperature. The analysis of thermodynamic parameters show that the processes of micellization of [CnEmpy][Br] is spontaneous and endothermic at low temperatures and exothermic at high temperatures. According to the analysis of the enthalpy-entropy compensation curve, the compensation temperature (Tc) of investigated ILSs are 271, 287 and 288 K, respectively, indicating the domination of dehydration by micellization process at investigated ILSs. In the studied temperature range, the micellization processes of [C10Empy][Br] and [C12Empy][Br] are entropy-driven, while the micellization processes of [C14Empy][Br] change at high temperatures.Author contributions
Dong Fu: writing – review & editing, methodology. Xiaoru Gao: investigation, resources. Jue Wang: resources, writing – original draft. Haijian Jiang: formal analysis. Mingming Zheng: investigation, formal analysis. Peng Li: investigation, resources. Bo Huang: investigation, Resources. Kan Kan: writing – review & editing, supervision. Xiaochen Zhang: writing – review & editing, supervision.Conflicts of interest
There are no conflicts to declare.Acknowledgements
This work was supported by the Youth Innovation Foundation of Heilongjiang Academy of Sciences (CXMS2019GJS01, CXJQ2022GJS01), the Natural Science Foundation of Heilongjiang Province (LH2019B030) and the Key Research and Development Project of Heilongjiang Province (GZ20210047).References
- Z. M. Xue, L. Qin, J. Y. Jiang, T. C. Mu and G. H. Gao, Phys. Chem. Chem. Phys., 2018, 20, 8382–8402 RSC.
- Z. Q. He and P. Alexandridis, Phys. Chem. Chem. Phys., 2015, 17, 18238–18261 RSC.
- P. C. Marr and A. C. Marr, Green Chem., 2016, 18, 105–128 RSC.
- N. V. Sastry, N. M. Vaghela and V. K. Aswal, Fluid Phase Equilib., 2012, 327, 22–29 CrossRef CAS.
- L. Q. Peng, W. Y. Yu, J. J. Xu and J. Cao, Food Chem., 2018, 239, 1075–1084 CrossRef CAS PubMed.
- M. Matandabuzo and P. A. Ajibade, J. Mol. Liq., 2018, 268, 284–293 CrossRef CAS.
- D. S. Zhao, Y. N. Wang, E. H. Duan and J. Zhang, Fuel Process. Technol., 2010, 91, 1803–1806 CrossRef CAS.
- M. A. Ilies, W. A. Seitz, I. Ghiviriga, B. H. Johnson, A. Miller, E. B. Thompson and A. T. Balaban, J. Med. Chem., 2004, 47, 3744–3754 CrossRef CAS PubMed.
- M. Boukherissa, F. Mutelet, A. Modarressi, A. Dicko, D. Dafri and M. Rogalski, Energy Fuels, 2009, 23, 2557–2564 CrossRef CAS.
- H. Kumar and G. Kaur, J. Mol. Liq., 2020, 298, 111949–111956 CrossRef CAS.
- X. W. Li, Y. A. Gao, J. Liu, L. Q. Zheng, B. Chen, L. Z. Wu and C. H. Tung, J. Colloid Interface Sci., 2010, 343, 94–101 CrossRef CAS PubMed.
- A. Pal and A. Pillania, J. Mol. Liq., 2017, 233, 243–250 CrossRef CAS.
- L. J. Shi, N. Li, H. Yan, Y. A. Gao and L. Q. Zheng, Langmuir, 2011, 27, 1618–1625 CrossRef CAS PubMed.
- M. T. Garcia, I. Ribosa, J. J. González and F. Comelles, J. Mol. Liq., 2020, 303, 112637–112649 CrossRef CAS.
- Y. Wei, F. Wang, Z. Q. Zhang, C. C. Ren and Y. Lin, J. Chem. Eng. Data, 2012, 59, 1120–1129 CrossRef.
- H. Ma, H. C. Ke, T. Wang, J. H. Xiao, N. Du and L. Yu, J. Mol. Liq., 2017, 240, 556–563 CrossRef CAS.
- M. W. Zhao and L. Q. Zheng, Phys. Chem. Chem. Phys., 2011, 13, 1332–1337 RSC.
- R. A. Rahimov, G. A. Ahmadova, G. A. Ahmadova, R. K. Mammadov, N. Z. Asadova, Y. Abdullayev, M. J. Ibrahimova, A. V. Gurbanov and F. I. Zubkov, J. Mol. Liq., 2021, 344, 117783–117792 CrossRef CAS.
- I. Bandrés, S. Meler, B. Giner, P. Cea and C. Lafuente, J. Solution Chem., 2009, 38, 1622–1634 CrossRef.
- H. Y. Wang, J. J. Wang, S. B. Zhang and X. P. Xuan, J. Phys. Chem. B, 2008, 112, 16682–16689 CrossRef CAS PubMed.
- T. Singh and A. Kumar, Colloids Surf., A, 2008, 318, 263–268 CrossRef CAS.
- P. Quagliotto, N. Barbero, C. Barolo, E. Artuso, C. Compari, E. Fisicaro and G. Viscardi, J. Colloid Interface Sci., 2009, 340, 269–275 CrossRef CAS PubMed.
- N. V. Sastry, N. M. Vaghela, P. M. Macwan, S. S. Soni, V. K. Aswal and A. Gibaud, J. Colloid Interface Sci., 2012, 371, 52–61 CrossRef CAS PubMed.
- A. Tiwari, M. Sahoo, P. Soreng and B. K. Mishra, J. Surfactants Deterg., 2018, 21, 367–373 CrossRef CAS.
- M. T. Garcia, I. Ribosa, L. Perez, A. Manresa and F. Comelles, Langmuir, 2013, 29, 2536–2545 CrossRef CAS PubMed.
- P. Patial, A. Shaheen and I. Ahmad, J. Surfactants Deterg., 2014, 17, 253–260 CrossRef CAS.
- D. Fu, X. R. Gao, B. Huang, J. Wang, Y. Sun, W. J. Zhang, K. Kan, X. C. Zhang, Y. Xie and X. Sui, RSC Adv., 2019, 9, 28799–28807 RSC.
- D. Fu, X. R. Gao, J. Wang, Y. Xie, F. Yang, X. Sui, P. Li, B. Huang, K. Kan and X. C. Zhang, J. Dispel. Sci. Technol., 2021, 42, 791–801 CrossRef CAS.
- P. Carpena, J. Aguia, P. Bernaola-Galván and C. C. Ruiz, Langmuir, 2002, 18, 6054–6058 CrossRef CAS.
- H. Piekarski and K. Łudzik, J. Therm. Anal. Calorim., 2012, 110, 263–271 CrossRef CAS.
- B. Šarac, Ž. Medoš, A. Cognigni, K. Bicab, L. J. Chen and M. Bešter-Rogač, Colloids Surf., A, 2017, 532, 609–617 CrossRef.
- Ž. Medoš and M. Bešter-Rogač, J. Chem. Thermodyn., 2015, 83, 117–122 CrossRef.
- I. Čobanov, B. Šarac, Ž. Medoš, A. Tot, M. Vraneš, S. Gadžurić and M. Bešter-Rogač, J. Mol. Liq., 2021, 337, 116353–116362 CrossRef.
- H. Kim and K. Lim, Colloids Surf., A, 2004, 235, 121–128 CrossRef CAS.
- T. Perger and M. Bešter-Rogač, J. Colloid Interface Sci., 2007, 313, 288–295 CrossRef CAS PubMed.
- J. Lah, M. Bešter-Rogač, T. Perger and G. Vesnaver, J. Phys. Chem. B, 2006, 110, 23279–23291 CrossRef CAS PubMed.
- G. H. Tao, M. Tang, L. He, S. P. Ji, F. D. Nie and M. Huang, Eur. J. Inorg. Chem., 2012, 2012, 3070–3078 CrossRef CAS.
- C. L. Mesa, J. Phys. Chem., 1990, 94, 323–326 CrossRef.
- N. Muller, Langmuir, 1993, 9, 96–100 CrossRef CAS.
- A. Kroflič, B. Šarac and M. Bešter-Rogač, Langmuir, 2012, 28, 10363–10367 CrossRef PubMed.
- A. Kroflič, B. Šarac and M. Bešter-Rogač, J. Chem. Thermodyn., 2011, 43, 1557–1563 CrossRef.
- A. Kroflič, B. Šarac, J. Cerkovnik and M. Bešter-Rogač, Colloids Surf., A, 2014, 460, 108–117 CrossRef.
- R. Lumry and S. Rajender, Biopolymer, 1970, 9, 1125–1227 CrossRef CAS PubMed.
- L. Chen, S. Lin and C. Huang, J. Phys. Chem. B, 1998, 102, 4350–4356 CrossRef CAS.
- C. V. Krishnan and H. L. Friedman, J. Solution Chem., 1973, 2, 37–51 CrossRef.
- H. L. Friedman and C. V. Krishnan, J. Solution Chem., 1973, 2, 119–140 CrossRef CAS.
- C. Baar, R. Buchner and W. Kunz, J. Phys. Chem. B, 2001, 105, 2914–2922 CrossRef CAS.
- G. Z. Cao, X. F. Guo, L. H. Jia and X. H. Tian, RSC Adv., 2015, 5, 27197–27204 RSC.
- S. Kumar and K. Parikh, J. Surfactants Deterg., 2013, 16, 739–749 CrossRef CAS.
Footnotes |
| † Electronic supplementary information (ESI) available. See https://doi.org/10.1039/d2ra01706g |
| ‡ Dong Fu and Xiaoru Gao contributed equally to this work. |
| This journal is © The Royal Society of Chemistry 2022 |


