 Open Access Article
Morphological characteristics of calcium carbonate crystallization in CO2 pre-cured aerated concrete
Jiayu Lua,
Shengqian Ruana,
Yi Liu b,
Tao Wang
 c,
Qiang Zeng
 *a and
Dongming Yan*a
aCollege of Civil Engineering and Architecture, Zhejiang University, 866 Yuhangtang Road, Hangzhou, Zhejiang 310058, China. E-mail: cengq14@zju.edu.cn; dmyan@zju.edu.cn
bInstitute for Composites Science Innovation (InCSI), School of Materials Science and Engineering, Zhejiang University, 38 Zheda Road, Hangzhou, Zhejiang 310027, China
cState Key Laboratory of Clean Energy Utilization, Zhejiang University, 38 Zheda Road, Hangzhou, Zhejiang 310027, China
First published on 13th May 2022
Abstract
Early-stage CO2 curing technology for alkaline construction materials (such as cement concrete) has gained increasing interest owing to the advantages of material properties improvement and high potential of CO2 sinking. Less attention, however, has been paid to morphological characteristics of CaCO3 in carbonated cement concrete. The crystal structure and micromorphology of CaCO3 in an early-age aerated concrete (AC) cured under CO2 gas pressures of 0.1, 1, and 2 bar were investigated. The fabricated AC has a high CO2 sorption capacity (∼35 g CO2 per 100 g cement in a 100 mm cube). The morphological characteristics of CaCO3 were statistically analyzed in terms of long-axis length (b), short-axis length (a), and aspect ratio (K = b/a). As CO2 pressure increases, b is almost unchanged from 0.8–1.8 μm, a decreases from 0.7 to 0.4 μm, and, consequently, K increases from 1.3 to 2.5. The different CaCO3 crystal morphologies in AC are ascribed to the CO2 pressure-associated crystal transformation processes: low gas pressure induces a symmetric CaCO3 growth, while high gas pressure causes a faster calcite growth at the crystal tip ends. The findings would deepen the understanding of CaCO3 crystal formation under different CO2 curing pressures for tuning the microstructure of CO2-cured cement concrete.
1. Introduction
Building materials industry is one of the industrial sectors with the largest energy consumption and carbon emissions (accounting for approximately 14.4% of the total carbon emissions) in China.1,2 In recent years, the high potential of carbon sequestration by building materials has attracted increasing attention in both scientific and industrial communities. Most alkaline cementitious materials, such as Portland cement, blast furnace slag, and fly ash, can absorb CO2, and carbonation reaction processes generally result in progressive alkali decrease or neutralization.3–6 Carbon fixation may enhance the cementitious ability when alkaline oxides, such as calcium oxide (CaO) and magnesium oxide (MgO), in building materials react with CO2 to generate insoluble and stable carbonates. Current knowledge indicates that CO2 treatment of cement-based materials (CBMs) at early age can not only absorb a large amount of CO2 but also refine the microstructure and improve mechanical properties and durability performances.7–12 Experimental tests evidenced that the early-age carbonation of CBMs enables CO2 absorption of 6.2–22.82%, and the 1d strength increases by around 20%.13–17 The formation of CaCO3 crystals and/or amorphous calcium carbonate (ACC) can fill pores in meso and micro sizes, which enhances the material's microstructure.9,18,19 Consequently, improvements in resistance to chloride migration, gas penetration,20 freeze-thaw, sulfate erosion, and dry–wet cycles have been reported for early-age carbonated CBMs.21–25Many factors can affect early carbonation curing of CBMs, such as, raw materials, water–cement ratio, carbonation time, and temperature, among which the gas pressure of CO2 (or concentration) may be the most important factor.26 Generally, to accelerate the carbonation of alkaline active minerals in CBMs, relatively high CO2 gas pressures (between 0.1–0.5 MPa) are recommended.17 In the physical and chemical context, CO2 gas pressure can significantly impact the diffusion and reaction rate of CO2 molecules in cement-based materials. Shi et al. found that when the pressure of CO2 gas increased from 10 to 60 psi (0.069–0.414 MPa), carbon absorption increased by nearly 1.7 times, and the compressive strength did not significantly change.27 Kottititum et al. found that when the curing pressure was increased from 1 to 3 bar (0.1–0.3 MPa), the modulus of rupture of fiber–cement composites increased by 16%, the modulus of elasticity increased by 23%, and the toughness decreased by 51%.28 Tu et al. observed that CO2 pressure (0.01 and 0.4 MPa) impacted the crystalline of CaCO3 for cement specimens mixed with limestone powder.29
Extensive reports have supported the multiple benefits of carbonation to CBMs at early ages in terms of CO2 sinking and engineering performance improvement. Different CaCO3 crystal structures have been reported in different experiments.30–34 Calcite has been observed in most experiments of carbonation of CBMs.35–38 Insufficient attention, however, has been paid to morphological characteristics of CaCO3 in carbonated cement concrete. Significant diversity in the microstructure and morphology of CaCO3 crystals in carbonated CBMs has been reported. Jian et al. explored the morphological diversity, growth mechanism, and shape evolution of CaCO3 crystals in cement with dilute hydration through scanning electron microscopy (SEM) and first-principles calculation.39 The authors suggested that the [Ca2+]-to-[CO32−] ratio in a cement system may be the principal cause of crystal morphological diversity according to the theory of aqueous chemistry. However, the formation of crystals in diluted hydrated cement may not be representative of the carbonation of real CBMs with relatively dense microstructures. Monkman and Shao observed granular, lath-like CaCO3 crystals (with a size of approximately 1 μm) agglomerated tightly on the surface of cement particles, filling the spaces between particles in the cement samples, and irregularly shaped and loosely distributed carbonation products on the substrate in the slag and fly ash samples.16 Siauciunas et al. observed that during the carbonation process, CaCO3 grew from amorphous particles of several hundred nanometers into layered and rhombohedral of 1–2 μm.40 Li et al. found that cube granular or rod-shaped crystals were embedded in the hydration product, calcium-silicate-hydrates (C–S–H), to improve the integrity and compactness of the structure.41 Qin et al. reported irregular granular CaCO3 crystals in cement–coal gangue paste.24 In a wellbore cement sample, euhedral hexagonal prisms CaCO3 crystals with a width of 10–20 μm and trigonal symmetry have been reported.20 The aforementioned examples of large diversity in the microstructure and morphology of CaCO3 crystals have evidenced wide gaps between the state-of-the-art knowledge of carbonation mechanisms and the alterations to engineering performance of CBMs after early-age carbonation.
To narrow the gaps, it is essential to unravel the morphological characteristics of CaCO3 in CBMs subjected to early-age carbonation and the mechanisms of CaCO3 growth in materials with complex microstructures. A parallel aim of this work is to clarify the impact of CO2 gas pressure on the microstructure and mineral morphology of CaCO3 in CO2-cured cement concrete. Here, thermogravimetric analysis (TGA), X-ray diffraction (XRD), Fourier-transform infrared spectroscopy (FTIR), and SEM tests were used to characterize the chemical and morphological characteristics of aerated concrete (AC) blocks cured at CO2 gas pressures of 0.1, 1, and 2 bar (0.01, 0.1 and 0.2 MPa). Geometrical parameters of CaCO3 (i.e., long-and short-axis lengths, and the aspect ratio) were statistically evaluated on the basis of imaging analysis. Profound discussions on CO2 gas pressure-associated carbonation mechanisms were performed. The findings of this work would deepen the understanding of CaCO3 morphology and carbonation mechanisms of CBMs at different CO2 curing pressures, which would help tune the microstructure of CO2-cured cement concrete toward better manipulation of CO2 sinking and engineering performance of CBMs.
2. Experimental program
2.1 Materials and mix proportion
The AC was fabricated for early-age carbonation. The porous structure of AC facilitates rapid gas and moisture diffusion in AC specimens, enabling rapid CO2 sinking.42 Ordinary Portland cement (Type P·O 42.5) from Anhui Conch Cement Co., Ltd., China, was used as the main binding material for AC specimen fabrication. Two industrial wastes, i.e., Class C fly ash from Hangzhou Hanglian thermal power plant, Zhejiang, China, and ground granulated blast furnace slag (GGBFS) from Henan Anyang Iron & Steel Group Co., Ltd., Henan, China, were used to improve the sustainability of AC. The advantages of adding fly ash and GGBFS to AC include low density, improving thermal insulation performance, and providing calcareous material for carbon absorption.The chemical composition of the raw materials was collected by X-ray fluorescence, XRD, and a laser particle size analyzer. Cement, GGBFS, and fly ash contain 57.61%, 33.83%, and 17.58% CaO, respectively, which could be carbonized and converted into CaCO3 (Table 1). In addition, the slag also contains a certain amount of MgO (7.74%, see Table 1).
| CaO | SiO2 | Al2O3 | SO3 | Fe2O3 | MgO | K2O | TiO2 | Others | |
|---|---|---|---|---|---|---|---|---|---|
| Cement | 57.61 | 12.03 | 5.15 | 3.46 | 3.01 | 1.46 | 1.21 | 0.26 | 15.81 |
| GGBFS | 33.83 | 18.60 | 15.98 | 1.01 | 0.98 | 7.74 | 0.39 | 1.40 | 20.08 |
| Fly ash | 17.58 | 39.87 | 28.25 | 5.07 | 4.44 | 1.24 | 0.70 | 1.11 | 1.74 |
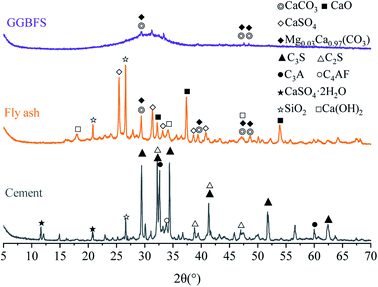
Fig. 1 demonstrates the crystalline phases of solid materials tested by XRD. The cement mainly contains tricalcium silicate (C3S), dicalcium silicate (C2S), tricalcium aluminate (C3A), tetra calcium aluminoferrite (C4AF), and gypsum. The hump of the slag curve indicates the presence of several amorphous substances, and the crystals that can be distinguished are carbonates. Quartz (SiO2), anhydrite (CaSO4), lime (CaO), portlandite (Ca(OH)2), calcite (CaCO3), and magnesium calcite (Mg0.03Ca0.97(CO3)) crystals are detected in fly ash (Fig. 1).
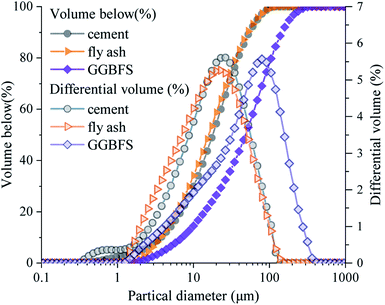
Fig. 2 shows the particle size distribution of raw materials. The cement and fly ash share a similar particle size distribution with a 50% volume size of 17 μm, whereas GGBFS has coarser particle sizes with a 50% volume size of 49 μm.
Aluminum powder from Huai'an Jiayi Building Material Co., Ltd., Jiangsu, China was used for gas generation, and additional gypsum from Sinopharm Chemical Reagent Co., Ltd., Shanghai, China, was used to balance gas generation rates, preventing excessive swelling. Specific AC mixture proportions are listed in Table 2.
| Cement | Fly ash | GGBFS | Water | Aluminum paste | Gypsum | |
|---|---|---|---|---|---|---|
| Mass (g) | 40 | 30 | 30 | 35 | 0.5 | 0.5 |
2.2 Specimen preparation
AC concrete specimens were prepared as follows. First, the aluminum powder was mixed with deionized water in a ratio of 1![[thin space (1/6-em)]](https://www.rsc.org/images/entities/char_2009.gif) :
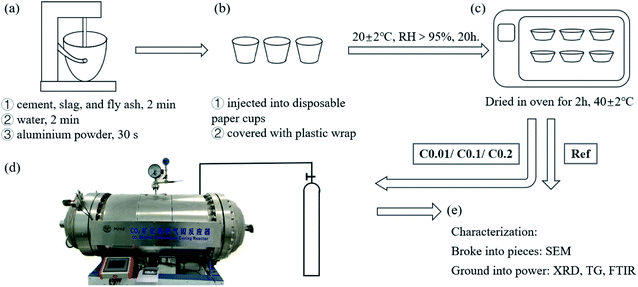
:![[thin space (1/6-em)]](https://www.rsc.org/images/entities/char_2009.gif) 5 with low-speed stirrings to obtain the aluminum suspension. Later, all powder materials were dry-mixed in a steel mixing bowl with low-speed stirrings for 2 min, and then the remaining deionized water was poured into the mixing bowl with the same stirrings for another 2 min. These processes yielded sticky cement slurries without a foaming agent. After that, the aluminum suspension was quickly added to the slurries with high-speed stirrings for 30 s, generating homogeneous cement slurries for casting (Fig. 3a). One part of the well-prepared slurries were then poured into disposable paper cups (approximately 100 g each) and covered with plastic wrap (Fig. 3b). The other part of the slurries were poured into a 100 mm cubic mold for compressive strength. In the following 15 min, the concrete “cakes” were inflated by hydrogen gas generated by the reaction between alumina and water. The bubbling process enabled the increases in the volume of cementitious slurries by approximately 80%. The cake-like AC samples were then removed into a standard curing room (20 °C ± 2 °C and 95% RH) for the primary curing for 20 h.
5 with low-speed stirrings to obtain the aluminum suspension. Later, all powder materials were dry-mixed in a steel mixing bowl with low-speed stirrings for 2 min, and then the remaining deionized water was poured into the mixing bowl with the same stirrings for another 2 min. These processes yielded sticky cement slurries without a foaming agent. After that, the aluminum suspension was quickly added to the slurries with high-speed stirrings for 30 s, generating homogeneous cement slurries for casting (Fig. 3a). One part of the well-prepared slurries were then poured into disposable paper cups (approximately 100 g each) and covered with plastic wrap (Fig. 3b). The other part of the slurries were poured into a 100 mm cubic mold for compressive strength. In the following 15 min, the concrete “cakes” were inflated by hydrogen gas generated by the reaction between alumina and water. The bubbling process enabled the increases in the volume of cementitious slurries by approximately 80%. The cake-like AC samples were then removed into a standard curing room (20 °C ± 2 °C and 95% RH) for the primary curing for 20 h.
2.3 Carbonation
To facilitate the entry of CO2 into cement matrix, removal of pore water is recommended.43–46 Here, a drying scheme of 40 °C for 2 h was used to partially remove the capillary water in the AC specimens before being exposed to CO2 gas (Fig. 3c).43–46 This allows for a 7–10% reduction in mass of the AC specimens. The partially dried AC specimens were then moved to a homemade CO2 curing reactor for carbonation (Fig. 3d).43 A valve with a digital pressure gage was connected to the reactor to control the gas pressure. Three CO2 gas pressures, 0.1 bar (0.01 MPa), 1 bar (0.1 MPa), and 2 bar (0.2 MPa), were selected to study the effect of CO2 pressure on the crystallization of CaCO3 during CO2 pretreatment. During the entire CO2 curing period, CO2 pressure was kept as a preset constant within the variance of ±1 kPa. Owing to the continual consumption of CO2 by the carbonation of the raw materials and their hydration products, the gas pressure would decrease as carbonation progresses. To save the testing time, the CO2 curing was stopped when the gas pressure change was less than 1 kPa per 30 min. Results showed that a higher set CO2 gas pressure reduced the CO2 curing duration. Specifically, the initial CO2 gas pressures of 0.1, 1, and 2 bar resulted in curing durations of 8, 5, and 4 h, respectively. Note that the CO2 curing periods used in this work were significantly shorter than those for the CO2 curing of ordinary solid concrete at early ages because the porous structure of the AC specimens allowed relatively high gas permeation, thus enhancing the carbonation effect.422.4 Characterization methods
Samples from the superficial parts of AC specimens were acquired for chemical and microstructure analyses. Particle and powder samples were prepared and dried to a constant weight at 60 °C for different tests. Small AC particles in the size of 10 mm were selected for the SEM test, whereas XRD, FTIR, and TG tests were performed on AC powders that had passed through a 350 mesh sieve. The cube specimens were weighed before and after carbonation, which used as the overall carbon uptake of the block.SEM was performed using GEMINI 300 ESEM equipped with an energy dispersive spectrometer. A thin layer of gold was sprayed on the freshly fractured surfaces of samples. An accelerating voltage of 3 kV was used.
XRD measurements were performed using a Bruker D8 Advance diffractometer with Cu-Kα radiation (λ = 0.15419 nm) over a 2θ range of 5° to 90°, and a step length of 0.02°. MDI Jade 6 was used for mineral phase identification.
FTIR spectra were obtained using an infrared spectrometer AVATAR370. The wavenumber ranges from 4000 to 400 cm−1 with a spectral resolution of 4 cm−1, and 32 times of scans were set for all FTIR tests.
TG-DTG texts were conducted using a thermal analyzer TGA2 (Mettler Toledo) in a nitrogen atmosphere. The temperature was increased from 30 °C to 850 °C with a heating rate of 15 °C min−1.
Compressive strength was measured with 100 mm cubic specimens at 3 and 7 days of curing according to Chinese standard GB/T 11971-1997. The compressive strength data were obtained from 4 samples under each type of specimen, and the average values were used for analysis.
3. Results and discussion
3.1 Compressive strength and increased mass
Compressive strength and mass gain of the cube specimens after carbonation are presented in Fig. 4. CO2 pre-curing resulted in a remarkable increase in the 3d compressive strengths of aerated concrete, from 1.29 MPa of ref specimen to 2.11–2.31 MPa. showing an increase by 164–179%. However, carbonation has some adverse effects on the development of strength, which are positively correlated with the mass gain of the cubes during carbonation. CO2 pre-curing increases early strength by filling pores with rapidly generated CaCO3 crystals. The adverse effect on strength development stems from the exothermic consumption of water during carbonation, which weakens the subsequent hydration.19 The high porosity of AC facilitates the entry and transport of CO2. The porosity of the AC specimens was between 42.20% and 44.42% as measured by X-ray computed tomography and mercury intrusion porosimetry.42 The mass increase of 100 mm cube samples reached 2.52%, 2.75%, 4.49% under 0.01, 0.1, 0.2 MPa CO2 curing.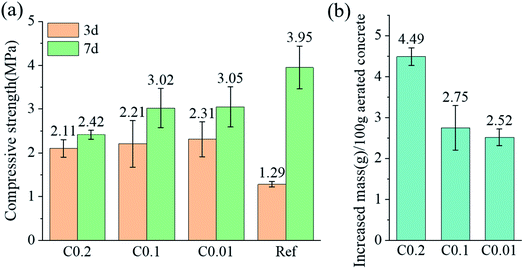 | ||
| Fig. 4 (a) Compressive strength measured at 3 and 7 days; (b) increased mass of cube specimens after carbonation. | ||
3.2 Chemical outcomes
Hydration of the ternary cement-fly ash-GGBFS system generally generates complex hydration products with complex microstructures, such as calcium–silicate(aluminum)-hydrate (C–S(A)-H) gel, calcium hydroxide (CH), ettringite (AFt), and mono-sulfoaluminate hydrate (AFm).47,48 XRD patterns of the reference AC sample in this test suggested the main crystal phases of AFt, CH, quartz, larnite, C4AF, as well as a small amount of calcite and magnesium calcite (Fig. 5). Among them, quartz, larnite, and magnesium calcite originated from the fly ash and GGBFS (Fig. 1), whereas the remaining crystals were hydration products of the ternary cement–fly ash–GGBFS system. A broad diffraction bump in the 2θ range of 25° to 37° represented the presence of an amorphous phase, i.e., C–S(A)-H, the main hydration products of cement with pozzolanic additives such as fly ash and GGBFS.49–51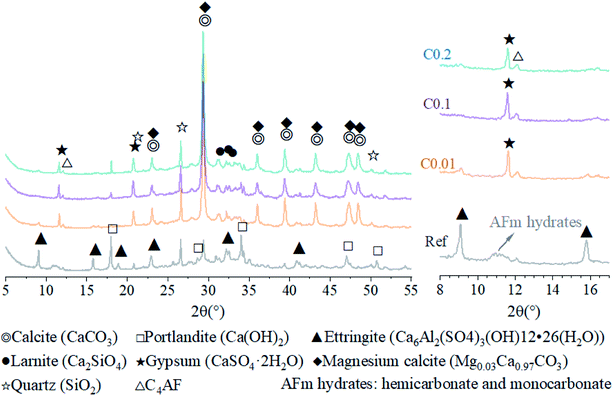 | ||
| Fig. 5 XRD patterns of AC specimens with and without CO2 curing within the range of 5° and 55° (left) and the range of 8° and 17° (right). | ||
When the aerated ternary cement-fly ash-GGBFS specimens were exposed to environments with relatively high CO2 gas pressures, carbonation began to occur for the active phases in the hydration products and raw materials. For simplification, only phases with obvious mass changes (e.g., CH, AFt, C–S(A)-H) were representatively selected to demonstrate the carbonation processes, which can be given by:10,52
| Ca(OH)2 + CO2 → CaCO3 + H2O | (1) |
| 3CaO·Al2O3·3CaSO4·32H2O + 3CO2 → 3CaCO3 + 3CaSO4·2H2O + Al2O3 + 26H2O | (2) |
| xCaO·SiO2·yAl2O3·zH2O + xCO2 → xCaCO3 + SiO2 + yAl2O3 + zH2O | (3) |
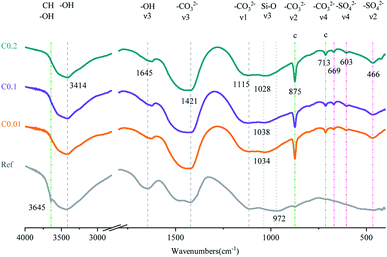
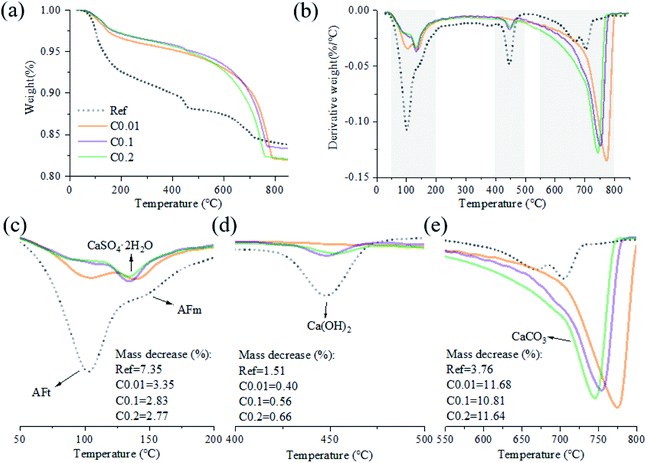
For the carbonation of CH, in the FTIR curves (Fig. 6), the peak near 3645 cm−1 ascribed to O–H stretching in CH53 was observed only in the Ref sample, evidencing the generation of CH in the Ref AC sample due to cement hydration and the vanishing of CH in the carbonated samples due to the carbonation reaction. However, both XRD and TGA spectra continued showing the characteristic peaks of CH after the early-age carbonation (Fig. 5 and 7), suggesting the incomplete CH carbonation. Taking the TGA data for example (Fig. 6d), the weight loss peak near 450 °C, corresponding to the dehydroxylation of CH,54 was 0.4%, 0.56%, and 0.66% for the AC samples of C0.01, C0.1, and C0.2, respectively, compared with 1.51% for the Ref AC sample. The small difference in the amount of residual CH after carbonation may be due to the different reaction rates and times under different CO2 pressures. A longer CO2 curing time at a lower pressure may result in a greater degree of CH carbonation. Moreover, the exothermic nature of cement carbonation may raise the temperature and, consequently, reduce the solubility of CH in water, resulting in less CH being carbonated at a higher CO2 gas pressure (Fig. 5 and 7d).
Regarding the carbonation of AFt, its XRD characteristic peaks almost disappeared, whereas those of gypsum became greatly significant according to the reaction (2). The small bump between 10.5° and 11.5° (Fig. 5), representing the poorly crystalline AFm hydrates,55 became flat and enhanced the characteristic peaks of gypsum after carbonation. Slight peaks ranging from 466 to 669 cm−1 in the FTIR spectra (Fig. 6) indicated the generation of gypsum due to the carbonation of AFt and AFm. The SO42− symmetry bending vibration peak (ν2) in gypsum appeared at 464 cm−1, and the SO42− antisymmetric bending vibration peak (ν4) appeared at 603 and 670 cm−1.56 The DTG spectra (Fig. 7c) showed similar results. The mass loss below 200 °C was caused by the removal of strongly adsorbed water (i.e., water confined between C–S(A)-H layers) and the dehydration of crystals (i.e., AFt, AFm, and gypsum) (Fig. 7c). Specifically, the peaks at 110 °C, 130 °C, and 150 °C denoted the decomposition of AFt, gypsum, and AFm, respectively.57,58 The mass loss of the Ref. AC sample below 200 °C was 7.35%, and those of the carbonized samples were heavily decreased to 2.77–3.35%. For the C0.01 sample, a slight AFt peak at 110 °C still existed, suggesting incomplete carbonation of AFt at the low CO2 gas pressure. This finding agreed with the XRD spectra of the C0.01 sample, where the characteristic peaks of AFt continued to be observed (Fig. 5).
For the carbonation of C–S(A)-H gel, which is generally not a bulk crystalline phase, it would be difficult to obtain meaningful findings from the XRD spectra of the Ref. AC sample (Fig. 5). However, some C–S(A)-H gel features may be characterized by FTIR. In Fig. 3, the asymmetrical stretching vibration (ν3) of the Si–O bond between 800 and 1200 cm−1 was the main feature of C–S(A)-H.59 The turning point of the curves shifted from 972 cm−1 to 1028–1038 cm−1 after carbonation, implying the transmission of the silicate network from Q2 units to Q3 units. This suggested that after carbonation, the C–S(A)-H chain shrank and the non-bridging oxygen on the silicate sites decreased.36,60–62
Then, the mineral characteristics of CaCO3 (Fig. 5–7) were investigated. According to the XRD results, only calcite and magnesium calcite were identified (Fig. 5). The magnesium calcite may be derived from the carbonation of magnesium oxide in GGBFS, where magnesium replaced the trace calcium.
According to the FTIR tests, the characteristic bands of –CO32− were identified in the range of ν1 (symmetric C–O stretching) around 1100 cm−1, ν2 (–CO3 out-of-plane bending) around 875 cm−1, v3 (asymmetric –CO3) around 1420 cm−1, and ν4 (doubly degenerated in-plane O–C–O deformation bending) around 713 cm−1.30,63 The C–O stretching ν2 and ν4 modes characterized the products of CO2 treatment. Three polymorphs of CaCO3 exhibit distinct peaks in these two ranges. Only the characteristic peaks of calcite (875 (ν2) and 713 (ν4) cm−1) were observed, whereas the peaks of aragonite (ν2 region (854 and 843 cm−1) and ν4 region (712 and 700 cm−1) and vaterite (873 (ν2) and 744 (ν4) cm−1) did not appear.36,64
TGA tests can quantify the decomposition of CaCO3.65 Here, the mass loss between 550 °C and 800 °C was adopted to evaluate the amount of CaCO3 (Fig. 7e).65 In Table 3, the mass decrease in each temperature range was calculated, and the major related minerals and/or confined water were indicated. The CaCO3 produced by carbonation was derived from Ca(OH)2, AFt, AFm and C–S(A)-H gel. The mass loss of AC specimens pre-cured at the CO2 pressures of 0.1, 1, and 2 bar was nearly the same, i.e., 11.68%, 10.81%, and 11.64%, respectively (Fig. 7e). It is equivalent to the sorption rate of 35 g CO2 per 100 g cement. The mass loss of the Ref. AC sample between 550 °C and 800 °C was 3.76%, indicating the presence of CaCO3, which could be partially derived from raw materials (fly ash and GGBFS) and from the natural carbonation of the Ref. AC sample in the atmosphere. The characteristic DTG peak of CaCO3 decomposition may be related to the degree of crystallization.66,67 According to this regime, CaCO3 produced by a sample cured with a lower pressure and a longer duration would show a better degree of crystallinity based on the tests (Fig. 7e).
| Temperature range (°C) | Mass decrease (%) | Minerals and/or confined water | |||
|---|---|---|---|---|---|
| Ref. | C0.01 | C0.1 | C0.2 | ||
| 50–200 | 7.35 | 3.35 | 2.83 | 2.77 | AFt, AFm, CaSO4·2H2O, confined water |
| 400–500 | 1.51 | 0.4 | 0.56 | 0.66 | Ca(OH)2 |
| 550–800 | 3.76 | 11.68 | 10.81 | 11.64 | CaCO3 |
3.3 Calcium carbonate crystal morphology
Fig. 8 representatively displays the selected SEM pictures of the fresh fracture surface of the AC specimens on a microscale. In the CO2 cured samples, some calcite crystals were discovered on the newly fractured surface. The crystalline morphology of calcite may vary in different carbonation conditions. For example, cubes, prisms, spherical aggregates, and other irregular shapes of calcite have been observed.35 Compared with well-crystallized calcite that nucleates and grows in dilute hydrated cement,39 the observed CaCO3 crystals in carbonized CBMs were mostly granular and clustered together.24,41,68–70 The rhombohedral crystal structure is a typical equilibrium form of calcite, which is typically precipitated from a homogeneous solution, whereas the process of industrial CO2 gas carbonation typically forms scalenohedral calcite.71–73 The scalenohedral calcite crystals observed in this experiment were scattered in the pores of the AC material, showing irregular shapes and layered accumulations (Fig. 8). The crystals were stacked in a loosely packed structure, yielding rough surfaces. In specification, the low-pressure cured sample exhibited hollow dents at both ends of the crystal (Fig. 8a), which may be caused by the excessive growth of edges of the crystal at both ends.74In addition, the complexity of the raw materials has significant impacts on the crystal morphology and microstructure of carbonated materials. For example, the presence of Mg, K, and SO3 in the raw materials of cement and fillers may impact the crystallization of calcite during carbonation. It was suggested that the electron configuration of Mg2+can delay the growth of calcium carbonation in its vicinity,75,76 resulting in rougher terraces and rounded steps.77 The carbonation of calcium with MgSO4 will form polycrystalline aggregates, small and irregular pits, and rugged terrace edges due to the inhibition of carbonation caused by SO42−.78 The presence of K ions may control the crystal morphology of CaCO3, stabilizing the rhombic face on rhombohedral calcite crystals.74
As CO2 curing pressure increases, the CaCO3 crystals change their appearance but still maintain the rhombohedral structure. Geometrical characteristics of the crystal particles were measured to quantify the morphological changes of CaCO3 crystals, i.e., the long-axis length, b, the short-axis length (or width), a, and the length/width ratio (or aspect ratio), K; see the bottom half of Fig. 8. Only particles whose shape can be observed were selected, and at least 20 CaCO3 particles of each sample were statistically analyzed.
Fig. 9 shows the acquired morphological parameters (a, b, K) of the selected CaCO3 crystals. At the low CO2 gas pressure (0.1 bar), the crystals' length was slightly higher than the width, and both were distributed near 1 μm (Fig. 9a). At the higher CO2 gas pressures (1 and 2 bar), the length was unchanged in the range of 0.8–1.8 μm, but the width decreased significantly from 0.6 μm to 0.4 μm (Fig. 9b and c). As a result, the aspect ratio K increased from 1.3 ± 0.19 to 2.5 ± 0.44 when CO2 gas pressure increased from 0.1 to 2 bar; see the left panel of Fig. 9.
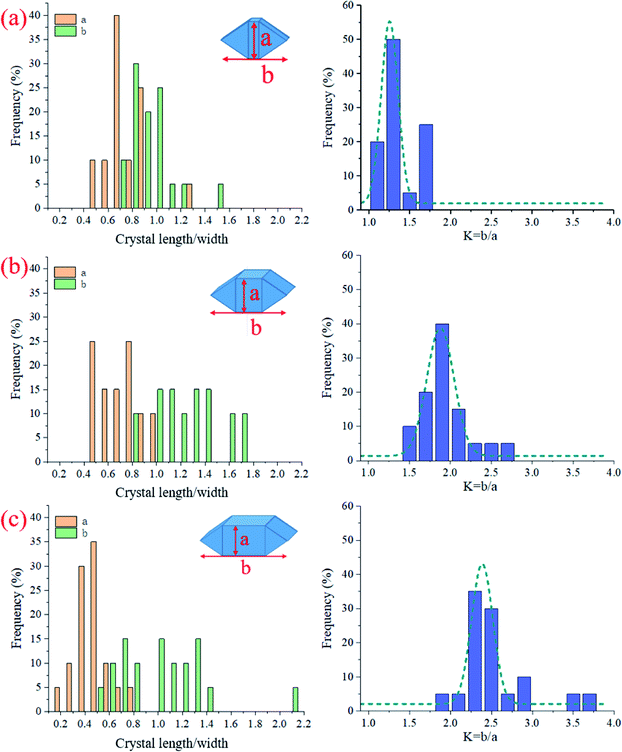 | ||
| Fig. 9 Statistics data of CaCO3 crystal length, width, and the aspect ratio for the AC specimens cured at different CO2 pressures: (a) C0.01, (b) C0.1, and (c) C0.2. | ||
In this experiment, the K value increased linearly with CO2 pressure, with a linear fitting determination coefficient greater than 0.999 (Fig. 10). Changes in the morphology of CaCO3 crystals with CO2 pressure were also observed in the literature.16,24,41,68,70 Here, the aspect ratio of CaCO3 crystals was obtained by measuring the geometric parameters based on the reported SEM images. As shown in Fig. 10, the aspect ratios of CaCO3 crystals in the literature showed a similar to the result, that is, a higher CO2 pressure can lead to a higher aspect ratio.
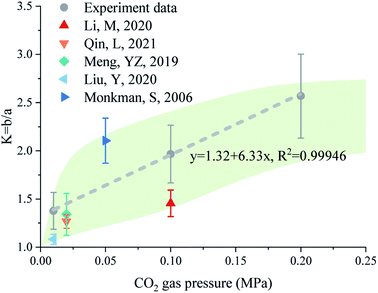 | ||
| Fig. 10 The statistic K (length-to-width ratio) of CaCO3 crystals measured in this work and reported in the literature.26,32,40,69,71 | ||
3.4 Discussion of mechanisms
The experiments demonstrated that unlike the well-crystallized calcite after carbonation in a dilute hydrated cement system, CaCO3 crystals in AC specimens showed different morphological characteristics (Fig. 8–10). Specifically, a hollow structure was observed for CaCO3 crystals in the AC sample cured at 0.1 bar CO2 (Fig. 7a), and as the gas pressure was increased to 2 bar, this hollow structure gradually disappeared and the aspect ratio increased (Fig. 9). The changes in CaCO3 crystal structure are associated with crystallization processes, which are highly dependent on carbonation environments. Suzuki et al.79 observed polycrystalline calcite with a hollow structure and confirmed that this hollow structure may originate from the transformation of crystals from vaterite or ACC solid to calcite. Compared with calcite, ACC contains 1.0–1.5 water molecules per CaCO3 unit,80 and the density of vaterite is lighter in weight by 6.3%. This solid-to-solid transformation was accompanied by the release of water and volume reduction, thereby forming cavities.79Two gas pressure-dependent crystallization paths were proposed to better demonstrate the effect of gas pressure on the morphology of CaCO3 crystals (Fig. 11). At the beginning stage of CBMs' carbonation, cement and cement hydration products released Ca2+, OH− and H4SiO4 in the pore solution81 and CO2 dissolved in the pore solution to release CO32−.81 The corresponding CO2 solubility under different CO2 curing pressures was listed (Table 4). At the gas pressure of 0.01, 0.1 and 0.2 MPa, the ideally dissolved CO2 concentrations were 0.0037, 0.0365 and 0.0730 mol L−1. The combination of Ca2+ and CO32− under oversaturated conditions could form critical-size clusters that subsequently form ACC nanoparticles covering the surfaces of the substrate, a process known as crystal nucleation82 (Fig. 11). At this stage, ACC nanoparticles are still unstable, and the paths to crystals are highly dependent on the supplies of Ca2+ and CO32−, as well as other impacting factors. At a low CO2 gas pressure (e.g., 0.1 bar), ACC nanoparticles gradually aggregated and formed spherical vaterite and then slowly transformed into calcite with cavities;78 see the low-pressure path shown in Fig. 10. When CO2 gas pressure was increased (e.g., 2 bar), the slender calcite, composed of scalenohedron, was formed from ACC nanoparticles at a faster rate; see the high pressure path shown in Fig. 11. In addition, high CO2 pressures may induce the formation of elongated crystal aggregates. Excessive carbonate ions can hinder the growth of the surface of the calcite crystal in the minor axis direction, causing the crystal to grow to the tips of both ends.83 The crystals in samples with lower K values may have better thermodynamic stability, so the characteristic decomposition temperature is higher (Fig. 7e).
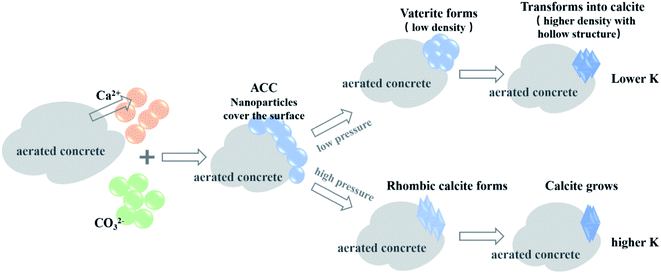 | ||
| Fig. 11 Schematic illustration of the crystal growth paths of CaCO3 to form crystals with low and high aspect ratio K at different CO2 pressures. | ||
| Sample | CO2 pressure (Mpa) | CO2 solubility (mol L−1) |
|---|---|---|
| C0.01 | 0.01 | 0.0037 |
| C0.1 | 0.1 | 0.0365 |
| C0.2 | 0.2 | 0.0730 |
Overall, the experimental work reported different morphological characteristics of CaCO3 formed under different CO2 pressures (Fig. 8–10), whereas the total carbonation degrees had no great differences (Fig. 7). The findings would uncover the physicochemical mechanisms of carbonation of CBMs affected by CO2 pressure. Further rigorous work is required to establish paths to design and control carbonation conditions, which enable optimizing engineering performance and CO2 sinking efficacy of CBMs.
4. Conclusion
(1) In AC, components participating in carbonation include CH, AFt, AFm, and C–S(A)-H gel. After C–S(A)-H gel was carbonized, the silicate network transformed from Q2 units into Q3 units, and the C–S(A)-H chain shrunk. Under the CO2 pressures of 0.01–0.2 MPa, the amount of CaCO3 was detected as 10.81–11.68%. CaCO3 formed under a lower pressure showed a higher decomposition temperature and a better degree of crystallinity.(2) The crystalline products after the carbonation of AC were calcite and gypsum, which were dispersed in the matrix rather than being closely packed. When AC samples were cured at low pressure, the final product calcite, whose width and length were distributed near 1 μm, had a smaller K value (K = 1.3 ± 0.19). When high pressure was used, the calcite, whose width was approximately 0.4 μm and length ranged from 0.6 to 1.4 μm, had an increased K value (K = 2.5 ± 0.44).
(3) The influence of CO2 pressure on the morphology of CaCO3 crystals originated from different crystallization paths. Under low CO2 pressure, ACC nanoparticles gradually aggregated and formed spherical vaterite and then slowly transformed into calcite with the cavity through a solid–solid phase change. Under high CO2 gas pressure, ACC nanoparticles rapidly formed slender calcites composed of scalenohedrons.
(4) The experiments uncovered the different morphological characteristics of CaCO3 crystals in early-age carbonated concrete as well as the mechanisms of carbonation parts in different CO2 pressures. The findings would clarify the mechanisms to control crystallization patterns with rational design and manipulation of materials ' microstructure for better CO2 utilizations.
Author contributions
Jiayu Lu: conceptualization, investigation, formal analysis & original draft. Shengqian Ruan: investigation, review & editing. Yi Liu: supervision, review & editing. Tao Wang: supervision. Qiang Zeng: conceptualization, supervision, review & editing. Dongming Yan: supervision, review & editing. The manuscript was written through contributions of all authors. All authors have given approval to the final version of the manuscript.Conflicts of interest
There are no conflicts of interest to declare.Acknowledgements
The authors acknowledge the financial supports from the National Natural Science Foundation of China (No. 52171277, 51878602, and 52038004).References
- C. B. M. Federation, Carbon Emission Report of China's Building Materials Industry, 2020, http://www.cbmf.org/cbmf/yw/7063198/index.html, (accessed 26 September 2021) Search PubMed
.
- Analysis of Cement Industry Carbon Emission Status and Discussion on Critical Paths of Emission Reduction, http://www.cbmd.cn/actrice/10545.html, accessed accessed 26 September 2021 Search PubMed
.
- Q. Li, L. Zhang, X. Gao and J. Zhang, Constr. Build. Mater., 2020, 230, 116990 CrossRef CAS
.
- P. He, C. S. Poon and D. C. W. Tsang, Cem. Concr. Compos., 2018, 86, 98–109 CrossRef CAS
.
- Z. Tu, C. Shi and N. Farzadnia, J. Mater. Civ. Eng., 2018, 30, 04018164 CrossRef
.
- T. Chen, M. Bai and X. Gao, J. CO2 Util., 2021, 51, 101633 CrossRef CAS
.
- X. Li and T. Ling, J. CO2 Util., 2020, 38, 348–354 CrossRef CAS
.
- L. Wang, L. Chen, D. C. W. Tsang, B. Guo, J. Yang, Z. Shen, D. Hou, Y. S. Ok and C. S. Poon, J. Cleaner Prod., 2020, 258, 120678 CrossRef CAS
.
- H. Mehdizadeh, Y. Meng, M. Guo and T. Ling, Constr. Build. Mater., 2021, 289, 123193 CrossRef CAS
.
- D. Sharma and S. Goyal, J. Cleaner Prod., 2018, 192, 844–854 CrossRef CAS
.
- S. K. Kaliyavaradhan, T. Ling and K. H. Mo, J. CO2 Util., 2020, 42, 101330 CrossRef CAS
.
- T. Chen and X. Gao, ACS Sustainable Chem. Eng., 2020, 8, 3872–3884 CrossRef CAS
.
- B. Liu, J. Qin, J. Shi, J. Jiang, X. Wu and Z. He, Constr. Build. Mater., 2021, 272, 121660 CrossRef CAS
.
- A. Smigelskyte and R. Siauciunas, J. Therm. Anal. Calorim., 2019, 138, 2651–2659 CrossRef CAS
.
- D. Xuan, B. Zhan, C. S. Poon and W. Zheng, Constr. Build. Mater., 2016, 113, 664–672 CrossRef CAS
.
- S. Monkman and Y. Shao, J. Mater. Civ. Eng., 2006, 18, 768–776 CrossRef CAS
.
- D. Zhang, Z. Ghouleh and Y. Shao, J. CO2 Util., 2017, 21, 119–131 CrossRef CAS
.
- B. Song, C. Shi, X. Hu, K. Ouyang, Y. Ding and G. Ke, Constr. Build. Mater., 2021, 288, 123113 CrossRef CAS
.
- L. Qin, X. Gao and T. Chen, Constr. Build. Mater., 2019, 212, 653–662 CrossRef CAS
.
- Y. Wang, S. Liu, L. Zhang, M. Gan, X. Miao, N. Wei, X. Cheng, H. Liu, X. Li and J. Li, Appl. Geochem., 2021, 128, 104937 CrossRef CAS
.
- V. Rostami, Y. Shao and A. J. Boyd, J. Mater. Civ. Eng., 2012, 24, 1221–1229 CrossRef CAS
.
- D. Zhang and Y. Shao, Constr. Build. Mater., 2016, 123, 516–526 CrossRef CAS
.
- M. R. Cabral, E. Y. Nakanishi and J. Fiorelli, J. Mater. Civ. Eng., 2017, 29, 04017018 CrossRef
.
- L. Qin, X. Gao, A. Su and Q. Li, J. Cleaner Prod., 2021, 278, 123897 CrossRef CAS
.
- D. Zhang and Y. Shao, J. CO2 Util., 2018, 27, 137–144 CrossRef CAS
.
- X. Zhong, L. Li, Y. Jiang and T. Ling, Constr. Build. Mater., 2021, 302, 124158 CrossRef CAS
.
- C. Shi and Y. Wu, Resour., Conserv. Recycl., 2008, 52, 1087–1092 CrossRef
.
- B. Kottititum, T. P. Quoc, N. Maes, W. Prakaypan and T. Srinophakun, Appl. Sci., 2018, 8, 190 CrossRef
.
- Z. Tu, M. Guo, C. S. Poon and C. Shi, Cem. Concr. Compos., 2016, 72, 9–16 CrossRef CAS
.
- A. Hidalgo, C. Domingo, C. Garcia, S. Petit, C. Andrade and C. Alonso, J. Mater. Sci., 2008, 43, 3101–3111 CrossRef CAS
.
- Y. Li, W. Liu, F. Xing, S. Wang, L. Tang, S. Lin and Z. Dong, J. CO2 Util., 2020, 35, 303–313 CrossRef CAS
.
- Y. Mu, Z. Liu and F. Wang, ACS Sustainable Chem. Eng., 2019, 7, 7058–7070 CrossRef CAS
.
- X. Ke, M. Criado, J. L. Provis and S. A. Bernal, ACS Sustainable Chem. Eng., 2018, 6, 5067–5075 CrossRef CAS
.
- A. Morandeau, M. Thiery and P. Dangla, Cem. Concr. Res., 2014, 56, 153–170 CrossRef CAS
.
- G. Falini, S. Fermani, M. Goisis and G. Manganelli, Cryst. Growth Des., 2009, 9, 2240–2247 CrossRef CAS
.
- H. Mehdizadeh, X. Jia, K. H. Mo and T. Ling, Environ. Pollut., 2021, 280, 116914 CrossRef CAS PubMed
.
- Z. Yi, T. Wang and R. Guo, J. CO2 Util., 2020, 40, 101196 CrossRef CAS
.
- G. Falini, S. Manara, S. Fermani, N. Roveri, M. Goisis, G. Manganelli and L. Cassar, Crystengcomm, 2007, 9, 1162–1170 RSC
.
- J. Jiang, Q. Zheng, D. Hou, Y. Yan, H. Chen, W. She, S. Wu, D. Guo and W. Sun, Phys. Chem. Chem. Phys., 2018, 20, 14174–14181 RSC
.
- R. Siauciunas, H. Hilbig, E. Prichockiene, A. Smigelskyte and Z. Takulinskas, Ceram. Int., 2020, 46, 29436–29442 CrossRef CAS
.
- M. Li, Q. Wang, J. Yang, X. Guo and W. Zhou, Ksce J. Civ. Eng., 2021, 25, 805–821 CrossRef
.
- D. Yan, J. Lu, Y. Sun, T. Wang, T. Meng, Q. Zeng and Y. Liu, ACS Sustainable Chem. Eng., 2021, 9, 3363–3375 CrossRef CAS
.
- S. Praneeth, R. Guo, T. Wang, B. K. Dubey and A. K. Sarmah, Constr. Build. Mater., 2020, 244, 118363 CrossRef CAS
.
- D. Zhang, V. C. Li and B. R. Ellis, ACS Sustainable Chem. Eng., 2019, 7, 16310–16319 CrossRef CAS
.
- D. Zhang, V. C. Li and B. R. Ellis, ACS Sustainable Chem. Eng., 2018, 6, 15976–15981 CrossRef CAS
.
- I. Mehdipour, G. Falzone, E. C. La Plante, D. Simonetti, N. Neithalath and G. Sant, ACS Sustainable Chem. Eng., 2019, 7, 13053–13061 CrossRef CAS
.
- K. L. Scrivener and A. Nonat, Cem. Concr. Res., 2011, 41, 651–665 CrossRef CAS
.
- S. A. Yaseen, G. A. Yiseen and Z. Li, ACS Omega, 2019, 4, 10160–10170 CrossRef CAS PubMed
.
- B. G. Kutchko, B. R. Strazisar, G. V. Lowry, D. A. Dzombak and N. Thaulow, Environ. Sci. Technol., 2008, 42, 6237–6242 CrossRef CAS PubMed
.
- M. Zhang and S. Bachu, Int. J. Greenhouse Gas Control, 2011, 5, 826–840 CrossRef CAS
.
- E. A. C. Panduro, M. Torsaeter, K. Gawel, R. Bjorge, A. Gibaud, A. Bonnin, C. M. Schlepuetz and D. W. Breiby, Cryst. Growth Des., 2019, 19, 5850–5857 CrossRef
.
- V. G. Papadakis, C. G. Vayenas and M. N. Fardis, ACI Mater. J., 1991, 88, 363–373 CAS
.
- C. Rodriguez-Navarro, K. Elert and R. Sevcik, CrystEngComm, 2016, 18, 6594–6607 RSC
.
- M. R. Cabral, E. Y. Nakanishi, V. Dos Santos, C. Gauss, S. F. Dos Santos and J. Fiorelli, Mater. Struct., 2018, 51, 52 CrossRef
.
- J. Skocek, M. Zajac and M. Ben Haha, Sci. Rep., 2020, 10, 5614 CrossRef CAS PubMed
.
- D. Zhang, Z. Yuan, S. Wang, Y. Jia and G. P. Demopoulos, J. Hazard. Mater., 2015, 300, 272–280 CrossRef CAS PubMed
.
- M. Boumaaza, B. Huet, P. Turcry and A. Ait-Mokhtar, Cem. Concr. Res., 2020, 135, 106113 CrossRef CAS
.
- D. Gastaldi, F. Bertola, F. Canonico, L. Buzzi, S. Mutke, S. Irico, G. Paul, L. Marchese and E. Boccaleri, Cem. Concr. Res., 2018, 109, 30–41 CrossRef CAS
.
- M. Thiery, G. Villain, P. Dangla and G. Platret, Cem. Concr. Res., 2007, 37, 1047–1058 CrossRef CAS
.
- R. Ylmen, L. Wadso and I. Panas, Cem. Concr. Res., 2010, 40, 1541–1546 CrossRef CAS
.
- W. Ashraf and J. Olek, J. Mater. Sci., 2016, 51, 6173–6191 CrossRef CAS
.
- Y. Shao, V. Rostami, Z. He and A. J. Boyd, J. Mater. Civ. Eng., 2014, 26, 117–124 CrossRef CAS
.
- E. E. Coleyshaw, G. Crump and W. P. Griffith, Spectrochim. Acta, Part A, 2003, 59, 2231–2239 CrossRef
.
- R. Chang, D. Choi, M. H. Kim and Y. Park, ACS Sustainable Chem. Eng., 2017, 5, 1659–1667 CrossRef CAS
.
- X. Pan, C. Shi, N. Farzadnia, X. Hu and J. Zheng, Cem. Concr. Compos., 2019, 99, 89–99 CrossRef CAS
.
- G. Villain, M. Thiery and G. Platret, Cem. Concr. Res., 2007, 37, 1182–1192 CrossRef CAS
.
- T. Chen and X. Gao, J. CO2 Util., 2019, 34, 74–86 CrossRef CAS
.
- Y. Meng, T. Ling, K. H. Mo and W. Tian, Sci. Total Environ., 2019, 671, 827–837 CrossRef CAS PubMed
.
- S. Ahmad, R. A. Assaggaf, M. Maslehuddin, O. S. Baghabra Al-Amoudi, S. K. Adekunle and S. I. Ali, Constr. Build. Mater., 2017, 136, 565–573 CrossRef CAS
.
- Y. Liu, Z. Yan, C. W. K. Chow, A. Keegan, N. P. Phuong, D. Li, G. Qian and L. Wang, Sci. Total Environ., 2020, 746, 141182 CrossRef CAS PubMed
.
- D. Aquilano, M. Bruno, F. R. Massaro and M. Rubbo, Cryst. Growth Des., 2011, 11, 3985–3993 CrossRef CAS
.
- R. Beck and J. Andreassen, J. Cryst. Growth, 2010, 312, 2226–2238 CrossRef CAS
.
- A. M. Lopez-Periago, R. Pacciani, L. F. Vega and C. Domingo, Cryst. Growth Des., 2011, 11, 5324–5332 CrossRef CAS
.
- G. Falini, S. Fermani, G. Tosi and E. Dinelli, Cryst. Growth Des., 2009, 9, 2065–2072 CrossRef CAS
.
- D. Di Tommaso and N. H. de Leeuw, Phys. Chem. Chem. Phys., 2010, 12, 894–901 RSC
.
- S. Kerisit and S. C. Parker, J. Am. Chem. Soc., 2004, 126, 10152–10161 CrossRef CAS PubMed
.
- M. R. Nielsen, K. K. Sand, J. D. Rodriguez-Blanco, N. Bovet, J. Generosi, K. N. Dalby and S. L. S. Stipp, Cryst. Growth Des., 2016, 16, 6199–6207 CrossRef CAS
.
- D. Kralj, J. Kontrec, L. Brecevic, G. Falini and V. Nothig-Laslo, Chem.–Eur. J., 2004, 10, 1647–1656 CrossRef CAS PubMed
.
- M. Suzuki, H. Nagasawa and T. Kogure, Cryst. Growth Des., 2006, 6, 2004–2006 CrossRef CAS
.
- L. Addadi, S. Raz and S. Weiner, Adv. Mater., 2003, 15, 959–970 CrossRef CAS
.
- Z. Liu and W. Meng, J. CO2 Util., 2021, 44, 101428 CrossRef CAS
.
- D. Wang, C. Xiong, W. Li and J. Chang, ACS Sustainable Chem. Eng., 2020, 8, 14718–14731 CrossRef CAS
.
- D. Aquilano, F. Otalora, L. Pastero and J. Manuel Garcia-Ruiz, Prog. Cryst. Growth Charact., 2016, 62, 227–251 CrossRef CAS
.
| This journal is © The Royal Society of Chemistry 2022 |

