 Open Access Article
Creative Commons Attribution 3.0 Unported Licence
Preferential and enhanced adsorption of methyl green on different greenly synthesized magnetite nanoparticles: investigation of the influence of the mediating plant extract’s acidity
Kaouthar Ahmouda *ab and
Boubaker Benhaouac
aDepartment of Process Engineering and Petrochemistry, Faculty of Technology, University of El Oued, El Oued, 39000, Algeria. E-mail: ahmouda-kaouthar@univ-eloued.dz
bRenewable Energy in Arid Zones Research Unit, University of El Oued, El Oued, 39000, Algeria
cDepartment of Physics, Faculty of Exact Sciences, University of El Oued, El Oued, 39000, Algeria. E-mail: benhaouab@yahoo.fr
First published on 13th May 2022
Abstract
Four magnetite nanoparticle (NP) samples have been greenly synthesized using four aqueous plant extracts, which are Artemisia herba-alba (L), Rosmarinus officinalis (L), Matricaria pubescens (L), and Juniperus phoenicia (L). The pH of these extracts are acidic (5.25, 5.05, 4.63, and 3.69, respectively). The synthesized samples were characterized by XRD, SEM, ATR-FTIR, and UV-Vis. This work aimed to study the preferential and enhanced adsorption of methyl green (MG) on the four greenly synthesized Fe3O4 surfaces by coupling three processes: MG adsorption in ambient dark conditions as the first process, followed by the thermocatalysis of the MG/Fe3O4 residual solution in the second process, and finally photocatalysis by the UV irradiation of MG/Fe3O4 residual solution after carrying out thermocatalysis. The novelty of this study lies in highlighting the influence of the mediating plant extract’s acidity on the magnetite NPs’ physicochemical characteristics, which impact the preferential and enhanced MG adsorption. The studied physicochemical characteristics are the functional hydroxyl group density on the magnetite surface, grain size, and band gap energy. It was found that the plant extract’s acidity has a clear effect on the studied physicochemical properties. The analysis of the FTIR spectra showed that the hydroxyl group densities differ on the four magnetite samples. Furthermore, the calculated grain sizes of the magnetite samples based on XRD spectra data vary from 29.27 to 41.49 nm. The analysis of the UV-Vis spectra of the four magnetite samples showed that the estimated direct band gap energies vary from 2.87 to 2.97 eV. The obtained results showed that the decrease of the mediating plant extract’s acidity leads to an increase in the hydroxyl group density on magnetite surfaces, which resulted in an increase in the MG adsorption capacities and yields in the first process of adsorption. Thus, MG adsorption was more preferred on greenly synthesized magnetite surfaces mediated by plant extracts with low acidity (Artemisia herba-alba (L) and Rosmarinus officinalis (L)). Furthermore, the increase of the plant extract’s acidity leads to a decrease in the particle size and an increase in the band gap energy and, therefore, to the decrease of the electron/hole pair recombination speed upon electron excitation. So, magnetite greenly synthesized from a more acidic mediating plant extract showed higher thermo- and photocatalytic activities for MG adsorption (Juniperus phoenicia (L) and Matricaria pubescens (L)). However, under photocatalysis, the enhancement is even more significant compared to thermocatalysis.
1 Introduction
Nanomaterials are widely used in the purification of aqueous media.1–4 They allow a rapid thermodynamic equilibrium between adsorbent and adsorbate during the adsorption process and the selective removal of pollutants.5–7 Adsorption has been extensively studied as a cost-effective process for removing a wide variety of pollutants from aqueous solutions, such as dyes.8–10 The adsorption ability of iron oxide NPs arises from the intervention of hydroxyl groups during pollutant dissociation.11Surface hydroxyl groups, with amphoteric properties, are the functional groups of iron oxide surfaces and they are the chemically reactive entities that behave as the active sites in the adsorption process. These hydroxyl groups may be singly, doubly, and triply coordinated to Fe atoms, with different reactivities. The overall density of these groups depends on both the crystal structure and the extent of the development of the different crystal faces.12
Photo- and thermocatalysts absorb photons/phonons with an energy equal to or more than the band gap energy between the valence band (VB) and conduction band (CB) of the photo- or thermocatalyst. Photon/phonon absorption causes charge separation by exciting electrons from the VB to the CB, followed by the generation of positive holes in the VB.13,14 These positive holes oxidize adsorbed H2O molecules and produce hydroxyl radicals (OH˙). Whereas excited electrons reduce the adsorbed O2 in the CB and produce hydroxyl radicals (OH˙). These OH˙ radicals attack the organic groups of the pollutant and undergo various reactions to convert the organic pollutants into non-toxic and non-hazardous forms or completely degrade them into CO2 and H2O.14,15 The photo- and thermogenerated electron/hole pairs exhibit a strong tendency to recombine. Recombination lifetime speed is an important factor that influences the photo- and thermocatalysis efficiency. If the recombination of photo- and thermogenerated charges is slow, then the photo- and thermocatalytic degradation of pollutants is more efficient.16
Several works have studied the thermo- and photocatalysis of dye adsorption on nanomaterials, and they reported the high-efficiency thermo- and photocatalytic activities of nanomaterials. Wu et al.17 studied the thermocatalysis of methylene blue adsorption on magnetite Fe3O4@C NPs. They found that an increase of temperature leads to an increase of methylene blue thermodegradation, which indicates the high thermocatalytic activity of the studied nanomaterial. Other authors18 studied the thermocatalysis of N719 dye on anatase TiO2 nanosheets with dominant (001) facets and TiO2 NPs with dominant (101) facets. They found that an increase of temperature leads to an increase of N719 dye thermodegradation on both studied nano-adsorbents due to the thermocatalytic activity of TiO2 NPs. Farghali et al.19 studied the thermocatalysis of methylene blue on multi-walled carbon nanotubes decorated with CoFe2O4 NPs by increasing the temperature. They reported that this nanocomposite showed efficient thermocatalytic activity.
Furthermore, Ge et al.20 studied the photocatalysis of methylene blue and methyl orange adsorption on iron oxide anchored to single-wall carbon nanotubes by UV irradiation. They reported that the studied adsorbent showed efficient photocatalytic activity. Elhadj et al.21 studied the photocatalysis of Basic Red 46 dye adsorption over ZnO NPs under solar irradiation. They reported that ZnO NPs exhibit high photocatalytic activity. Moreover, Kumar et al.22 studied the photodegradation of methylene blue (MB), Congo red (CR), and methylene orange (MO) under sunlight irradiation in the presence of greenly synthesized magnetite mediated by Andean blackberry leaf extract. They reported that the presence of those magnetite NPs accelerated the photodegradation of the three dyes due to their high photocatalytic activity. Sirdeshpande et al.23 studied the photodegradation of malachite green under sunlight irradiation in the presence of greenly synthesized magnetite using leaf extract of Calliandra haematocephala. They reported that the presence of those magnetite NPs increased the photodegradation of malachite green. Other authors24 compared the photocatalytic activity of several composites of titanium dioxide containing magnetite NPs with different morphologies and structures in the photodegradation of Rhodamine B by UV irradiation. They reported that the highest dye photodegradation was observed when both spherical and rod-shaped composite structures based on titanium dioxide containing 1 wt% of magnetite NPs were used as a photocatalyst. Jassal et al.25 studied the thermo- and photodegradation of malachite green (MG) and Eriochrome Black T (EBT) dyes on greenly synthesized potassium zinc hexacyanoferrate nanocubes. They found that this adsorbent acted as a photocatalyst, not a thermocatalyst.
Several parameters can impact photo- and thermocatalysis processes, such as solution pH, adsorbent concentration, dye concentration, solution ionic strength, temperature,25–28 dye structure properties,29,30 adsorbent particle size,31 gap energy, recombination lifetime of the electron/hole pairs,32,33 adsorbent type,34,35 light source and time of light exposure.34 Ullah et al.32 reported that a Mn2+ dopant in the ZnO NPs decreased the recombination of the electron/hole pairs, which enhanced the photocatalytic activity efficiency for the removal of dyes. Rafaie et al.33 studied the photocatalytic properties of ZnO NPs microstructures decorated with Ag NPs for the degradation of methylene blue under UV irradiation. They reported that the Ag NPs played the role of electron sinks and trapped the photogenerated electrons, which increased the electron/hole pair lifetime. As a result, the ZnO–Ag nanostructure exhibited higher photocatalytic activity for the degradation of MB dye.
Saha et al.5 studied the preferential adsorption of seven different dyes on magnetite NPs. They reported that the magnetite surface preferred adsorbing dyes containing higher OH content. Xiao et al.36 studied the preferential adsorption of different cationic and anionic dyes on iron NPs. They reported that iron NPs preferred removing cationic dyes over anionic dyes. Madrakian et al.37 studied the preferential adsorption of seven cationic and anionic dyes on magnetite-coated waste tea. They reported that the adsorption capacities of these NP adsorbents for the adsorption of cationic dyes were more increased compared to those for anionic dyes.
Several factors can influence the adsorption, such as the solution pH,12 solution ionic strength,38 dye concentration,39 magnetite NP concentration,5 and hydroxyl group density on the adsorbent surface.40 The impact of changing plants on greenly synthesized metal oxide NPs’ reactivity in dye adsorption has been studied in several works. Huang et al.41 studied the effect of three different tea extracts (green, oolong, and black teas) on the properties of iron oxide NP surfaces and their reactivities in the removal of methyl green from aqueous solutions. They reported that the plant extract has an effect on the reactivity of the iron oxide NP surfaces, with 81.2%, 75.6%, and 67.1% of methyl green dye being removed by iron oxide NPs synthesized using the extracts of green, oolong, and black teas, respectively. Likewise, Xiao et al.36 studied the removal of six cationic and anionic dyes. They reported that iron NPs greenly synthesized with tea extract showed preferential adsorption of cationic dyes from an aqueous solution. Other authors42 synthesized metal oxide NPs using the extracts of flowers, bark, and the leaf of Tecoma stans in order to use them in the removal of Congo red (CR) and crystal violet (CV) dyes. They reported that the adsorbent derived from flower extract gave better dye adsorption efficiency than those derived from other extracts. Furthermore, Islam et al.43 synthesized magnetite NPs using six plant extracts in order to use them in the removal of methyl orange (MO) and crystal violet (CV) dyes. They reported that the plant extract had an effect on the magnetite NPs’ surface reactivity in the adsorption, where magnetite NPs synthesized using tea extract showed the highest performance (MO 92.34%, CV 96.1%).
In this paper, the preferential and enhanced adsorption of MG on four greenly synthesized Fe3O4 NP surfaces has been studied by coupling three processes. The preferential adsorption of MG on the four magnetite surfaces in ambient dark conditions is the first process, followed by the adsorption enhancement by the thermocatalysis of MG/Fe3O4 residual solutions in dark conditions at the second process, and finally the adsorption enhancement by photocatalysis under UV irradiation (365 nm) in ambient conditions of the MG/Fe3O4 residual solutions after thermocatalysis. The focus of this study is the investigation of the influence of the mediating plant extract’s acidity on the greenly synthesized magnetite NPs’ physicochemical characteristics, which impact the preferential and enhanced MG adsorption. The studied physicochemical characteristics are the functional hydroxyl group density on the magnetite surfaces, grain size, and band gap energy. The mediating plants in the green synthesis are Artemisia herba-alba (L), Matricaria pubescens (L), Juniperus phoenicia (L), and Rosmarinus officinalis (L), and synthesized Fe3O4 samples from their extracts are respectively denoted in this paper as ARM-Fe3O4, MAT-Fe3O4, JUN-Fe3O4 and ROS-Fe3O4. The Fe3O4 NP samples were characterized by XRD, SEM, FTIR-ATR, and UV-Vis techniques. In preferential MG adsorption, the pseudo-first-order and pseudo-second-order kinetics of the adsorption, as well as the intra-particle diffusion mechanism, have been analyzed. Under thermocatalysis, the activated thermodynamic parameters of free energy (ΔG0), entropy (ΔS0), enthalpy (ΔH0), and activation energy (Ea) have been analyzed. Under photocatalysis, the pseudo-first-order kinetics have also been analyzed.
The remainder of this paper is organized as follows. The next section gives a description of the materials used and methods followed during experiments. In Section 3, the obtained results are presented and discussed by analyzing the XRD, SEM, FTIR-ATR, and UV-Vis data. Section 3.7 is then devoted to presenting the effect of the plant extract’s acidity on the physicochemical properties of greenly synthesized Fe3O4 in the preferential and enhanced methyl green adsorption. The last section presents the conclusions.
2 Materials and methods
This section focuses on listing the materials needed and apparatuses used. It also provides details of the methods utilized to perform the adsorption experiments and characterization of the iron oxide NPs.2.1 Materials
2.2 Methods
In this section, the methods used for solution preparation are described. The protocol used in the adsorption experiments of iron oxide NPs and characterization techniques are described as well.All experiment sets were sonicated in an ultrasonic bath for 15 minutes and they were then stirred continually for 60 minutes until a steady state was reached. All adsorption experiments were carried out in ambient dark conditions in batch mode, and they were performed in triplicate for data consistency.
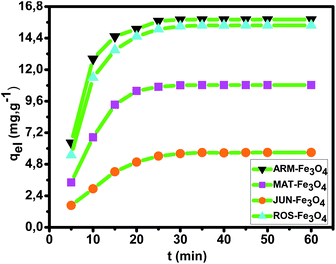
Kinetic experiments were performed by withdrawing samples of the MG/Fe3O4 solutions at regular time intervals to obtain, after centrifugation, adequate aliquots for the purpose of quantifying the residual dye concentrations and the adsorbed amounts. The concentrations of the aqueous solutions of the residual dye were quantified using a UV-Vis spectrophotometer at an absorbance maxima of MG λmax = 249 nm. Furthermore, the adsorbed amounts of MG molecules were calculated from the calibration curve for all adsorption experiments (Y = 42.049X − 0.2885, R2 = 0.996). In order to obtain the adsorption capacity qeI (mg g−1) and the amount of MG cations adsorbed per unit mass (qtI in (mg g−1)) of magnetite NPs at the equilibrium contact time in the first process of MG adsorption, the following equations were used:
 | (1) |
 | (2) |
Adsorption yield was calculated using the following equation:
 | (3) |
 | (4) |
After integration by the conditions qtI = 0 at t = 0 and qt = qtI at t = t, then eqn (4) becomes:
| ln(qeI−qtI) = lnqeI−K1, | (5) |
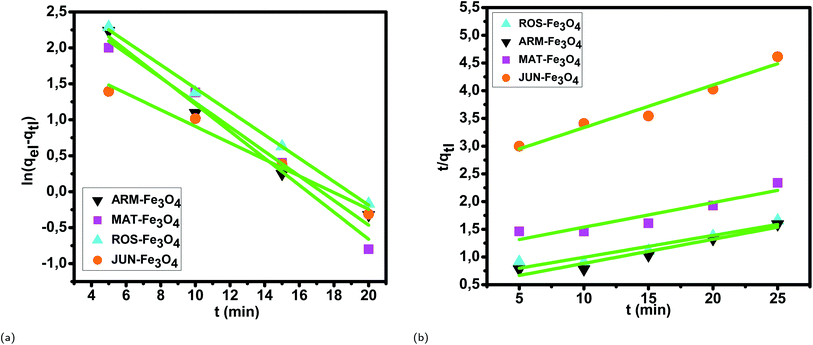
If the active surface of the adsorbent is regarded as invariable, the reaction could be treated as pseudo-first-order. However, once the active sites have been saturated, the transfer at the pollutant/adsorbent particle interface may be limited by mass transfer.49
The pseudo-second-order (PSO) model (eqn (6)) is proposed by Ho and McKay.45 It is based on the adsorption capacity, expressed as follow:
 | (6) |
 | (7) |
 | (8) |
A further formula alteration gives the following:
 | (9) |
Additionally, eqn (10) can be used when the rate of adsorption is controlled by liquid film diffusion.51
 | (10) |
| −ln(1 − F) = Kft | (11) |
The values of kf = 3DfCeI/r0δCrI of the MG/ARM-Fe3O4, MG/ROS-Fe3O4, MG/MAT-Fe3O4, and MG/JUN-Fe3O4 adsorption processes were obtained from the slopes of the fitted lines (plots of −ln(1 − F) vs. time), and the values of the effective diffusion coefficient, Df(m2 s−1), could then be obtained from Df = kfr0CrI/3CeI.
The linearity test of Boyd plots (−ln(1 − F) and −ln(1 − F2) versus time plots) was employed to distinguish between the film diffusion and particle diffusion-controlled adsorption mechanisms. If the plot of −ln(1 − F) versus time is a straight line passing through the origin, then the adsorption rate is governed by the particle diffusion mechanism; otherwise, if −ln(1 − F2) versus time is a straight line passing through the origin, then the adsorption is governed by film diffusion.
 | (12) |
Adsorption yield was calculated using the following equation:
 | (13) |
The activated enthalpy (ΔH0) of MG adsorption on the magnetite NP surface was determined using the Arrhenius equation as follows:
 | (14) |
 | (15) |
The values of activated enthalpy (ΔH0) and entropy (ΔS0) were calculated from the slope and intercept of the plot of ln![[thin space (1/6-em)]](https://www.rsc.org/images/entities/char_2009.gif) Kd versus 1/T. ΔG0 was then calculated using the following equation:
Kd versus 1/T. ΔG0 was then calculated using the following equation:
ΔG0 = −RT![[thin space (1/6-em)]](https://www.rsc.org/images/entities/char_2009.gif) ln ln![[thin space (1/6-em)]](https://www.rsc.org/images/entities/char_2009.gif) Kd. Kd.
| (16) |
The free energy change indicates the degree of the spontaneity of the adsorption process and the higher negative value reflects more energetically favorable adsorption. The activation energy (ΔEa) of MG adsorption on magnetite surface is determined using the following Arrhenius’s equation:
 | (17) |
 | (18) |
 | (19) |
Adsorption yield was calculated using the following equation:
 | (20) |
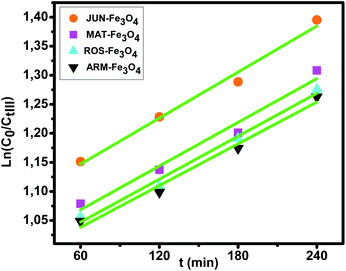
The degradation kinetics of MG using Fe3O4 NPs can be expressed as a pseudo-first-order (PFO) reaction as follows:
| ln(C0/CtIII) = kpd·t | (21) |
3 Results and discussion
3.1 X-ray analysis of the Fe3O4 NPs samples
X-ray patterns of all the synthesised samples are presented in Fig. 2. It is found that all synthesized samples have crystalline structures. The X-ray diffraction pattern (A) in Fig. 2 exhibits Bragg reflection peaks at around 2θ° = 16.20°, 20.30°, 22.39°, 25.60°, 29.72°, 32.30°, 41.05°, 41.39°, 42.48°, and 52.69°. All Bragg peaks are in agreement with those of orthorhombic Fe3O4 powder and correspond to the Miller indices 021, 212, 030, 400, 106, 001, 250, 251, 522, and 644, respectively (JCPDF file 01-076-0958).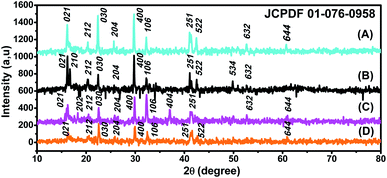 | ||
| Fig. 2 XRD patterns of (A) ROS-Fe3O4, (B) ARM-Fe3O4, (C) MAT-Fe3O4, and (D) JUN-Fe3O4 NPs. JCPDF file 01-076-0958. | ||
The X-ray diffraction pattern (B) in Fig. 2 exhibits Bragg reflection peaks at around 2θ° = 16.20°, 16.70°, 20.39°, 22.42°, 29.75°, 30.80°, 32.30°, 41.10°, 42.53°, 49.82°, and 52.72°. All Bragg peaks are in agreement with those of orthorhombic Fe3O4 powder and correspond to the Miller indices 021, 210, 212, 030, 400, 041, 106, 251, 522, 534, and 644, respectively (JCPDF file 01-076-0958).
The X-ray diffraction pattern (C) in Fig. 2 exhibits Bragg reflection peaks at around 2θ° = 16.20°, 18.31°, 22.56°, 26.04°, 32.28°, 37.11°, 41.59°, 49.98°, and 52.69°. All Bragg peaks are in agreement with those of orthorhombic Fe3O4 powder and corresponding to Miller indices 021, 202, 030, 400, 106, 404, 251, 534, and 644, respectively (JCPDF file 01-076-0958).
The X-ray diffraction pattern (D) in Fig. 2 exhibits Bragg reflection peaks at around 2θ° = 16.35°, 20.58°, 22.60°, 25.77°, 29.94°, 32.47°, 41.59°, 42.69°, 49.98°, and 52.69°. All Bragg peaks are in agreement with those of orthorhombic Fe3O4 powder and corresponding to the Miller indices 021, 212, 030, 400, 001, 106, 251, 522, 534, and 644, respectively (JCPDF file 01-076-0958).
The average diameters of the different Fe3O4 samples, presented in Table 1, were calculated from the XRD patterns using Scherrer’s equation:53
 | (22) |
| Sample | Average diameter (nm) |
|---|---|
| ARM-Fe3O4 | 41.49 |
| ROS-Fe3O4 | 39.89 |
| MAT-Fe3O4 | 33.13 |
| JUN-Fe3O4 | 29.27 |
3.2 FTIR-ATR spectroscopy analysis
The FTIR spectra of the synthesized Fe3O4 NPs powders recorded between 4000 and 500 cm−1 are presented in Fig. 3. Fig. 3 shows that all IR spectra (A, B, C, and D) exhibit peaks in different ranges, as summarized in Table 2. The peaks at 3223.41–3266.69 cm−1 correspond to O–H stretching vibrations, whereas the peaks at 2930.18–2932.06 cm−1 correspond to C–H vibrations. The peaks at 1590.07–1594.63 cm−1 correspond to C![[double bond, length as m-dash]](https://www.rsc.org/images/entities/char_e001.gif) C stretching in aromatic rings and the anti-symmetric stretching of the carboxylate group (COO−), whereas peaks at 1033.45–1044.36 cm−1 are assigned to the C–O–C of the phenolic groups.22 The peak at around 592 cm−1 corresponds to the Fe–O stretching band of Fe3O4 NPs.54
C stretching in aromatic rings and the anti-symmetric stretching of the carboxylate group (COO−), whereas peaks at 1033.45–1044.36 cm−1 are assigned to the C–O–C of the phenolic groups.22 The peak at around 592 cm−1 corresponds to the Fe–O stretching band of Fe3O4 NPs.54
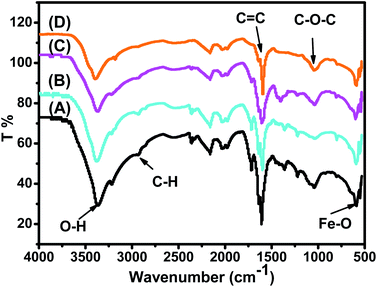 | ||
| Fig. 3 IR spectra of synthesized (A) ARM-Fe3O4, (B) ROS-Fe3O4, (C) MAT-Fe3O4, and (D) JUN-Fe3O4 NP powders. | ||
| Sample | O–H (cm−1) | C–H (cm−1) | CC (cm−1) | C–O–C (cm−1) | Fe–O (cm−1) |
|---|---|---|---|---|---|
| ARM-Fe3O4 | 3266.69 | 2932.06 | 1590.07 | 1036.36 | 592.64 |
| ROS-Fe3O4 | 3249.77 | 2930.18 | 1590.83 | 1038.75 | 591.83 |
| MAT-Fe3O4 | 3235.57 | 2929.75 | 1591.21 | 1039.54 | 592.46 |
| JUN-Fe3O4 | 3223.41 | 2928.82 | 1594.63 | 1039.45 | 592.69 |
Fig. 3 shows that the peaks of hydroxyl groups appear with remarkably different areas. The hydroxyl group peak area appears to be the broadest on the ARM-Fe3O4 surface, next on ROS-Fe3O4, then on MAT-Fe3O4, and finally on JUN-Fe3O4. This reveals that the density of functional OH groups is higher on the ARM-Fe3O4 surface, next on ROS-Fe3O4, then on MAT-Fe3O4, and finally on JUN-Fe3O4.
3.3 UV-Vis spectroscopy analysis
The optical absorbance spectra of all Fe3O4 samples were measured in the wavelength range of 200–900 nm. The band gap energies of the Fe3O4 samples were then deduced from those spectra. The band gap (Eg) and the optical absorption coefficient (α) of a semiconductor are related through the known following equation:55| αhν = A(hν−Eg)n | (23) |
 | ||
| Fig. 4 Four plots of (αhν)2 versus (αhν) for the direct transition of the synthesized Fe3O4 NP samples sonicated in acetone for 15 min. | ||
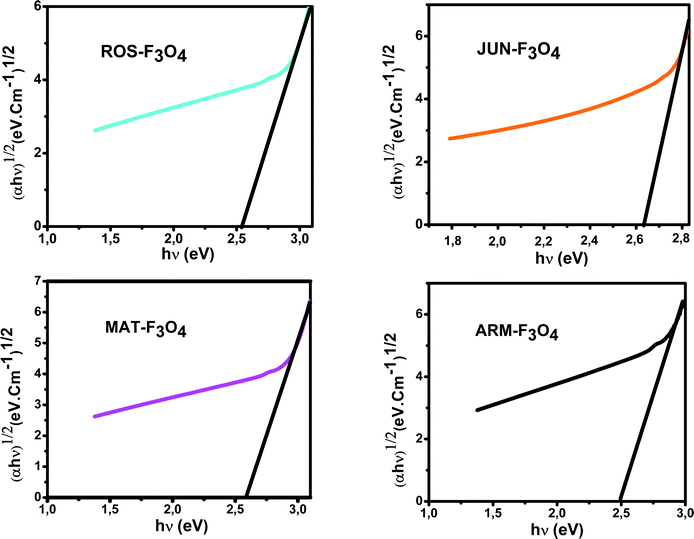 | ||
| Fig. 5 Four plots of (αhν)1/2 versus (αhν) for the indirect transition of the synthesized Fe3O4 NP samples sonicated in acetone for 15 min. | ||
The estimated indirect band gap energies of the ARM-Fe3O4, ROS-Fe3O4, MAT-Fe3O4 and JUN-Fe3O4 samples were found to be 2.51, 2.55, 2.60 and 2.64 eV, respectively, which are higher than the reported reference value.56 It was previously found that the indirect gap energy of Fe3O4 equals Eg = 1.92 eV. The estimated direct band gap energies of the JUN-Fe3O4, MAT-Fe3O4, ROS-Fe3O4 and ARM-Fe3O4 samples were found to be 2.97, 2.95, 2.94 and 2.87 eV, respectively, which are close to that found by El Ghandoor et al.56 They found that the direct gap energy for Fe3O4 equals Eg = 2.87 eV. It is clear that the direct gap energy is closer to the theoretical value than the indirect gap energy. The values of all direct band gap energies of the magnetite NP samples classify them as semiconductors. The energy band gaps of semiconductors are between 0 and 3 eV.57
3.4 SEM images of the greenly synthesised Fe3O4 NP samples
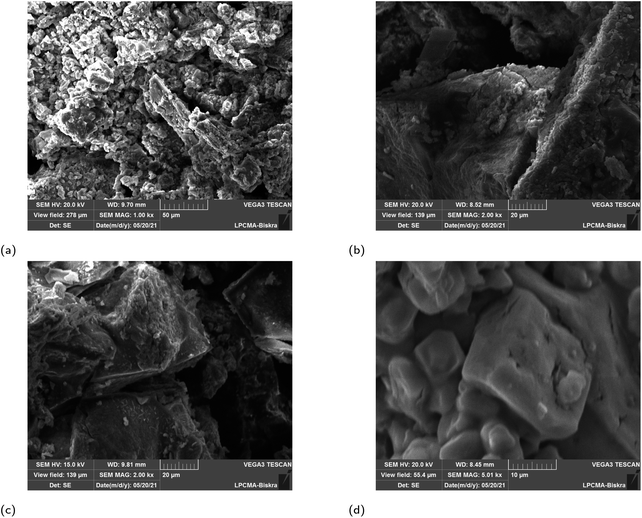
SEM images of the synthesized iron oxide NP samples are presented in Fig. 6. It is clearly shown that the structures of all four magnetite NPs depend on the plant extract. Different irregular shapes are observed in all samples as rock shapes. For ROS-Fe3O4 NPs, it is clear that a few agglomerations, which appear like rocks, are present, as shown in Fig. 6a. Whereas for the JUN-Fe3O4 NPs, mountain-like structures with bigger rocks are present, as shown in Fig. 6b. However, for MAT-Fe3O4, a decrease in the dimension of the mountain-like structures, with more adherence to its structure, is observed (Fig. 6c). Finally, the ARM-Fe3O4 SEM image contains some big structured single bipyramid crystals, as shown in Fig. 6d.3.5 The analysis of MG adsorption kinetics and thermodynamics
| Sample | qeI,exp (mg g−1) | qeI,cal (mg g−1) | K1·10−3 (mn−1) | R2 | qeI,cal (mg g−1) | K2·10−3 (g mg−1 mn−1) | R2 |
|---|---|---|---|---|---|---|---|
| ARM-Fe3O4 | 15.81 | 18.92 | 5.76 | 0.9783 | 22.99 | 3.78 | 0.9387 |
| ROS-Fe3O4 | 15.37 | 21.33 | 9.39 | 0.9984 | 25.32 | 2.60 | 0.9220 |
| MAT-Fe3O4 | 10.83 | 19.88 | 8.86 | 0.9902 | 22.32 | 1.85 | 0.9028 |
| JUN-Fe3O4 | 05.69 | 07.84 | 8.53 | 0.9839 | 13.00 | 2.31 | 0.9607 |
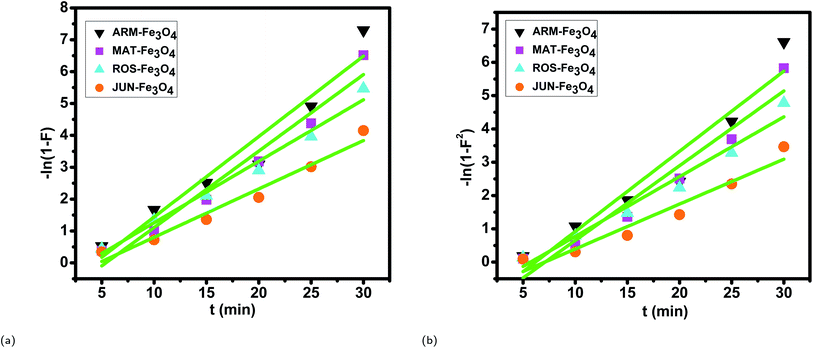 | ||
| Fig. 9 Boyd plots of MG adsorption on Fe3O4 surfaces in the first process of adsorption: (a) plots of −ln(1 − F) versus time and (b) plots of −ln(1 − F2) versus time. | ||
| PLANT-Fe3O4 | r0·10−9 (m) | kp·10−3 (1/s) | R2 | Dp·10−19 (m2 s−1) | kf·10−3 (1/s) | R2 | CrI·10−3 (mg g−1) | CaI·10−3 (mg g−1) | Df·10−11 (m2 s−1) |
|---|---|---|---|---|---|---|---|---|---|
| ARM | 41.94 | 2.68 | 0.9411 | 4.77 | 5.61 | 0.9594 | 5.17 | 5.93 | 6.84 |
| ROS | 39.89 | 2.00 | 0.9736 | 3.22 | 4.29 | 0.9826 | 5.34 | 5.76 | 5.28 |
| MAT | 33.13 | 2.67 | 0.9645 | 2.97 | 5.32 | 0.9599 | 7.11 | 3.99 | 10.49 |
| JUN | 29.27 | 1.50 | 0.9544 | 1.30 | 3.38 | 0.9701 | 8.96 | 2.14 | 13.81 |
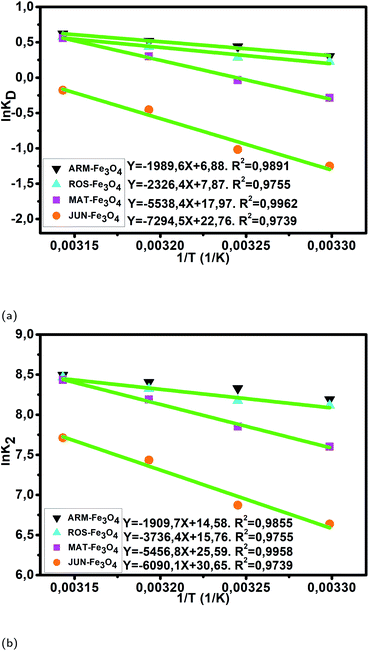
![[thin space (1/6-em)]](https://www.rsc.org/images/entities/char_2009.gif) kD versus 1/T (Fig. 10a). The activated enthalpies in all four MG/Fe3O4 systems are positive, which indicates the endothermic nature of the adsorption processes and possible strong bonding between MG molecules and functional hydroxyl groups on Fe3O4 surfaces. The found activated enthalpy of the MG/JUN-Fe3O4 system (14.49 kcal mol−1) is the highest one, and that of the MG/ARM-Fe3O4 system (4.59 kcal mol−1) is the lowest one. This indicates that the bonding between MG molecules and hydroxyl groups on the JUN-Fe3O4 NP surface is the strongest, then on MAT-Fe3O4, next on ROS-Fe3O4, and finally on the ARM-Fe3O4 NP surface.
kD versus 1/T (Fig. 10a). The activated enthalpies in all four MG/Fe3O4 systems are positive, which indicates the endothermic nature of the adsorption processes and possible strong bonding between MG molecules and functional hydroxyl groups on Fe3O4 surfaces. The found activated enthalpy of the MG/JUN-Fe3O4 system (14.49 kcal mol−1) is the highest one, and that of the MG/ARM-Fe3O4 system (4.59 kcal mol−1) is the lowest one. This indicates that the bonding between MG molecules and hydroxyl groups on the JUN-Fe3O4 NP surface is the strongest, then on MAT-Fe3O4, next on ROS-Fe3O4, and finally on the ARM-Fe3O4 NP surface.
| Sample | T (K) | ln![[thin space (1/6-em)]](https://www.rsc.org/images/entities/char_2009.gif) KD KD |
ln![[thin space (1/6-em)]](https://www.rsc.org/images/entities/char_2009.gif) K2 K2 |
Ea (kcal mol−1) | ΔH0 (kcal mol−1) | ΔS0 (cal mol−1 K−1) | ΔG0 (kcal mol−1) |
|---|---|---|---|---|---|---|---|
| MG/ARM-Fe3O4 | 303.15 | 0.30 | 8.19 | 3.79 | 3.95 | 13.48 | −0.18 |
| 308.15 | 0.44 | 8.33 | −0.27 | ||||
| 313.15 | 0.52 | 8.41 | −0.32 | ||||
| 318.15 | 0.62 | 8.49 | −0.39 | ||||
| MG/ROS-Fe3O4 | 303.15 | 0.23 | 8.17 | 7.42 | 4.62 | 15.64 | −0.14 |
| 308.15 | 0.29 | 8.31 | −0.17 | ||||
| 313.15 | 0.44 | 8.61 | −0.27 | ||||
| 318.15 | 0.58 | 8.72 | −0.37 | ||||
| MG/MAT-Fe3O4 | 303.15 | −0.28 | 7.60 | 10.84 | 11.00 | 35.70 | 0.17 |
| 308.15 | −0.04 | 7.85 | 0.02 | ||||
| 313.15 | 0.30 | 8.19 | −0.19 | ||||
| 318.15 | 0.56 | 8.43 | −0.35 | ||||
| MG/JUN-Fe3O4 | 303.15 | −1.25 | 6.64 | 12.10 | 14.49 | 45.23 | 0.75 |
| 308.15 | −1.01 | 6.87 | 0.62 | ||||
| 313.15 | −0.45 | 7.44 | 0.28 | ||||
| 318.15 | −0.18 | 7.71 | 0.11 |
The activated entropies in all four MG/Fe3O4 systems are positive, which reveals the affinity of the Fe3O4 surfaces for MG molecules. The increasing randomness at the MG/Fe3O4 solution interface indicates that a highly significant change in the surface active hydroxyl group number occurred in the internal structure of the Fe3O4 surfaces. However, the activated entropy of the MG/JUN-Fe3O4 system is the highest one (45.23 cal mol−1 K−1), and that of MG/ARM-Fe3O4 (15.58 cal mol−1 K−1) is the lowest one. This indicates that the changes occurring in the structure of the JUN-Fe3O4 NPs’ surface are the largest ones, then of MAT-Fe3O4, next of ROS-Fe3O4, and finally of the ARM-Fe3O4 NP surface.59,60
The activated free energies of the MG/ARM-Fe3O4 (−0.18, −0.24, −0.32, and −0.39 kcal mol−1) and MG/ROS-Fe3O4 (−0.14, −0.17, −0.27, and −0.37 kcal mol−1) systems are both negative. However, the activated energies of the MG/ARM-Fe3O4 system are more negative than those of the MG/ROS-Fe3O4 system, which indicates the feasibility of the MG adsorption process and its spontaneous nature, with more MG adsorption on ARM-Fe3O4 than on the ROS-Fe3O4 surface. In the MG/MAT-Fe3O4 system, the values of the activated free energies are negative only at 313.15 K and 318.15 K (−0.19 and −0.35 kcal mol−1, respectively), while positive values are found at 303.15 K and 308.15 K (0.17 and 0.022 kcal mol−1, respectively). This demonstrates the spontaneity of MG adsorption at 313.15 K and 318.15 K. The activated free energies of the MG/JUN-Fe3O4 system (0.75, 0.62, 0.28, and 0.11 kcal mol−1) are positive, revealing that the activated MG/Fe3O4 complexes are in an excited form in the transition state.59
As presented in Table 5, the found activation energies (Ea) for MG adsorption on the ARM-Fe3O4, ROS-Fe3O4, MAT-Fe3O4 and JUN-Fe3O4 surfaces are, respectively, 4.43, 7.42, 10.84, and 12.10 kcal mol−1. Ea is calculated from the slopes of the Arrhenius linear plots of ln![[thin space (1/6-em)]](https://www.rsc.org/images/entities/char_2009.gif) k2 versus 1/T (Fig. 10b). The found low Ea suggests that MG adsorption on Fe3O4 proceeds with a low energy barrier and can be achieved at relatively low temperatures. As it is known that the activation energy Ea of physical adsorption ranges from 1.2 to 12 kcal mol−1, and from 14.3 to 191 kcal mol−1 for chemical adsorption,61 the adsorption processes of MG on all four Fe3O4 samples are therefore physical in nature.
k2 versus 1/T (Fig. 10b). The found low Ea suggests that MG adsorption on Fe3O4 proceeds with a low energy barrier and can be achieved at relatively low temperatures. As it is known that the activation energy Ea of physical adsorption ranges from 1.2 to 12 kcal mol−1, and from 14.3 to 191 kcal mol−1 for chemical adsorption,61 the adsorption processes of MG on all four Fe3O4 samples are therefore physical in nature.
3.6 Preferential and enhanced MG adsorption on magnetite surfaces
| Adsorbent | qeI (mg g−1) | MG RI% |
|---|---|---|
| ARM-Fe3O4 | 15.81 | 53,42 |
| ROS-Fe3O4 | 15.37 | 51.90 |
| MAT-Fe3O4 | 10.83 | 35.91 |
| JUN-Fe3O4 | 05.70 | 19.25 |
It is known that complexation and electrostatic interactions play important roles in determining the efficiency of adsorption.6 When Fe3O4 is immersed in the aqueous acidic solution, it develops its surface charge via the protonation and deprotonation of ![[triple bond, length as m-dash]](https://www.rsc.org/images/entities/char_e002.gif) Fe–OH active sites on its surface according to the following equation:62
Fe–OH active sites on its surface according to the following equation:62
![[triple bond, length as m-dash]](https://www.rsc.org/images/entities/char_e002.gif) Fe–OH2+ ↔ Fe–OH2+ ↔ ![[triple bond, length as m-dash]](https://www.rsc.org/images/entities/char_e002.gif) FeOH0 + Hsol+ (pKa1 = 5.1) FeOH0 + Hsol+ (pKa1 = 5.1)
| (24) |
![[triple bond, length as m-dash]](https://www.rsc.org/images/entities/char_e002.gif) Fe–OH2+ and
Fe–OH2+ and ![[triple bond, length as m-dash]](https://www.rsc.org/images/entities/char_e002.gif) Fe–OH0 are, respectively, the protonated positively charged acid site of the surface with two dissociable H+, and the neutral acid site of the surface with one dissociable H+. pKa1 = 5.1 is the intrinsic acidity constant determined by Davis et al.62 for Fe3O4. The binding of MG cations with functional groups, such as OH, from the magnetite surface can be expressed as follows:
Fe–OH0 are, respectively, the protonated positively charged acid site of the surface with two dissociable H+, and the neutral acid site of the surface with one dissociable H+. pKa1 = 5.1 is the intrinsic acidity constant determined by Davis et al.62 for Fe3O4. The binding of MG cations with functional groups, such as OH, from the magnetite surface can be expressed as follows:
2![[triple bond, length as m-dash]](https://www.rsc.org/images/entities/char_e002.gif) Fe–OH + dye2+ ↔ Fe–OH + dye2+ ↔ ![[triple bond, length as m-dash]](https://www.rsc.org/images/entities/char_e002.gif) (Fe–OH)2–dye2+ (Fe–OH)2–dye2+
| (25) |
![[triple bond, length as m-dash]](https://www.rsc.org/images/entities/char_e002.gif) (Fe–OH)2–dye2+ is a binuclear bonding complex due to hydrogen bonding between MG cations and the surface hydroxyl groups on magnetite NP surfaces.
(Fe–OH)2–dye2+ is a binuclear bonding complex due to hydrogen bonding between MG cations and the surface hydroxyl groups on magnetite NP surfaces.
For the four magnetite NPs, the data provided by FTIR analysis (see Section 3.2, Fig. 3) show that the density of OH groups on the ARM-Fe3O4 surface is the highest one, next to ROS-Fe3O4, then MAT-Fe3O4, and finally JUN-Fe3O4. As these hydroxyl groups behave as active sites on the Fe3O4 surfaces, the results found show that MG adsorption yield is more increased on magnetite NP samples that have more OH groups, i.e. more ![[triple bond, length as m-dash]](https://www.rsc.org/images/entities/char_e002.gif) Fe–OH active sites.
Fe–OH active sites.
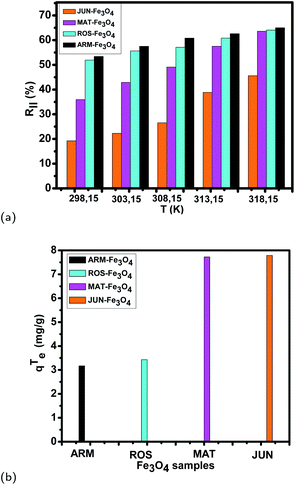
The thermocatalysis effect on MG adsorption on all four magnetite samples was evaluated by assessing the efficiency of the degradation of MG by thermocatalysis in dark conditions in a temperature range from 303.15 K to 318.15 for 20 minutes. Fig. 12a and Table 7 present the comparison of the MG adsorption yield and capacity of the four Fe3O4 surfaces in the first process of MG adsorption and in the second process in dark conditions under thermocatalysis. The data show that the MG adsorption yield and capacity increase with the increase of temperature in all adsorption experiments, which confirms the endothermic nature of the adsorption processes, as discussed in Section 3.5.4.
| Sample | 298.15 K | 303.15 K | 308.15 K | 313.15 K | 318.15 K | |||||
|---|---|---|---|---|---|---|---|---|---|---|
| qeI (mg g−1) | RI% | qeII (mg g−1) | RII% | qeII(mg g−1) | RII% | qeII(mg g−1) | RII% | qeII (mg g−1) | RII% | |
| MG/ARM-Fe3O4 | 15.81 | 53.42 | 17.01 | 57.48 | 18.00 | 60.81 | 18.53 | 62.61 | 18.98 | 65.01 |
| MG/ROS-Fe3O4 | 15.37 | 51.90 | 16.32 | 55.64 | 16.75 | 57.09 | 17.81 | 60.83 | 18.80 | 64.09 |
| MG/MAT-Fe3O4 | 10.83 | 35.91 | 12.69 | 42.88 | 14.53 | 49.10 | 17.01 | 57.48 | 18.56 | 63.60 |
| MG/JUN-Fe3O4 | 05.70 | 19.25 | 06.59 | 22.25 | 07.87 | 26.58 | 11.49 | 38.83 | 13.49 | 45.59 |
Yields and adsorption capacities are increased as follows (the yield after thermocatalysis is denoted as RII% and the adsorption capacity as qeII):
• On ARM-Fe3O4, the yield increased from RI% = 53.42% to RII% = 65.01%, and the adsorption capacity increased from qeI = 15.81 to qeII = 18.98 mg g−1.
• On ROS-Fe3O4, the yield increased from RI% = 51.90% to RII% = 64.09%, and the adsorption capacity increased from qeI = 15.37 to qeII = 18.80 mg g−1.
• On MAT-Fe3O4, the yield increased from RI% = 35.91% to RII% = 63.60%, and the adsorption capacity increased from qeI% = 10.83 to qeII% = 18.56 mg g−1.
• On JUN-Fe3O4, the yield increased from RI% = 19.25% to RII% = 45.59%, and the adsorption capacity increased from qeI = 5.70 to qeII = 13.49 mg g−1.
As all experiment conditions were kept the same for all adsorption experiments, only the surface properties are responsible for the adsorption enhancement.
The tendency of adsorption capacities and yields on the four magnetite NP surfaces is the same in the first process of MG adsorption and in the second process of MG adsorption under thermocatalysis. In the first process of MG adsorption, the highest adsorption capacity was on ARM-Fe3O4 NPs, then on ROS-Fe3O4 NPs, next on MAT-Fe3O4 NPs, and finally on JUN-Fe3O4 NPs. After the exposure of MG/Fe3O4 systems to heat at 303.15 K for 20 minutes, the order of the adsorption capacities was the same, where the highest adsorption capacity was on ARM-Fe3O4, then on ROS-Fe3O4 NPs, next on MAT-Fe3O4 NPs, and finally on JUN-Fe3O4 NP surfaces. When further exposing the MG/Fe3O4 systems to heat at different temperatures of 308.15, 313.15, and 318.15 K for 20 minutes, the adsorption capacities of all four magnetite samples still increased in the same order. As shown in Fig. 12b, it is clear that there is a unique difference in the adsorption capacities after thermocatalysis, denoted as qTe (qTe = qeII−qeI represents the enhancement in the adsorption capacity by thermocatalysis calculated as the difference between qeI, the adsorption capacity in the first process of MG adsorption, and qeII, the overall adsorption capacity after carrying out thermocatalysis at 318.15 K for 20 minutes). Fig. 12b presents qTe for the four MG/Fe3O4 systems. These adsorption capacities are useful to elucidate the enhancement in MG adsorption by thermocatalysis. They show that qTe is the highest on JUN-Fe3O4 (7.79 mg g−1) and the lowest on ARM-Fe3O4 (3.17 mg g−1). This indicates that the thermocatalytic activity of the JUN-Fe3O4 NPs is the highest and that of ARM-Fe3O4 is the lowest. As all experimental conditions were kept the same for all adsorption experiments on all four magnetite samples, only the magnetite surfaces’ properties are responsible for the adsorption enhancement by the thermocatalysis process.
From Fig. 12b and Table 7, it can be seen that the increase in qTe is accompanied by an increase in ΔS0 in all the MG-Fe3O4 systems (detailed in Section 3.5.4). This confirms that the increase in qTe has resulted from the change in the surface structure.60 Thus, the maximum changes occurred in the structural surface of the JUN-Fe3O4 NPs, and the minimum changes occurred in the structural surface of the ARM-Fe3O4 NPs.
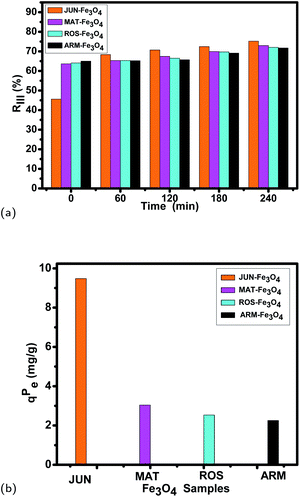
The variation of the MG adsorption yields, as well as the adsorption capacities under photocatalysis, is illustrated in Table 8 and Fig. 13a. They show that the MG adsorption capacities and yields on the four magnetite surfaces are enhanced by photocatalysis, however with remarkably different differences. Table 8 and Fig. 13a show remarkable differences when comparing the adsorption results on the four magnetite samples before carrying out photocatalysis and after 240 minutes of exposure to UV irradiation in ambient conditions, where the MG adsorption yield and adsorption capacity vary as follows (the yield after carrying out photocatalysis is denoted as RIII% and the adsorption capacity as qeIII):
• On ARM-Fe3O4, the yield increased from RII% = 65.01% to RIII% = 71.71%, and the adsorption capacity increased from qeII = 18.98 to qeIII = 21.23 mg g−1.
• On ROS-Fe3O4, the yield increased from RII% = 64.09% to RIII% = 72.07%, and the adsorption capacity increased from qeII = 18.80 to qeIII = 21.33 mg g−1.
• On MAT-Fe3O4, the yield increased from RII% = 63.60% to RIII% = 72.97%, and the adsorption capacity increased from qeII = 18.56 to qeIII = 21.60 mg g−1.
• On JUN-Fe3O4, the yield increased from RII% = 45.59% to RIII% = 75.23%, and the adsorption capacity increased from qeII = 13.49 to qeIII = 22.27 mg g−1.
| Sample | 0 min | 60 min | 120 min | 180 min | 240 min | |||||
|---|---|---|---|---|---|---|---|---|---|---|
| qeII(mg g−1) | RII% | qeIII (mg g−1) | RIII% | qeIII (mg g−1) | RIII% | qeIII (mg g−1) | RIII% | qeIII (mg g−1) | RIII% | |
| MG/ARM-Fe3O4 | 18.98 | 65.01 | 19.31 | 65.23 | 19.44 | 65.68 | 20.45 | 69.10 | 21.23 | 71.71 |
| MG/ROS-Fe3O4 | 18.80 | 64.09 | 19.33 | 65.32 | 19.68 | 66.49 | 20.64 | 69.73 | 21.33 | 72.07 |
| MG/MAT-Fe3O4 | 18.56 | 63.60 | 19.34 | 65.32 | 19.97 | 67.48 | 20.69 | 69.91 | 21.60 | 72.98 |
| MG/JUN-Fe3O4 | 13.49 | 45.52 | 20.24 | 68.38 | 20.93 | 70.72 | 21.44 | 72.44 | 22.97 | 75.23 |
In the first process of MG adsorption, the highest adsorption capacity was on the ARM-Fe3O4 NPs, then on ROS-Fe3O4 NPs, next on MAT-Fe3O4 NPs, and finally on JUN-Fe3O4 NPs. Whereas after the exposure of the MG/Fe3O4 systems to UV irradiation for 60 minutes, the order of the adsorption capacities was inverted, where the highest adsorption capacity was on the JUN-Fe3O4 NPs, then on MAT-Fe3O4 NPs, next on ROS-Fe3O4 NPs, and finally on ARM-Fe3O4 NPs. When further exposing the MG/Fe3O4 systems to UV irradiation for 120, 180, and 240 minutes, the adsorption capacities of all four magnetite samples still increased in the same order.
As shown in Fig. 13b, it is evident that there is a clear difference between the adsorption capacities under photocatalysis, denoted as qPe (qPe = qeIII − qeII represents the enhancement in adsorption by photocatalysis, it is calculated from the difference between the overall adsorption capacity qeIII in the third process of the adsorption after carrying out photocatalysis for 240 minutes, and the adsorption capacity qeII in the second process of MG adsorption after carrying out thermocatalysis at 318.15 K for 20 minutes) for the four MG/Fe3O4 systems. These qPe are useful to elucidate the MG adsorption enhancement by photocatalysis. They show that the highest one is that of JUN-Fe3O4 (9.48 mg g−1) and the lowest one is that of ARM-Fe3O4 (2.27 mg g−1). This indicates that the photocatalytic activity of JUN-Fe3O4 is the highest and that of ARM-Fe3O4 is the lowest. As all experimental conditions were kept the same for all adsorption experiments on all four magnetite samples, only the magnetite surfaces’ properties are responsible for the adsorption enhancement by the photocatalysis process.
3.7 Influence of the mediating plant extract’s acidity on the preferential and enhanced MG adsorption on magnetite surfaces
The results from the analysis of MG adsorption in ambient dark conditions showed that MG was differently adsorbed on the four magnetite surfaces (see Table 6). When comparing the OH group densities on the magnetite surfaces (according to the FTIR spectra analyzed in Section 3.2), it was found that MG adsorption is more preferred on magnetite surfaces that have more OH groups. The adsorption yield was the highest on the ARM-Fe3O4 surface, next on ROS-Fe3O4, then on MAT-Fe3O4, and finally on JUN-Fe3O4 and their mediating plant extracts have, respectively, acidic pH values of 5.25, 5.05, 4.63, and 3.69. Therefore, one can conclude that the plant extract pH has a clear effect on the OH group density on the magnetite surfaces and, consequently, on the preferential adsorption of MG. Thus, the decrease in the mediating plant extract’s acidity led to the increase in MG adsorption on the greenly synthesized magnetite NPS.Furthermore, the results found showed that the particle sizes of the magnetite samples vary with the variation of the plant extract mediating their green synthesis. The average grain size of the JUN-Fe3O4, MAT-Fe3O4, ROS-Fe3O4, and ARM-Fe3O4 NPs, calculated using Scherrer’s equation (eqn (22)), are, respectively, 29.27, 33.13, 39.89 and 41.49 nm, and their mediating extracts’ acidic pH were, respectively, 3.69, 4.63, 5.05, and 5.25. Therefore, the particle size decreases with the increase of the plant extract’s acidity. This result is in agreement with that found by Makarov et al.63 Moreover, the band gap energies of the JUN-Fe3O4, MAT-Fe3O4, ROS-Fe3O4, and ARM-Fe3O4 NPs are, respectively, 2.97, 2.95, 2.94, and 2.87. The smaller crystallite size of Fe3O4 is related to the higher band gap energy value as proof of the quantum size effect. So, the decrease of particle size leads to an increase in the band gap energy. This result is in agreement with that reported by Singh et al.64 Therefore, one can conclude that the band gap energy increases with the increase of the plant extract’s acidity.
The photo- and thermocatalysis adsorption mechanisms are controlled by the photo- and thermogenerated electron/hole pairs, which exhibit a strong tendency to recombine. The lifetime of the electron/hole pairs influences the photo- and thermocatalytic efficiency.15,65,66 The results found showed that the thermo- and photocatalytic activities of the magnetite NPs samples differ according to the mediating plant extract’s acidity. qPe and qTe are the highest on JUN-Fe3O4, next on MAT-Fe3O4, then on ROS-Fe3O4, and finally on the ARM-Fe3O4 NPs. This indicates that the recombination lifetime of the electron/hole pairs was more decreased on the JUN-Fe3O4 surface, next on MAT-Fe3O4, then on ROS-Fe3O4, and finally on the ARM-Fe3O4 NPs. Seeing that the increase in the direct band gap energy further slows the electron/hole pair recombination,16 and the band gap energy increases with the increase of the plant extract’s acidity, thus one can pronounce that the plant extract has an effect on the recombination lifetime of the electron/hole pairs, where the recombination of the electron/hole pairs is further slowed by the increase of the plant extract’s acidity. Thus, the thermo- and photocatalysis enhance the MG adsorption yields and capacities more on magnetite surfaces that are greenly synthesized from more acidic mediating plant extracts. Magnetite NPs greenly synthesized from more acidic mediating plant extracts showed higher thermo- and photocatalytic activities for MG adsorption.
4 Conclusion
The preferential and enhanced MG adsorption by thermo- and photocatalysis on four greenly synthesized magnetite surfaces has been studied by coupling three processes. In the first process, MG adsorption on magnetite surfaces was conducted in ambient dark conditions, whereas in the second and third processes, the enhancement by thermo- and photocatalysis were measured in dark conditions and under UV irradiation (365 nm) in ambient conditions, respectively. All four greenly synthesized magnetite samples were characterized by XRD, SEM, ATR-FTIR, and UV-Vis.The results found showed that:
• The decrease in the plant extract’s acidity leads to the increase of the active site density and, hence, an increase in the MG adsorption yield and capacity.
• The mediating plant extract’s acidity clearly affects the adsorption enhancement by thermo- and photocatalysis through its effect on the band gap energy of the greenly synthesized magnetite and, consequently, on the recombination lifetime of the electron/hole pairs after electron excitation.
• The band gap energy increases with the increase of the plant extract’s acidity, and the recombination speed of the electron/hole pairs is further decreased by the increase of the plant extract’s acidity.
Therefore, the thermo- and photocatalysis processes enhance the MG adsorption yield and capacity more on magnetite surfaces that are greenly synthesized from more acidic mediating plant extracts.
Author contributions
Kaouthar Ahmouda: writing – original draft, resources, investigation, visualization, and methodology. Boubakeur Benhaoua: supervision and visualization.Conflicts of interest
There are no conflicts to declare.Notes and references
- M. Amin, A. Alazba and U. Manzoor, Adv. Mater. Sci. Eng., 2014, 2014, 825910 CrossRef.
- M. M. Khin, A. S. Nair, V. J. Babu, R. Murugan and S. Ramakrishna, Energy Environ. Sci., 2012, 5, 8075–8109 RSC.
- A. M. Elgarahy, K. Z. Elwakeel, A. Akhdhar and M. F. Hamza, Nanotechnol. Environ. Eng., 2021, 6, 9 CrossRef CAS.
- A. A. Yaqoob, T. Parveen, K. Umar and M. N. Mohamad Ibrahim, Water, 2020, 12, 495 CrossRef CAS.
- B. Saha, S. Das, J. Saikia and G. Das, J. Phys. Chem. C, 2011, 115, 8024–8033 CrossRef CAS.
- S. Pirillo, M. L. Ferreira and E. H. Rueda, Ind. Eng. Chem. Res., 2007, 46, 8255–8263 CrossRef CAS.
- S. Pirillo, L. Cornaglia, M. L. Ferreira and E. H. Rueda, Spectrochim. Acta, Part A, 2008, 71, 636–643 CrossRef PubMed.
- I. Anastopoulos, A. Hosseini-Bandegharaei, J. Fu, A. C. Mitropoulos and G. Z. Kyzas, J. Dispersion Sci. Technol., 2018, 39, 836–847 CrossRef CAS.
- N. Tara, S. I. Siddiqui, G. Rathi, S. A. Chaudhry and A. M. Asiri, et al., Curr. Anal. Chem., 2020, 16, 14–40 CrossRef CAS.
- M. Mohapatra and S. Anand, Int. J. Eng. Sci. Res. Technol., 2010, 2, 127–146 Search PubMed.
- R. Cornell and U. Schwertmann, The iron oxides: structure, properties, reactions, occurrences, and uses, Wiley-VCH, Weinheim, 2003 Search PubMed.
- S. Pirillo, M. L. Ferreira and E. H. Rueda, J. Hazard. Mater., 2009, 168, 168–178 CrossRef CAS PubMed.
- U. G. Akpan and B. H. Hameed, J. Hazard. Mater., 2009, 170, 520–529 CrossRef CAS PubMed.
- X. Luo, S. Zhang and X. Lin, J. Hazard. Mater., 2013, 260, 112–121 CrossRef CAS PubMed.
- S. Ahmed, M. Rasul, R. Brown and M. Hashib, J. Environ. Manage., 2011, 92, 311–330 CrossRef CAS PubMed.
- J. He, M. Guo and R. Long, J. Phys. Chem. Lett., 2018, 9, 3021–3028 CrossRef CAS PubMed.
- R. Wu, J.-H. Liu, L. Zhao, X. Zhang, J. Xie, B. Yu, X. Ma, S.-T. Yang, H. Wang and Y. Liu, J. Environ. Chem. Eng., 2014, 2, 907–913 CrossRef CAS.
- J. Fan, W. Cai and J. Yu, Chem. - Asian J., 2011, 6, 2481–2490 CrossRef CAS PubMed.
- A. Farghali, M. Bahgat, W. El Rouby and M. Khedr, J. Solution Chem., 2012, 41, 2209–2225 CrossRef CAS.
- Y.-L. Ge, Y.-F. Zhang, Y. Yang, S. Xie, Y. Liu, T. Maruyama, Z.-Y. Deng and X. Zhao, Appl. Surf. Sci., 2019, 488, 813–826 CrossRef CAS.
- M. Elhadj, A. Samira, T. Mohamed, F. Djawad, A. Asma and N. Djamel, Sep. Sci. Technol., 2020, 55, 867–885 CrossRef CAS.
- B. Kumar, K. Smita, L. Cumbal, A. Debut, S. Galeas and V. H. Guerrero, Mater. Chem. Phys., 2016, 179, 310–315 CrossRef CAS.
- K. D. Sirdeshpande, A. Sridhar, K. M. Cholkar and R. Selvaraj, Appl. Nanosci., 2018, 8, 675–683 CrossRef CAS.
- T. Kusova, I. Yamanovskaya, N. Kopeikina, A. Kraev and A. Agafonov, Inorg. Mater.: Appl. Res., 2021, 12, 570–575 CrossRef.
- V. Jassal, U. Shanker and S. Gahlot, Mater. Today: Proc., 2016, 3, 1874–1882 Search PubMed.
- F. Mai, C. Chen, J. Chen and S. Liu, J. Chromatogr. A, 2008, 1189, 355–365 CrossRef CAS PubMed.
- A. Kumar and G. Pandey, Mater. Sci. Eng. Int., 2017, 1, 1–10 Search PubMed.
- A. Masudi, G. E. Harimisa, N. A. Ghafar and N. W. C. Jusoh, Environ. Sci. Pollut. Res., 2020, 27, 4664–4682 CrossRef CAS PubMed.
- A. Khataee and M. B. Kasiri, J. Mol. Catal. A: Chem., 2010, 328, 8–26 CrossRef CAS.
- M. Fathinia, A. Khataee, M. Zarei and S. Aber, J. Mol. Catal. A: Chem., 2010, 333, 73–84 CrossRef CAS.
- N. Xu, Z. Shi, Y. Fan, J. Dong, J. Shi and M. Z.-C. Hu, Ind. Eng. Chem. Res., 1999, 38, 373–379 CrossRef CAS.
- R. Ullah and J. Dutta, J. Hazard. Mater., 2008, 156, 194–200 CrossRef CAS PubMed.
- H. Rafaie, R. Nor, M. Azmina, N. Ramli and R. Mohamed, J. Environ. Chem. Eng., 2017, 5, 3963–3972 CrossRef CAS.
- B. Mounir, M.-N. Pons, O. Zahraa, A. Yaacoubi and A. Benhammou, J. Hazard. Mater., 2007, 148, 513–520 CrossRef CAS PubMed.
- X. Cai, B. Han, S. Deng, Y. Wang, C. Dong, Y. Wang and I. Djerdj, CrystEngComm, 2014, 16, 7761–7770 RSC.
- C. Xiao, H. Li, Y. Zhao, X. Zhang and X. Wang, J. Environ. Manage., 2020, 275, 111262 CrossRef CAS PubMed.
- T. Madrakian, A. Afkhami and M. Ahmadi, Spectrochim. Acta, Part A, 2012, 99, 102–109 CrossRef CAS PubMed.
- C.-H. Weng, Y.-T. Lin, C.-L. Yeh and Y. Sharma, Water Sci. Technol., 2010, 62, 844–851 CrossRef CAS PubMed.
- K. W. Borth, C. W. Galdino, V. de Carvalho Teixeira and F. J. Anaissi, Appl. Surf. Sci., 2021, 546, 149126 CrossRef CAS.
- H. Hongping, Y. Zhong, X. Liang, T. Wei, Z. Jianxi and C. Y. Wang, Sci. Rep., 2015, 5, 1–10 Search PubMed.
- L. Huang, X. Weng, Z. Chen, M. Megharaj and R. Naidu, Spectrochim. Acta, Part A, 2014, 130, 295–301 CrossRef CAS PubMed.
- D. T. C. Nguyen, H. H. Dang, D.-V. N. Vo, L. G. Bach, T. D. Nguyen and T. Van Tran, J. Hazard. Mater., 2021, 404, 124146 CrossRef CAS PubMed.
- T. Islam, C. Peng, I. Ali and I. A. Abbasi, 2018.
- S. K. Lagergren, Sven. Vetenskapsakad. Handingarl., 1898, 24, 1–39 Search PubMed.
- Y.-S. Ho and G. McKay, Process Biochem., 1999, 34, 451–465 CrossRef CAS.
- H. Yuh-Shan, Scientometrics, 2004, 59, 171–177 CrossRef.
- Y.-S. Ho, J. Hazard. Mater., 2006, 136, 681–689 CrossRef CAS PubMed.
- M. A. Salam, Int. J. Environ. Sci. Technol., 2013, 10, 677–688 CrossRef.
- S. M. Ponder, J. G. Darab and T. E. Mallouk, Environ. Sci. Technol., 2000, 34, 2564–2569 CrossRef CAS.
- G. Boyd, A. Adamson and L. Myers Jr, J. Am. Chem. Soc., 1947, 69, 2836–2848 CrossRef CAS PubMed.
- C. Valderrama, X. Gamisans, X. De las Heras, A. Farran and J. Cortina, J. Hazard. Mater., 2008, 157, 386–396 CrossRef CAS PubMed.
- L. Yu and Y.-M. Luo, J. Environ. Chem. Eng., 2014, 2, 220–229 CrossRef CAS.
- U. Holzwarth and N. Gibson, Nat. Nanotechnol., 2011, 6, 534 CrossRef CAS PubMed.
- C. Prasad, S. Karlapudi, P. Venkateswarlu, I. Bahadur and S. Kumar, J. Mol. Liq., 2017, 240, 322–328 CrossRef CAS.
- R. A. Smith, Semiconductors, 1978 Search PubMed.
- H. El Ghandoor, H. Zidan, M. M. Khalil and M. Ismail, Int. J. Electrochem. Sci., 2012, 7, 5734–5745 CAS.
- W. Strehlow and E. L. Cook, J. Phys. Chem. Ref. Data, 1973, 2, 163–200 CrossRef CAS.
- D. L. Michelsen, J. A. Gideon, G. P. Griffith, J. E. Pace and H. L. Kutat, 1975.
- M. Alkan, Ö. Demirbaş and M. Doğan, MicroporousMesoporous Mater., 2007, 101, 388–396 CrossRef CAS.
- Z. Aksu, A. İ. Tatlı and Ö. Tunç, Chem. Eng. J., 2008, 142, 23–39 CrossRef CAS.
- M. Doğan, H. Abak and M. Alkan, J. Hazard. Mater., 2009, 164, 172–181 CrossRef PubMed.
- J. A. Davis and J. O. Leckie, J. Colloid Interface Sci., 1980, 74, 32–43 CrossRef CAS.
- V. V. Makarov, S. S. Makarova, A. J. Love, O. V. Sinitsyna, A. O. Dudnik, I. V. Yaminsky, M. E. Taliansky and N. O. Kalinina, Langmuir, 2014, 30, 5982–5988 CrossRef CAS PubMed.
- M. Singh, M. Goyal and K. Devlal, J. Taibah Univ. Sci., 2018, 12, 470–475 CrossRef.
- I. K. Konstantinou and T. A. Albanis, Appl. Catal., B, 2004, 49, 1–14 CrossRef CAS.
- M. Rauf, M. Meetani and S. Hisaindee, Desalination, 2011, 276, 13–27 CrossRef CAS.
- K. Ahmouda, B. Benhaoua, S. L. Laouini and A. Labbi, Sustainable Chemistry and Pharmacy, 2022, 25 DOI:10.1016/j.scp.2021.100563.
| This journal is © The Royal Society of Chemistry 2022 |

