 Open Access Article
Investigation of the soft carbon microstructure in silicon/carbon anodes for superior lithium storage†
Juntao Du *a,
Jiangkai Maab,
Zetao Liuac,
Wenchao Wangac,
Huina Jiaa,
Minxin Zhanga and
Yi Nie
 *ad
*ad
aZhengzhou Institute of Emerging Industrial Technology, Zhengzhou, 450000, China. E-mail: jtdu@ipezz.ac.cn
bZhengzhou University, Zhengzhou 450000, China
cDalian University of Technology, Dalian, 116024, China
dInstitute of Process Engineering, Chinese Academy of Sciences, Beijing 100190, China. E-mail: ynie@ipe.ac.cn
First published on 19th July 2022
Abstract
It is essential to consider the controllable microstructure of soft carbon and its enhancement effect on the electrochemical performance of silicon (Si) active materials. In this study, a series of Si@mesocarbon microbead (Si@MCMB) composites were prepared using mesophase pitch as the soft carbon source to coat nano-Si. The results showed that the ordered carbon layer stacking of soft carbon increased slightly with increasing heat treatment temperature in the range of 800–1400 °C. The Si@MCMB composites at higher temperature had a turbostratic carbon layer texture with rich porosity and smaller specific surface area, and had good cycle stability and high rate performance. These results highlighted that the co-existing structure of turbostratic carbon arrays with abundant porosity from soft carbon, provided the electron/ion transfer channels, underwent Si alloy volume change and enhanced the mechanical stability. Importantly, the relationship between the capacity retention rate of the Si@MCMB anodes and the microstructural characteristics (carbon layer and porosity) of soft carbon was established, which provided effective guidance for the design of high-performance silicon/carbon (Si/C) anode materials.
1. Introduction
Lithium-ion batteries (LIBs) are one of the development directions of new energy technologies. Si/C composites represent some of the most promising anode materials to break through the application bottleneck of high specific energy LIBs.1 The properties of active Si particles have higher requirements of carbon composition, so the design of carbon structures has become a research hotspot in the area of Si/C anode materials.2,3 Soft carbon contains controllable disorder and graphitic regions, endowing a high storage capacity and good cycling stability, and is one of the most promising carbon materials used in Si/C anodes.4 The main technical problem is that it is difficult to control the microstructure of soft carbon and its influence on the electrochemical behavior of active Si particles is not clear.5,6 Although challenging, it is vital to understand how the controllable microstructure of soft carbon efficiently improves the electrochemical performance of Si/C composite anodes.Mesophase pitch as soft carbon contains ordered graphite regions with controllable crystallinity, which imparts excellent electron transfer properties and structural elasticity to improve electrochemical performance.7,8 Firstly, the streamlined carbon arrays of mesophase pitch after carbonization have moderately expanded layer spacing, enabling them to have better rate performance than hard carbons and conventional graphite anodes.9,10 Additionally, compared with hard carbon, the pores and defects of mesophase pitch can be easily adjusted by the heat treatment temperature to achieve a reasonable compromise between ion diffusion and electrolyte compatibility. Its relatively dense structure tends to result in higher vibration density and volumetric energy density.11,12 In particular, the microstructure of mesophase pitch is greatly affected by the heat treatment temperature, which is a potential method for optimizing the electrochemical performance of active Si and needs to be further explored.13 However, a clear correlation between the order degree of mesophase pitch as soft carbon and the corresponding lithium storage at a carbonization temperature of 1000–1400 °C is still elusive, and the enhancement effect of microstructure on the electrochemical behavior of active Si is not clear.
Here, we synthesized a series of Si/C composites with a regularly adjusted microstructure through the gradual carbonization of mesophase pitch as soft carbon from 800 to 1400 °C. The lithium storage behavior and related structural stability of soft carbon and the enhancement effect of its microstructure on the electrochemical behavior of active Si were studied using the prepared materials. Based on our previous report,14 this study further focused on the design of the turbostratic carbon layer arrays and pore structure of soft carbon by finely adjusting the heat treatment temperature. The correlation between the microstructural characteristics of soft carbon and the electrochemical behavior of Si/C composites was systematically explored.
2. Experimental
2.1 Synthesis of Si@MCMB
The coal-based mesophase pitch (CMP) was prepared from coal tar pitch in our laboratory and its properties are listed in Tables S1 and S2.† Nano-Si particles with an average diameter of 100 nm were purchased from Gexin Nano Technology Co., Ltd, Shanghai, China. The CMP and nano-Si (100 nm) in a mass ratio of 100![[thin space (1/6-em)]](https://www.rsc.org/images/entities/char_2009.gif) :
:![[thin space (1/6-em)]](https://www.rsc.org/images/entities/char_2009.gif) 15 to obtain a Si/CMP composite in a tube furnace at 400 °C for 2 h. Si/CMP mixture and silicone oil in a mass ratio of 1
15 to obtain a Si/CMP composite in a tube furnace at 400 °C for 2 h. Si/CMP mixture and silicone oil in a mass ratio of 1![[thin space (1/6-em)]](https://www.rsc.org/images/entities/char_2009.gif) :
:![[thin space (1/6-em)]](https://www.rsc.org/images/entities/char_2009.gif) 100 were sealed off in a stainless-steel reactor at 300 °C for 1 h and the reactor was then rapidly cooled to room temperature. The Si@MCMB composites was separated by centrifugation, washed with petroleum ether until colorless and then dried at 80 °C in a vacuum for 12 h. Finally, the Si@MCMB composites were obtained by pre-oxidation at 300 °C in air for 1 h and carbonized from 800 to 1400 °C for 2 h in an argon atmosphere before being labeled as Si@MCMB-8, Si@MCMB-10, Si@MCMB-12, Si@MCMB-13 and Si@MCMB-14, respectively. Similarly, the MCMB samples with different heat treatment temperatures from 800 to 1400 °C were labeled as MCMB-8, MCMB-10, MCMB-12, MCMB-13 and MCMB-14, respectively.
100 were sealed off in a stainless-steel reactor at 300 °C for 1 h and the reactor was then rapidly cooled to room temperature. The Si@MCMB composites was separated by centrifugation, washed with petroleum ether until colorless and then dried at 80 °C in a vacuum for 12 h. Finally, the Si@MCMB composites were obtained by pre-oxidation at 300 °C in air for 1 h and carbonized from 800 to 1400 °C for 2 h in an argon atmosphere before being labeled as Si@MCMB-8, Si@MCMB-10, Si@MCMB-12, Si@MCMB-13 and Si@MCMB-14, respectively. Similarly, the MCMB samples with different heat treatment temperatures from 800 to 1400 °C were labeled as MCMB-8, MCMB-10, MCMB-12, MCMB-13 and MCMB-14, respectively.
2.2 Materials characterization
The morphology of the samples was observed by scanning electron microscopy (SEM). Carbonized samples were embedded in a thermosetting resin, which was then cut with a sharp scalpel after curing, allowing for observation of the internal structure of the samples through their cross section by SEM and energy-dispersive X-ray spectroscopy (EDS). The crystal structures of the samples were examined using X-ray diffraction (XRD) with Cu-Kα radiation. The graphitization degrees of the different samples were analyzed using a LabRAM HR Raman spectrometer. The Si content in samples was obtained by thermogravimetric analysis (TGA) operated from 30 to 900 °C at a heating rate of 10 °C min−1 under an air atmosphere. The specific surface area was determined according to the Brunauer–Emmett–Teller (BET) method and the pore size distribution was derived from the Barrett–Joyner–Halenda model using an ASAP2020HD88 apparatus (USA).2.3 Electrochemical performance evaluation
The electrochemical performance of the Si@MCMB composites was evaluated using coin-type half cells, with lithium foil as a counter electrode. The anode materials were fabricated by mixing the active materials, acetylene black and poly(vinylidene fluoride) in a mass ratio of 8![[thin space (1/6-em)]](https://www.rsc.org/images/entities/char_2009.gif) :
:![[thin space (1/6-em)]](https://www.rsc.org/images/entities/char_2009.gif) 1
1![[thin space (1/6-em)]](https://www.rsc.org/images/entities/char_2009.gif) :
:![[thin space (1/6-em)]](https://www.rsc.org/images/entities/char_2009.gif) 1 by ball milling at 150 rpm for 2 h. Then, the copper foil after coating was dried at 100 °C for 12 h under a vacuum, and punched into a circular electrode with a diameter of 14 mm as the working electrode. A polypropylene film (Celgard 2400) was utilized as the separator, and a solution of LiPF6 (1.0 mol L−1) in dimethyl carbonate and ethylene carbonate (mass ratio 1
1 by ball milling at 150 rpm for 2 h. Then, the copper foil after coating was dried at 100 °C for 12 h under a vacuum, and punched into a circular electrode with a diameter of 14 mm as the working electrode. A polypropylene film (Celgard 2400) was utilized as the separator, and a solution of LiPF6 (1.0 mol L−1) in dimethyl carbonate and ethylene carbonate (mass ratio 1![[thin space (1/6-em)]](https://www.rsc.org/images/entities/char_2009.gif) :
:![[thin space (1/6-em)]](https://www.rsc.org/images/entities/char_2009.gif) 1) was treated as electrolyte. A LAND battery testing system was used to measure the cycling and rate performance of the anodes. Cyclic voltammetry (CV) was carried out using an electrochemical workstation (CHI660E, CH Instruments, China) at a scan rate of 0.1 mV s−1 from 0.01 to 3.0 V. Electrochemical impedance spectroscopy (EIS) was conducted in a frequency range from 100 kHz to 0.01 Hz.
1) was treated as electrolyte. A LAND battery testing system was used to measure the cycling and rate performance of the anodes. Cyclic voltammetry (CV) was carried out using an electrochemical workstation (CHI660E, CH Instruments, China) at a scan rate of 0.1 mV s−1 from 0.01 to 3.0 V. Electrochemical impedance spectroscopy (EIS) was conducted in a frequency range from 100 kHz to 0.01 Hz.
3. Results and discussion
3.1 Structural characteristics
The morphology and cross section of the Si@MCMB composites were identified by SEM (Fig. 1 and S1†). The Si@MCMB composite particles were uniform in size and uniformly dispersed, as shown in Fig. S1.† Fig. 1 shows that the Si@MCMB composites exhibited a near-spherical structure with a diameter of 30–40 μm and the nano-Si particles were well embedded in the cross section of the Si@MCMB composites. Furthermore, the elemental mapping images in Fig. S2† also suggested that the nano-Si particles were well encapsulated in MCMB. With increasing heat treatment temperature, the cross sections of Si@MCMB gradually showed different degrees of laminar cracking and shrinkage, which may be due to the volatilization of the light components of MCMB or the polymerization and rearrangement of the carbon layers.15 Mesophase pitch forms a curved carbon layer stacked structure under high-temperature carbonization and the external nano-Si particles may cause distortion and gap in the carbon layer texture.16–18 Moreover, the Si@MCMB composites showed an ordered carbon layer texture and abundant void space, which may provide efficient transport channels for electrons and lithium ions and accommodate the volume change of Si.19,20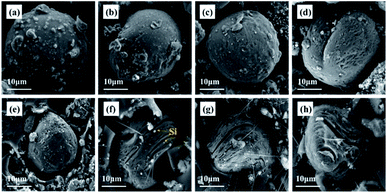 | ||
| Fig. 1 SEM images of morphology and cross sections: Si@MCMB-8 (a and e); Si@MCMB-10 (b and f); Si@MCMB-12 (c and g); Si@MCMB-13 (d and h). | ||
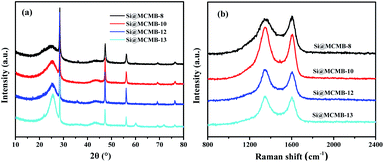
As shown in Fig. 2a, five distinct diffraction peaks at 28.5°, 47.2°, 56.2°, 69.2° and 76.3° could be observed, which are assigned to the (111), (220), (311), (400) and (331) planes of Si (JCPDS 27-1402), respectively. In addition, the weak peak at 25° could be attributed to the (002) plane of the carbon materials.21 It is noteworthy that the formation of major impurities such as SiC and SiO2 species in Si@MCMB-13 was mainly ascribed to the carbon and oxygen element of mesophase pitch (Fig. S4†). The inert SiC and SiO2 seriously affected the transfer of electron ions between the Si core and carbon shell, as confirmed in the subsequent electrochemical performance. As listed in Table 1, the carbon structure parameters could be calculated from XRD.22 The Si@MCMB composites showed a decrease in the interlayer spacing (dm) and an increase in the crystallite sizes (La and Lc) with the heat treatment temperature increasing from 800 to 1300 °C. The presence of a strong peak at 1350 cm−1 and a weak peak at 1605 cm−1 in Fig. 2b were recognized as the disorder D band and graphitic G band of the carbon materials, respectively. It is well-known that the intensity ratio (ID/IG) is used to reflect the order degree of carbon materials.23 The ID/IG values were calculated to be 1.156, 1.131, 1.086 and 1.067 for Si@MCMB-8, Si@ MCMB-10, Si@MCMB-12 and Si@MCMB-13, respectively, as listed in Table 1. It can be found that the carbon layer order degree of the latter two was obviously better than for the former two.
| Si@MCMB-X | 8 | 10 | 12 | 13 |
|---|---|---|---|---|
| Interlayer spacing dm/nm | 0.3551 | 0.3486 | 0.3472 | 0.3455 |
| Crystallite sizes La/nm | 7.93 | 8.35 | 9.63 | 13.59 |
| Stacking height Lc/nm | 3.53 | 4.90 | 5.04 | 7.67 |
| Disordered degree ID/IG | 1.156 | 1.131 | 1.086 | 1.067 |
| SBET/m2 g−1 | 31.069 | 20.419 | 9.884 | 8.454 |
| Pore volume/cm3 g−1 | 0.015 | 0.018 | 0.023 | 0.038 |
The Si contents in Si@MCMB composites were measured by TGA, as shown in Fig. S3.†24 The Si contents in Si@MCMB-8, Si@MCMB-10, Si@MCMB-12 and Si@MCMB-13 were estimated as 15.8 wt%, 16.1 wt%, 16.4 wt% and 16.8 wt%, respectively. In contrast, the weight loss of Si@MCMB-8 and Si@MCMB-10 started at 500 °C and that of Si@MCMB-12 and Si@MCMB-13 started at 650 °C, which also indicated the escape of the light components in the latter two by carbonization at the higher temperature.
The N2 adsorption–desorption isotherm and pore-size distribution curves of the Si@MCMB composites are shown in Fig. 3. Interestingly, with the heat treatment temperature increasing from 800 to 1300 °C, the BET specific surface area showed a decreasing trend while the total pore volume showed an increasing trend, as presented in Table 1. This phenomenon may be caused by the different number of pores in the Si@MCMB composites in the mesoporous and macroporous areas, respectively. Compared to the values of 31.069 m2 g−1 and 0.015 cm3 g−1 of Si@MCMB-8, the BET specific surface area (SBET) and pore volume of Si@MCMB-13 were 8.454 m2 g−1 and 0.038 cm3 g−1, respectively. Generally, when the heat treatment temperature was less than 1000 °C, the oxygen in the form of CO2 and CO and light components escaped to form part of the pores. Concomitantly, above 1000 °C, the H2 release and carbon layer rearrangement of the mesophase pitch form a turbostratic carbon layer structure and created pores.25,26 Notably, the changes in pore distribution and carbon texture affected the lithium storage process and channels, and the aromatic ring compound and heteroatoms affected the active point of lithium storage.11,27
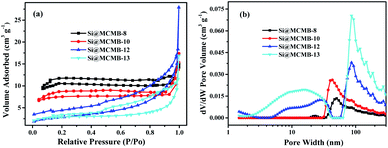 | ||
| Fig. 3 N2 adsorption–desorption isotherm (a) and pore-size distribution curves (b) of Si@MCMB composites. | ||
Furthermore, the structure parameter of carbon layers and hierarchical porosity about Si@MCMB composites was listed in Table 1. The reasonable design of the porosity in the carbon matrix is beneficial for improving the electrochemical performance of Si/C electrodes, which provided efficient active sites and electron/ion diffusion paths.28,29 This differential determination of the Si@MCMB composites may reflect their different electrochemical properties.
3.2 Electrochemical performance
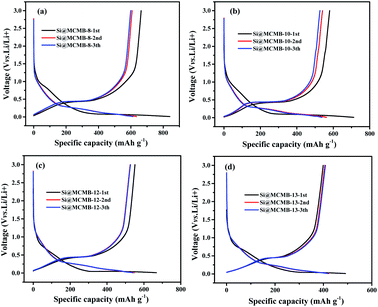
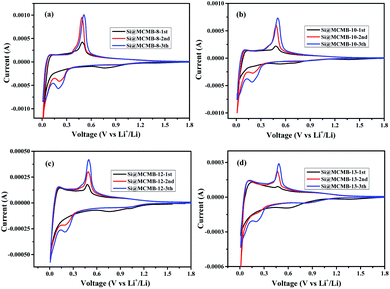
Fig. 4 show the charge/discharge curves for the Si@MCMB composites. In the initial cycle, the Si@MCMB anodes had discharge capacities of 841.5, 712.2, 674.7 and 495.7 mA h g−1 for Si@MCMB-8, Si@MCMB-10, Si@MCMB-12 and Si@ MCMB-13, accompanied by initial coulombic efficiencies (ICEs) of 78.92%, 81.47%, 82.04% and 83.67%, respectively. In the first discharge, the smooth inclined line between 1.2 and 0.2 V corresponded to the SEI formation and lithium insertion in the carbon layers.30 The flat plateau at ∼0.15 V in the discharge process was assigned to the LixSi alloying reaction. The long plateau at ∼0.4 V in the charge process originated from the Li-ion extraction.19,22 The irreversible capacity loss of the first two Si@MCMB anodes was mainly caused by the large specific surface area, aromatic heteroatoms and carbon layer structure, which caused the formation process of the SEI to consume too much lithium. In contrast, the last two Si@MCMB anodes had smaller surface areas, fewer aromatic heteroatoms and abundant pore channels and thus their first coulombic efficiency was slightly better.As shown in Fig. 5, the significant plateau of the Si@MCMB composites in the charging process at 0.3–0.5 V originated from the reversible LixSi delithiation process.31,32 There was an evident peak at ∼0.2 V in the discharge process, which was assigned to the LixSi alloying reaction. It was notable that the intensities of both the anodic and cathodic peaks gradually increased with further cycles, possibly due to the gradual activation process.29 In comparison, the two relatively weak oxidation peaks at ∼0.12 and 1.0 V could be attributed to Li-ion delithiation through stacked carbon layers, desorption from microvoids or structural defects in the carbon matrix, and reactions between Li ions and heteroatomic functional groups, respectively.33,34 Furthermore, the distinct enhancement peak near 0 V for each Si@MCMB composite was associated with the reversible intercalation of Li ions into the stacked carbon layers and the structural defects in the form of nanopores and heteroatomic functional groups.35 During the first cathode scanning process of each Si@MCMB composite, there was an irreversible reduction peak of the first cycles at 0.6–0.8 V, which was associated with the formation of an SEI on the electrode surface.22,36
As shown in Fig. 6a, the MCMB composites showed similar charge–discharge performance, which was consistent with the cycling performance (Fig. S5†). It was noted that the initial discharge capacity decreased gradually from MCMB-8 to MCMB-13 (Table S3†) and this was attributed to the change in the carbon layer stacked microstructure caused by the heat treatment temperature. MCMB-8 anode, as a hydrogen-containing disordered soft carbon, showed a larger initial specific capacity, but the subsequent irreversible capacity was presumably caused by the collapse of the carbon structure and the imperfect structure of the pores.37 Furthermore, the Si@MCMB composites showed significant differences in irreversible capacity, with Si@MCMB-12 and Si@MCMB-13 showing relatively small losses (Table 2). This may be explained by the fact that the Si@MCMB-8 and Si@MCMB-10 composites had relatively larger specific surface areas, smaller pore volumes and a narrow pore distribution at ∼50 nm (Tables 1 and S3†), which may cause the generation of the SEI and microporous lithium storage to consume too much lithium, resulting in a large irreversible capacity. This was also verified by the CV curves (Fig. 5).
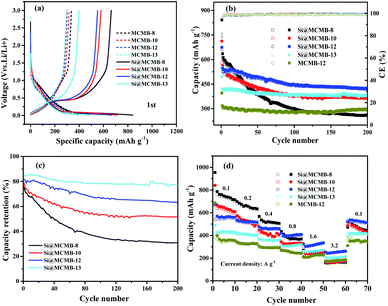 | ||
| Fig. 6 First charge/discharge curves (a), cycling performance at 0.2 A g−1 (b), capacity retention rate (c) and rate performance (d). | ||
| Si@MCMB-X anodes | 8 | 10 | 12 | 13 |
|---|---|---|---|---|
| Reversible capacity/mA h g−1 | 664.1 | 580.2 | 553.5 | 414.7 |
| Irreversible capacity/mA h g−1 | 177.4 | 132 | 121.2 | 81.0 |
| ICE/% | 78.92 | 81.47 | 82.04 | 83.67 |
| Capacity after 200 cycles/mA h g−1 | 260.2 | 367 | 421.1 | 386.5 |
| Capacity retention rate/% | 39.18 | 63.25 | 76.08 | 93.20 |
As shown in Fig. 6b, the discharge capacity of the Si@MCMB-12 anode was up to 421.1 mA h g−1 after 200 cycles, which was higher than that of the Si@MCMB-8 anode (260.2 mA h g−1) and Si@MCMB-10 anode (367.0 mA h g−1) under the same conditions. The capacity retention rate of the Si@MCMB anodes from 800 to 1300 °C showed a different tendency in decrease after 200 cycles, exhibiting 39.18%, 63.25%, 76.08% and 93.20%, respectively (Fig. 6c and Table 2). Fig. 6d shows that the Si@MCMB-12 and Si@MCMB-13 anodes had better rate performance than Si@MCMB-8 and Si@MCMB-10, exhibiting high capacities at current densities of 0.2, 0.4, 0.8, 1.6 and 3.2 A g−1, respectively. Furthermore, Si@MCMB-12 and Si@MCMB-13 had relatively smaller specific surface areas, abundant carbon layers stacked and pore volume distribution, which provided better conditions for SEI generation and electron/ion channels.7,13 In addition, the abundant pore volume distribution was beneficial to buffer the volume change of the Si alloying process, ensuring the mechanical stability of the anodes. Therefore, the Si@MCMB-12 and Si@MCMB-13 anodes showed good cycling and rate properties, as listed in Tables 1 and 2.
The first CV curves and EIS plots of the Si@MCMB anodes are illustrated in Fig. 7. By comparing the first CV curves of the Si@MCMB anodes, it could be found that the cathodic and anodic peaks become weaker with the heat treatment temperature from 800 to 1300 °C, while the charge transfer resistance (Rct) was gradually increased in the EIS plots (Table S4†). This phenomenon was attributed to Si@MCMB-8 and Si@MCMB-10 having larger specific surface areas, pore-size distribution (∼50 nm) and high interlayer spacing with poor order degree structures, which were all conducive to the contact between the electrode surface and the electrolyte and even lithium-ion diffusion.38 In contrast, the larger impedance of the Si@MCMB-12 and Si@MCMB-13 anodes may be attributed to the close packing of the electrode materials, small specific surface areas and pore-size distribution (<30 and >60 nm, respectively). The relatively weak alloying process may be caused by the poor contact conductivity of the coated carbon parent and the contact points about the silicon–carbon interface decrease because of the increased disorder of the carbon layer.39,40 Therefore, it was noteworthy that Si@MCMB-12 and Si@MCMB-13 anodes still showed good cyclic stability and high rate performance, probably due to the enhancement effect of structural stability, pore distribution and carbon layer structure, which offset the negative factors of higher impedance and weaker alloying.
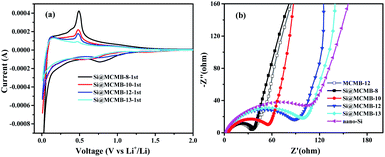 | ||
| Fig. 7 First CV curves of Si@MCMB anodes (a) and EIS plots of Si@MCMB, nano-Si and MCMB-12 anodes (b). | ||
The relationship between the electrochemical performance and structural characteristics for the Si@MCMB composites was further analyzed. SEM images revealed the morphological changes of the Si@MCMB anodes (mass loading 1.1 mg cm−2) after 200 cycles (Fig. 8). The apparent morphology of the Si@MCMB-12 and Si@MCMB-13 anodes had a smoother surface with fewer cracks in their electrode coating, indicating that the anode structures maybe still maintain relative integrity after 200 cycles.24,41 Significantly, the good structural integrity and stability was attributed to the turbostratic carbon layer structure and pore volume buffer space, which might facilitate the diffusion of electrolyte ions and alleviate the volume change of active Si particles during the lithium storage process.42
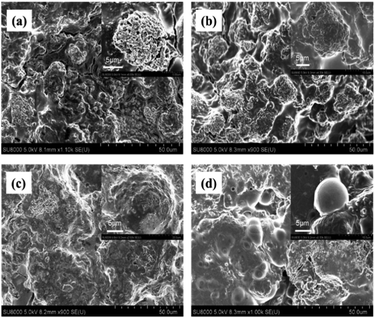 | ||
| Fig. 8 SEM images of Si@MCMB-8 (a), Si@MCMB-10 (b), Si@MCMB-12 (c) and Si@MCMB-13 (d) anodes after 200 cycles at 0.2 A g−1. | ||
Based on the above results, the improved cycling stability and excellent rate performance of the Si@MCMB-12 and Si@MCMB-13 anodes may be attributed to the turbostratic carbon layer texture and pore volume buffer space. After 200 cycles, the capacity retention rate of the Si@MCMB composite anodes had a positive correlation with porosity and carbon layer order degree, while the specific surface area was the opposite, as shown in Fig. 9. Firstly, the carbon layer spacing and void volume could well accommodate the volume charge of Si during charge and discharge. Secondly, the nano-Si particles were well embedded in the turbostratic carbon layer texture with good order degree, which form an efficient conductive network skeleton and ensure material integrity and stability. Finally, the relatively smaller specific surface area and abundant void volume improved together the stability of the SEI layer, thus exhibiting high first coulomb efficiency. The next step and focus of work would be to further improve the coating and embedding rate and the content of nano-Si, so as to optimize the cyclic stability and high specific capacity of the Si@MCMB anodes.
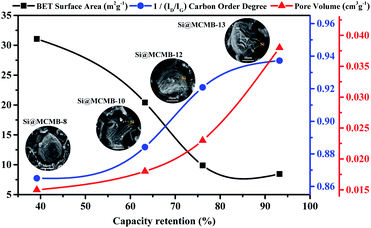 | ||
| Fig. 9 Correlation between capacity retention rate (at 0.2 A g−1) and structural parameters of Si@MCMB composites. | ||
4. Conclusion
In this study, a series of Si@MCMB composites were adjusted by heat treatment temperature in the range of 800–1400 °C using mesophase pitch as soft carbon source. The Si@MCMB composite anodes carbonized at a higher temperature had a turbostratic carbon layer texture with ordered carbon layer stacking, rich pore structure and smaller specific surface area, which showed a good capacity retention rate. These results suggested the co-existing structure of turbostratic carbon arrays with abundant porosity from mesophase pith, effectively improved the structural mechanical stability and the cycling and rate performance of electrodes. Importantly, the controlled strategy of adjusting the soft carbon microstructure by the heat treatment temperature may be applied to high rate Si/C anode materials.Author contributions
Juntao Du: conceptualization, methodology, data curation, writing – original draft, writing – review & editing. Jiangkai Ma: validation, data curation, writing – original draft, formal analysis. Zetao Liu: data curation, validation, investigation. Wenchao Wang: data curation, validation, investigation. Huina Jia: visualization, data curation, investigation. Minxin Zhang: investigation, supervision, funding acquisition. Yi Nie: supervision, project administration, funding acquisition, writing – review & editing.Conflicts of interest
The authors declare that they have no known competing financial interests or personal relationships that could have appeared to influence the work reported in this paper.Acknowledgements
This work was financially supported by the National Natural Science Foundation of China (Youth Science Foundation Program No. 21908206), the Grant. YLU-DNL Fund of China (No. 2021015), the Key Science and Technology Project of Henan Province, China (No. 202102210213) and the Scientific and Technological Achievements Transfer and Transformation Project of Chinese Academy of Sciences in Henan Province, China (No. 2021102).References
- Y. Qi, G. Wang, S. Li, T. Liu, J. Qiu and H. Li, Chem. Eng. J., 2020, 397, 125380 CrossRef CAS.
- X. Zhang, D. Kong, X. Li and L. Zhi, Adv. Funct. Mater., 2019, 29, 1806061 CrossRef.
- L. Wang, J. Han, D. Kong, Y. Tao and Q. Yang, Nano-Micro Lett., 2019, 11, 5 CrossRef CAS PubMed.
- F. Wang, Z. Hu, L. Mao and J. Mao, J. Power Sources, 2020, 450, 227692 CrossRef CAS.
- A. Bianco, Y. Chen, Y. Chen, D. Ghoshal, R. H. Hurt, Y. A. Kim, N. Koratkar, V. Meunier and M. Terrones, Carbon, 2018, 132, 785–801 CrossRef CAS.
- J. Guo, D. Dong, J. Wang, D. Liu, X. Yu, Y. Zheng, Z. Wen, W. Lei, Y. Deng, J. Wang, G. Hong and H. Shao, Adv. Funct. Mater., 2021, 31, 2102546 CrossRef CAS.
- Z. Jin, Z. Cui, X. Long, M. Millan, G. Yuan, Z. Dong, Y. Cong, J. Zhang, Y. Li and X. Li, J. Alloys Compd., 2021, 887, 161357 CrossRef CAS.
- J. Zhang, M. Terrones, C. R. Park, R. Mukherjee, M. Monthioux, N. Koratkar, Y. S. Kim, R. Hurt, E. Frackowiak, T. Enoki, Y. Chen, Y. Chen and A. Bianco, Carbon, 2016, 98, 708–732 CrossRef CAS.
- B. Wang, Y. Peng, F. Yuan, Q. Liu, L. Sun, P. Zhang, Q. Wang, Z. Li and Y. A. Wu, J. Power Sources, 2021, 484, 229244 CrossRef CAS.
- S. Ghosh, U. Bhattacharjee, S. Patchaiyappan, J. Nanda, N. J. Dudney and S. K. Martha, Adv. Energy Mater., 2021, 11, 2100135 CrossRef CAS.
- B. Sun, Q. Zhang, H. Xiang, F. Han, W. Tang, G. Yuan, Y. Cong, C. Fan, A. Westwood and X. Li, Energy Storage Mater., 2020, 24, 450–457 CrossRef.
- D. Wang, J. Zhou, Z. Li, J. Li, L. Hou and F. Gao, Ionics, 2019, 25, 1531–1539 CrossRef CAS.
- Y. He, F. Han, F. Wang, J. Tao, H. Wu, F. Zhang and J. Liu, Electrochim. Acta, 2021, 373, 137924 CrossRef CAS.
- J. Du, J. Ma, Z. Liu, W. Wang, H. Jia, M. Zhang and Y. Nie, Mater. Lett., 2022, 315, 131921 CrossRef CAS.
- D. Schuepfer, F. Badaczewski, J. Guerra-Castro, D. Hofmann, C. Heiliger, B. Smarsly and P. Klar, Carbon, 2020, 161, 359–372 CrossRef CAS.
- L. Chen, Y. Fei, X. Fan and Z. Jiang, J. Mater. Sci., 2017, 52, 12663–12676 CrossRef CAS.
- T. Li, C. Wang, X. Liu, J. Zheng and H. Wang, Fuel Process. Technol., 2005, 87, 77–83 CrossRef CAS.
- L. Chen, X. Fan, Z. Jiang, T. Ouyang and Y. Fei, Carbon, 2016, 103, 421–424 CrossRef CAS.
- M. Fang, T. Ho, J. Yen, Y. Lin, J. Hong, S. Wu and J. Jow, Materials, 2015, 8, 3550–3561 CrossRef CAS.
- C. Zhu, Y. Zhang, Z. Ma, H. Wang and G. L. Sly, Nanotechnology, 2021, 32, 85403 CrossRef CAS PubMed.
- H. Shin, J. Hwang, H. J. Kwon, W. Kwak, S. Kim, H. Kim and H. Jung, ACS Sustainable Chem. Eng., 2020, 8, 14150–14158 CrossRef CAS.
- X. Gong, B. Lou, R. Yu, Z. Zhang, S. Guo, G. Li, B. Wu and D. Liu, Fuel Process. Technol., 2021, 217, 106832 CrossRef CAS.
- D. Schüpfer, F. Badaczewski, J. Peilstöcker, J. Guerra-Castro, H. Shim, S. Firoozabadi, A. Beyer, K. Volz, V. Presser, C. Heiliger, B. Smarsly and P. Klar, Carbon, 2021, 172, 214–227 CrossRef.
- C. Ma, Z. Wang, Y. Zhao, Y. Li and J. Shi, J. Alloys Compd., 2020, 844, 156201 CrossRef CAS.
- T. Pfaff, F. Badaczewski, M. Loeh, A. Franz, J. Hoffmann, M. Reehuis, W. Zeier and B. Smarsly, J. Phys. Chem. C, 2019, 123, 20532–20546 CrossRef CAS.
- M. F. Hassan, M. A. Sabri, H. Fazal, A. Hafeez, N. Shezad and M. Hussain, J. Anal. Appl. Pyrolysis, 2020, 145, 104715 CrossRef CAS.
- L. Xie, C. Tang, Z. Bi, M. Song, Y. Fan, C. Yan, X. Li, F. Su, Q. Zhang and C. Chen, Adv. Energy Mater., 2021, 11, 2101650 CrossRef CAS.
- Y. Qi, Y. Lu, L. Liu, X. Qi, F. Ding, H. Li, X. Huang, L. Chen and Y. Hu, Energy Storage Mater., 2020, 26, 577–584 CrossRef.
- L. Hou, H. Zheng, R. Cui, Y. Jiang, Q. Li, X. Jiang, J. Gao and F. Gao, Microporous Mesoporous Mater., 2019, 275, 42–49 CrossRef CAS.
- I. Mochida, C. Ku, S. Yoon and Y. Korai, J. Power Sources, 1998, 75, 214–222 CrossRef CAS.
- G. Nava, J. Schwan, M. G. Boebinger, M. T. McDowell and L. Mangolini, Nano Lett., 2019, 19, 7236–7245 CrossRef CAS PubMed.
- S. Guo, X. Hu, Y. Hou and Z. Wen, ACS Appl. Mater. Interfaces, 2017, 9, 42084–42092 CrossRef CAS PubMed.
- F. Dou, Y. Weng, Q. Wang, G. Chen, H. Liu, L. Shi and D. Zhang, Chem. Eng. J., 2021, 417, 128122 CrossRef CAS.
- H. Fujimoto, J. Power Sources, 2010, 195, 5019–5024 CrossRef CAS.
- B. Xing, H. Zeng, G. Huang, J. Jia, R. Yuan, C. Zhang, Q. Sun, Y. Cao, Z. Chen and B. Liu, Electrochim. Acta, 2021, 376, 138043 CrossRef CAS.
- Y. Wang, S. Chou, J. H. Kim, H. Liu and S. Dou, Electrochim. Acta, 2013, 93, 213–221 CrossRef CAS.
- X. Zhang, M. Wang, Y. Wang, S. Zhou, G. Yang, Y. Ren, Q. Wang, R. Zhang, J. Zheng, X. Lu, W. Yang and L. Chen, Solid State Ionics, 2021, 364, 115637 CrossRef CAS.
- S. Chen, L. Shen, P. A. van Aken, J. Maier and Y. Yu, Adv. Mater., 2017, 29, 1605650 CrossRef PubMed.
- J. Yang, Y. Wang, S. Chou, R. Zhang, Y. Xu, J. Fan, W. Zhang, H. Kun Liu, D. Zhao and S. Xue Dou, Nano Energy, 2015, 18, 133–142 CrossRef CAS.
- M. Jeong, H. L. Du, M. Islam, J. K. Lee, Y. Sun and H. Jung, Nano Lett., 2017, 17, 5600–5606 CrossRef CAS PubMed.
- Y. Zhang, B. Li, B. Tang, Z. Yao, X. Zhang, Z. Liu, R. Gong and P. Zhao, J. Alloys Compd., 2020, 846, 156437 CrossRef CAS.
- H. Dong, X. Fu, J. Wang, P. Wang, H. Ding, R. Song, S. Wang, R. Li and S. Li, Carbon, 2021, 173, 687–695 CrossRef CAS.
Footnote |
| † Electronic supplementary information (ESI) available. See https://doi.org/10.1039/d2ra01997c |
| This journal is © The Royal Society of Chemistry 2022 |

