 Open Access Article
Phase transition, thermal stability, and molecular dynamics of organic–inorganic hybrid perovskite [NH3(CH2)6NH3]CuCl4 crystals†
Moon Young Choia,
Seon Ju Leea,
Huiyeong Jub and
Ae Ran Lim *ac
*ac
aGraduate School of Carbon Convergence Engineering, Jeonju University, Jeonju 55069, South Korea
bKorea Basic Science Institute, Seoul Western Center, Seoul 03759, South Korea
cDepartment of Science Education, Jeonju University, Jeonju 55069, South Korea. E-mail: aeranlim@hanmail.net; arlim@jj.ac.kr
First published on 20th July 2022
Abstract
Organic–inorganic hybrid perovskites have various potential applications in fuel cells and solar cells. In this regard, the physicochemical properties of an organic–inorganic [NH3(CH2)6NH3]CuCl4 crystal was conducted. The crystals had a monoclinic structure with space group P21/n and lattice constants a = 7.2224 Å, b = 7.6112 Å, c = 23.3315 Å, β = 91.930°, and Z = 4 at 300 K, and the phase transition temperature (TC) was determined to be 363 K by X-ray diffraction and differential scanning calorimetry experiments. From the nuclear magnetic resonance experimental results, the changes in the 1H chemical shifts in NH3 and the influence of C1 located close to NH3 in the [NH3(CH2)6NH3] cation near TC are determined to be large, which implies that the structural change of CuCl4 linked to N–H⋯Cl is large. The 1H spin–lattice relaxation time (T1ρ) in NH3 is shorter than that of CH2, and the 13C T1ρ values for C1 close to NH3 are shorter than those of C2 and C3 due to the influence of the paramagnetic Cu2+ ion in square planar geometry CuCl4. The structural mechanism for the phase transition was the change in the N–H⋯Cl hydrogen bond and was associated with the structural dynamics of the CuCl4 anion.
1. Introduction
Compounds with the general formula [NH3(CH2)nNH3]BX4 (n = 2, 3, 4, ⋯, B = divalent metal ion, and X = Cl−, Br−) are known to crystallize as two-dimensional (2D) perovskite-like structures and are generally referred to as organic–inorganic hybrid perovskites.1–9 Basically, the structure of 2D hybrid perovskite materials consists of organic cations and metal halide layers. The physicochemical properties of organic–inorganic hybrids depend on the organic cations, the inorganic anion coordination geometry of the metal ion, and the halogen ions, which allow the properties of hybrid perovskite to be tailored.3–5,10–14 The properties of the organic–inorganic hybrid are functions of B and X, and it is important to consider the structural properties of these new materials. The organic cation of the hybrid complex is responsible for structural flexibility and nonlinear optical properties, whereas the inorganic anion is responsible for thermal and mechanical properties.15,16 Recently, studies on [NH3(CH2)nNH3]BX2X′2 containing different halogen ions were conducted by Abdel-Aal et al.17–19 to improve the optical properties. When n » 4, the structural rearrangement due to conformational changes in the chains of long-chain alkylenediammonium complexes [NH3(CH2)nNH3]BX4 becomes significant.20–24 As one of them, a group of interest in hybrid materials is perovskite-type layered [NH3(CH2)6NH3]CuCl4 (1,6-hexanediammonium tetrachlorocuprate (II)) containing [NH3(CH2)6NH3] cations and layered CuCl4 anions. In the case of B![[double bond, length as m-dash]](https://www.rsc.org/images/entities/char_e001.gif) Cu, the crystal structures consist of square planar geometry25 CuCl42− and organic chains.16 The CuCl4 anions share corners that extend into infinite sheets separated by alkylene [NH3(CH2)6NH3] groups. The NH3 at both ends of the organic chain is connected by N–H⋯Cl hydrogen bonds26,27 with the Cl− ions of the inorganic layers that stabilize the layered structure, making these materials good candidates as proton conductors,28 and have potential applications in UV detection.29,30
Cu, the crystal structures consist of square planar geometry25 CuCl42− and organic chains.16 The CuCl4 anions share corners that extend into infinite sheets separated by alkylene [NH3(CH2)6NH3] groups. The NH3 at both ends of the organic chain is connected by N–H⋯Cl hydrogen bonds26,27 with the Cl− ions of the inorganic layers that stabilize the layered structure, making these materials good candidates as proton conductors,28 and have potential applications in UV detection.29,30
To date, the crystal structure and electrical properties of [NH3(CH2)6NH3]ZnCl4 with B![[double bond, length as m-dash]](https://www.rsc.org/images/entities/char_e001.gif) Zn have been studied by Mostafa and El-Khiyami,3 while only the optical properties for [NH3(CH2)6NH3]CuCl4 with B
Zn have been studied by Mostafa and El-Khiyami,3 while only the optical properties for [NH3(CH2)6NH3]CuCl4 with B![[double bond, length as m-dash]](https://www.rsc.org/images/entities/char_e001.gif) Cu have been reported by Abdel-Aal.5 Detailed studies on systems where n = 6 have not been conducted. Despite the interesting properties of 2D perovskite-like materials, they decompose in humid air and have a similar toxicity to that of Pb.31–35 Therefore, it is essential to develop a hybrid perovskites that can be replaced with an eco-friendly materials. Recent advances in the development of perovskites have increased the demand for the characterization of their structures and dynamics.
Cu have been reported by Abdel-Aal.5 Detailed studies on systems where n = 6 have not been conducted. Despite the interesting properties of 2D perovskite-like materials, they decompose in humid air and have a similar toxicity to that of Pb.31–35 Therefore, it is essential to develop a hybrid perovskites that can be replaced with an eco-friendly materials. Recent advances in the development of perovskites have increased the demand for the characterization of their structures and dynamics.
The objective of this study was to investigate the crystal structure, phase transition, and thermodynamic properties of [NH3(CH2)6NH3]CuCl4. We also discuss the roles of cations in single-crystal [NH3(CH2)6NH3]CuCl4 near the phase transition temperature (TC). Chemical shifts and spin–lattice relaxation times (T1ρ) were studied using 1H magic angle spinning (MAS) nuclear magnetic resonance (NMR) and 13C MAS NMR to understand the structural environment and molecular motions of the organic chain. These results help explain the physical, chemical, and thermal properties, as well as structural dynamics based on the phase transition mechanism for the practical application of [NH3(CH2)6NH3]CuCl4 crystals.
2. Experimental
[NH3(CH2)6NH3]CuCl4 single crystals were grown from saturated aqueous solutions containing stoichiometric quantities of hexane-diammonium dichloride (NH2(CH2)6NH2·2HCl, Sigma-Aldrich, 99%) and copper chloride (CuCl2, Sigma-Aldrich, 99%) in the molar ratio of 1![[thin space (1/6-em)]](https://www.rsc.org/images/entities/char_2009.gif) :
:![[thin space (1/6-em)]](https://www.rsc.org/images/entities/char_2009.gif) 1 at 300 K. The mixture was stirred and heated to obtain a homogeneous solution. The resulting solution was filtered and single crystal were obtained by slow evaporation. Light brown single crystals of approximately 4 × 3 × 1 mm were grown at constant temperature for approximately 3 weeks.
1 at 300 K. The mixture was stirred and heated to obtain a homogeneous solution. The resulting solution was filtered and single crystal were obtained by slow evaporation. Light brown single crystals of approximately 4 × 3 × 1 mm were grown at constant temperature for approximately 3 weeks.
Fourier transform infrared (FT-IR) spectra were measured between 4000 and 500 cm−1 on a PerkinElmer (L1600300) spectrometer using a compressed KBr pellet.
The lattice parameters at various temperatures were determined by single-crystal X-ray diffraction (XRD) at the Seoul Western Center of the Korea Basic Science Institute (KBSI). A colorless crystal block was picked up with paratone oil and mounted on a Bruker D8 Venture PHOTON III M14 diffractometer equipped with a graphite-monochromated Mo-Kα (λ = 0.71073 Å) radiation source and a nitrogen cold stream (−50 °C). Data was collected and integrated using SMART APEX3 (Bruker, 2016) and SAINT (Bruker, 2016). The absorption was corrected by a multi-scan method implemented in SADABS. The structure was solved using direct methods and refined by full-matrix least-squares on F2 using SHELXTL. All non-hydrogen atoms were refined anisotropically, and the hydrogen atoms were added to their geometrically ideal positions. Additionally the powder XRD patterns of the [NH3(CH2)6NH3]CuCl4 crystals were measured at several temperatures using an XRD system with a Mo-Kα radiation source. Experiments were conducted using the method described here.35
Differential scanning calorimetry (DSC) thermogram were observed using a DSC (25, TA Instruments) at heating and cooling speeds of 10 °C min−1 between 200 and 500 K under a flow of dry nitrogen gas.
Thermogravimetric analysis (TGA) was measured on a thermogravimetric analyzer with heating speed of 10 °C min−1 between 300 and 873 K under N2 gas. In addition, optical observations between 300 and 680 K were made using a Carl Zeiss optical polarized microscope.
NMR spectra of [NH3(CH2)6NH3]CuCl4 crystals were obtained using a Bruker 400 MHz Avance II + solid-state NMR spectrometer at the same facility, KBSI. The Larmor frequency for 1H MAS NMR was ωo/2π = 400.13 MHz and that for 13C MAS NMR was ωo/2π = 100.61 MHz. The MAS rate was set at a speed of 10 kHz to minimize sideband, and tetramethylsilane (TMS) was used as a basic materials to accurately measure the NMR chemical shift. The T1ρ values were obtained from the spectra measured using a π/2−τ pulse followed by a spin-lock pulse of duration τ, and the π/2 pulse widths for 1H and 13C were measured using the method described here.36
3. Results and discussion
3.1 FT-IR spectra
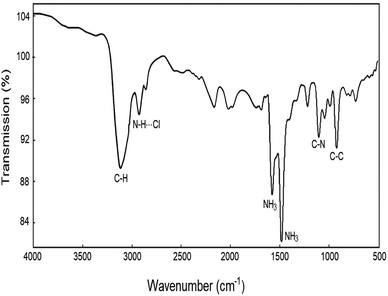
The FT-IR spectra at room temperature were obtained between 4000 and 500 cm−1, and their result is shown in Fig. 1. The strong band at around 3116 cm−1 was assigned to the C–H mode, and the band at 2928 cm−1 was expected when N–H⋯Cl hydrogen bonds are formed. The peaks at 1576 and 1480 cm−1 corresponded to asymmetric NH3 deformation and symmetric NH3 deformation, respectively. Bands near 1102 and 921 cm−1 were defined to the C–N and C–C modes, respectively. These results are consistent with those reported by Abdel-Aal et al.53.2 Crystal structure
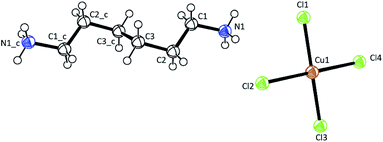
Single-crystal XRD results for [NH3(CH2)6NH3]CuCl4 crystals were obtained at 300 K. The hybrid was found to have crystallized as a monoclinic system with a space group P21/n and had lattice constants a = 7.2224 Å, b = 7.6112 Å, c = 23.3315 Å, β = 91.930°, and Z = 4. Table 1 lists single-crystal XRD and refinement data of the [NH3(CH2)6NH3]CuCl4 crystal, and Fig. 2 shows its structure. The Cu atom is coordinated by four Cl atoms, forming a square planar geometry of CuCl4. The hydrogen atoms of each formula unit are able to form hydrogen bonds N–H⋯Cl. The atomic numbering scheme and thermal ellipsoids for the H atoms are shown in Fig. 3, and their bond lengths and angles are summarized in Table 2. The asymmetric unit contains two half [NH3(CH2)6NH3] and one CuCl4. The detailed results of the crystal structure are shown in ESI.†| Chemical formula | C6H18N2CuCl4 |
| Weight | 323.56 |
| Crystal system | Monoclinic |
| Space group | P21/n |
| T (K) | 300 |
| a (Å) | 7.2224 |
| b (Å) | 7.6112 |
| c (Å) | 23.3315 |
| β (°) | 91.930 |
| Z | 4 |
| V (Å3) | 1281.83 |
| Radiation type | Mo-Kα |
| Wavelength (Å) | 0.71073 |
| Reflections collected | 22![[thin space (1/6-em)]](https://www.rsc.org/images/entities/char_2009.gif) 737 737 |
| Independent reflections | 3182 (Rint = 0.0568) |
| Goodness-of-fit on F2 | 1.071 |
| Final R indices [I > 2sigma(I)] | R1 = 0.0510, wR2 = 0.1214 |
| R indices (all data) | R1 = 0.0793, wR2 = 0.1407 |
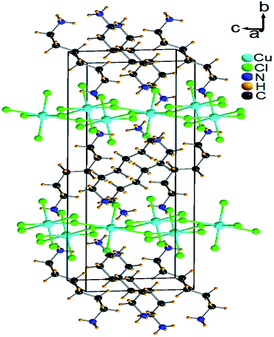 | ||
| Fig. 2 Crystal structure of [NH3(CH2)6NH3]CuCl4 at 300 K [A.R. Lim CCDC 2170927]. | ||
| Bond-length (Å) and Bond-angle (°) | |
|---|---|
| a Symmetry operations: (a) −x + 3/2, y −1/2, −z + 1/2; (b) −x + 1/2, y + 1/2, −z + 1/2. | |
| Cl(1)–Cu(1) | 2.2905 (12) |
| Cl(2)–Cu(1) | 2.3093 (12) |
| Cl(3)–Cu(1) | 2.2891 (12) |
| Cl(4)–Cu(1) | 2.3031 (12) |
| N(1)–C(1) | 1.495 (7) |
| C(1)–C(2) | 1.445 (8) |
| C(2)–C(3) | 1.536 (9) |
| C(3)–C(3)_c | 1.517 (13) |
| C(3)_c–C(2)_c | 1.508 (8) |
| C(2)_c–C(1)_c | 1.481 (8) |
| Cl(2)–Cu(1)–Cl(3) | 90.27 (4) |
| Cl(2)–Cu(1)–Cl(4) | 179.71 (5) |
| Cl(3)–Cu(1)–Cl(4) | 89.51 (4) |
| Cl(2)–Cu(1)–Cl(1) | 89.74 (5) |
| Cl(3)–Cu(1)–Cl(1) | 179.83 (5) |
| Cl(1)–Cu(1)–Cl(4) | 90.47 (4) |
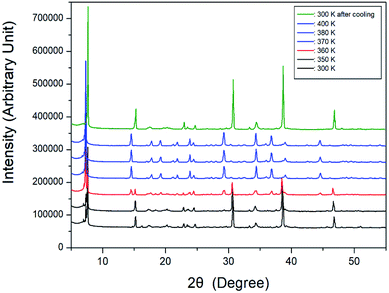
Further, XRD powder patterns of the [NH3(CH2)6NH3]CuCl4 crystal were obtained at different temperatures during heating, and the results are shown in Fig. 4. The XRD patterns at 300 and 350 K were identical, and the XRD patterns at temperatures above 370 K were the same as those at 380 and 400 K. At 360 K (red), it can be seen that the phase at 350 K and the phase at 370 K coexist. The XRD pattern taken at 360 K showed a clear change in symmetry associated with a phase transition. The final pattern (olive) is depicted after being cooled down to room temperature (300 K). It shows that the crystal undergoes an reversible phase transition as is clearly seen by the differences of the XRD powder pattern obtained at 300 K before heating and 300 K after cooling.
3.3 Phase transition
Fig. 5 shows the results of heating and cooling at a speed of 10 °C min−1 for the DSC experiment on [NH3(CH2)6NH3]CuCl4 crystals. As a result of heating, an endothermic peak was observed at 363 K, and an exothermic peak due to cooling was observed at 338 K. The temperature of 363 K shown in the DSC curve is the same as the change at 360 K, as shown in the XRD results. This temperature was expressed as the phase transition temperature TC (H) (=363 K) and TC (C) (=338 K) according to heating and cooling, respectively.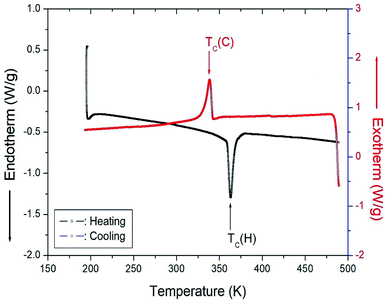 | ||
| Fig. 5 Differential scanning calorimetry (DSC) curves for heating and cooling in [NH3(CH2)6NH3]CuCl4. | ||
3.4 Thermal properties
The TGA and differential thermal analysis (DTA) experimental results were measured at the same heating rate used in the DSC experiment to understand the thermal properties, and the results are shown in Fig. 6. Mass loss began at approximately 507 K, which represents the onset of partial thermal decomposition. The molecular weight of the [NH3(CH2)6NH3]CuCl4 decreased with increasing temperature. From the total molecular weight (Mw = 323.57 mg), the amount of residue was determined using eqn (1) and (2).37| {[NH2(CH2)6NH2·HCl]CuCl4 + HCl(g)}/[NH3(CH2)6NH3]CuCl4 = 88.73% | (1) |
| {[NH2(CH2)6NH2]CuCl4 + 2HCl(g)}/[NH3(CH2)6NH3]CuCl4 = 77.46% | (2) |
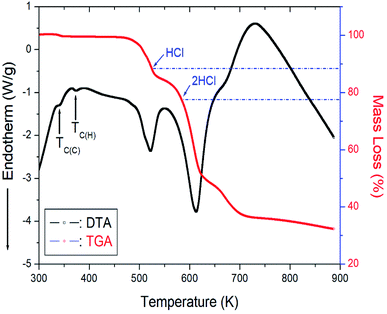 | ||
| Fig. 6 Thermogravimetric analysis (TGA) and differential thermal analysis (DTA) curves of [NH3(CH2)6NH3]CuCl4. | ||
The losses of 11% and 23% calculated from the molecular weight were affected by the decomposition of HCl and 2HCl, respectively, and the temperature of HCl and 2HCl loss obtained by TGA experiment were 527 and 584 K. Near 900 K, the weight loss of 70% occurred. The mass sharply decreased between 510 and 600 K, with a corresponding mass loss of 50% near 650 K.
On the other hand, to support the DSC and TGA results, the morphology of single crystals with changing temperature is observed using an optical polarizing microscopy experiment. The crystal was light brown at room temperature. As the temperature increased, the crystal turned brown, and the crystal was dark brown above 490 K. Finally, the surface of the single crystal was slightly melted near 540 K. However, the two small endothermic peaks near 345 and 370 K in the DTA curve were assigned to the phase transition temperature detected during cooling and heating, respectively, in the DSC results.
3.5 1H MAS NMR spectrum
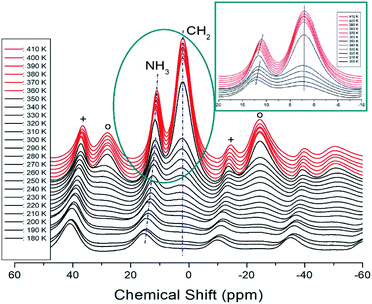
The 1H MAS NMR spectra of [NH3(CH2)6NH3]CuCl4 crystals were measured while increasing the temperature, and the results of in situ 1H chemical shifts between 180 and 410 K are shown in Fig. 7. At low temperatures, only one resonance signal for 1H of NH3 was recorded and the line width for 1H of CH2 was too broad to be measured. However, as the temperature increased, the NMR spectrum showed two resonance lines for NH3 and CH2. At 300 K, the 1H chemical shifts for NH3 and CH2 were 12.14 and 2.24 ppm, respectively. The spinning sidebands for NH3 and CH2 are marked with pluses and open circles, respectively. The chemical shifts at temperatures below TC (=363 K) are represented in black, and those at temperatures above TC are represented in red. In the case of heating, the chemical shifts change at approximately 360 K in the 1H NMR spectrum. A detailed picture is shown in the inset of Fig. 7, where the 1H chemical shifts of CH2, indicated by dotted lines, are almost temperature-independent over a wide temperature range, whereas those of NH3 are discontinuous and vary significantly near TC. In addition, the number of protons related to NH3 and CH2 in the [NH3(CH2)6NH3] cation were 6 and 12, respectively, and the intensity of the 1H resonance peak was related to the number of protons. The large change in the 1H chemical shift of NH3 of the organic group near TC is due to the change in N–H⋯Cl hydrogen connected by the inorganic group.3.6 13C MAS NMR spectrum
The 13C chemical shifts for the in situ MAS NMR spectra for heating and cooling are shown in Fig. 8 and 9, respectively. The TMS reference signal for 13C at 300 K was recorded at 38.3 ppm, and this value was taken as the standard for the 13C chemical shift. In the [NH3(CH2)6NH3] cation, CH2 close to NH3 at both ends of the organic chain was designated C1, CH2 at the middle of 6 CH2 chains was designated C3, and CH2 between C1 and C3 was designated C2, as shown in the inset of Fig. 8. Fig. 8 shows the 13C MAS NMR spectra measured during heating. At low temperatures, 4–5 resonance lines were reduced to three resonance lines near TC. Here, the spectrum below the phase transition temperature of 360 K is shown in black, and the spectrum above 360 K is shown in red. In addition, the chemical shifts of C1 changed rapidly with temperature compared to those of C2 and C3. These results show that C1, which is close to N, has the greatest change with temperature. On the other hand, in the case of cooling, the results of the 13C MAS NMR spectrum are presented in Fig. 9; it shows that the spectrum changes near 350 K, which is slightly different from the 338 K obtained in the DSC curve. Here, the phase transition temperature is depicted by the blue line above TC, and the black line below TC is the boundary. The chemical shifts were the same at all temperatures during heating and cooling, but only the phase transition temperature was different. At 400 K, the 13C chemical shifts were recorded at 118.46, 50.94, and 27.19 ppm for C1, C2, and C3, respectively. From this result, the surrounding environments of all the 13C ions changed according to the temperature. Similar to the result of H, it was found that the chemical shift of C1 close to N changed the most. As determined from this result, C1 is most closely connected with the N–H⋯Cl bond; thus, the change in C1 is thought to be indirectly related to the change in square planar geometry CuCl4.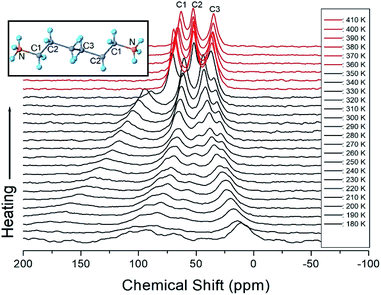 | ||
| Fig. 8 MAS 13C NMR spectrum of [NH3(CH2)6NH3]CuCl4 above (red region) and below TC (black region) according to the heating. | ||
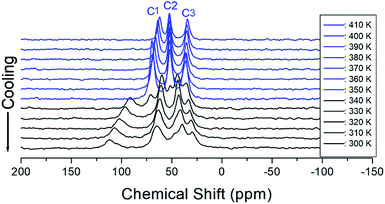 | ||
| Fig. 9 MAS 13C NMR spectrum of [NH3(CH2)6NH3]CuCl4 above (blue region) and below TC (black region) according to the cooling. | ||
For the MAS NMR probe, the difference between the set temperature and sample temperature inside the probe was previously reported by Guan and Stark.38 The equation for fast MAS probe is
| TS(f) = 0.98 TO + 3.79 (°C) exp(ωr/19.6 kHz) −3.49 (°C) | (3) |
3.7 1H and 13C spin–lattice relaxation times
The 1H and 13C MAS NMR spectra were measured with varying delay times at each given temperature, and the plot of spectral intensities versus delay times was found to follow a mono-exponential function. The decay rate of the magnetization is characterized by the spin–lattice relaxation time (T1ρ) as39–41| PH(C)(τ) = PH(C)(0) exp(−τ/T1p) | (4) |
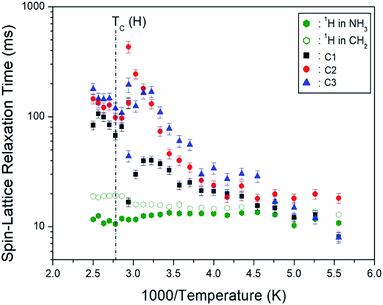 | ||
| Fig. 10 Temperature dependences of 1H and 13C NMR spin–lattice relaxation times T1ρ in [NH3(CH2)6NH3]CuCl4. | ||
4. Conclusions
To understand the structural, thermodynamic, and physicochemical properties of the hybrid perovskite [NH3(CH2)6NH3]CuCl4 crystal, XRD, DSC, TGA, and NMR experiments were performed. First, the [NH3(CH2)6NH3]CuCl4 crystals at 300 K belong to a monoclinic system with a space group P21/n, and the lattice constants are a = 7.2224 Å, b = 7.6112 Å, c = 23.3315 Å, β = 91.930°, and Z = 4 (CCDC 2170927). The phase transition temperature was determined to be TC = 363 K based on the DSC results and XRD powder patterns. And, its thermal stability was observed at about 507 K. Second, from the NMR experimental results, the 1H chemical shifts in NH3 and the influence of C1 located close to NH3 near TC are large, which implies that the structural change of CuCl4 linked to the N–H⋯Cl is large. On the other hand, the 1H T1ρ values in NH3 are shorter than those in CH2, and the 13C T1ρ values for C1 located close to NH3 are shorter than the T1ρ values of C2 and C3. The T1ρ value of C1 located close to the paramagnetic Cu2+ ion is shorter than the T1ρ values of C2 and C3 located far from Cu2+ because of the magnetic moment of the paramagnetic ion. Consequently, the main contribution to the phase transition was the structural change of the N–H⋯Cl hydrogen bond and was associated with the reorientational dynamics of the CuCl4 anion. The role on N–H⋯Cl hydrogen bond in this study will be helpful of hybrid perovskite types for their applications in fuel cell and solar cell.Author contributions
A. R. Lim performed NMR experiments and wrote the manuscript. M. Y. Choi and S. J. Lee measured TGA and DSC experiments. H. Ju performed XRD experiment.Conflicts of interest
There are no conflicts to declare.Acknowledgements
This research was supported by the Basic Science Research Program through the National Research Foundation of Korea (NRF), funded by the Ministry of Education, Science and Technology (2018R1D1A1B07041593 and 2016R1A6A1A03012069).References
- C. N. R. Rao, A. K. Cheetham and A. Thirumurugan, J. Phys.: Condens. Matter, 2008, 20, 83202 CrossRef.
- Z. Cheng and J. Lin, CrystEngCom, 2010, 12, 2646 RSC.
- M. F. Mostafa and S. S. El-khiyami, J. Solid State Chem., 2014, 209, 82 CrossRef CAS.
- S. Gonzalez-Carrero, R. E. Galian and J. Perez-Prieto, Part. Part. Syst. Charact., 2015, 32, 709 CrossRef CAS.
- S. K. Abdel-Aal, G. Kocher-Oberlehner, A. Ionov and R. N. Mozhchil, Appl. Phys. A, 2017, 123, 531 CrossRef.
- W. Liu, J. Xing, J. Zhao, X. Wen, K. Wang, L. Peixiang and Q. Xiong, Adv. Opt. Mater., 2017, 5, 1601045 CrossRef.
- P. Mondal, S. K. Abdel-Aal, D. Das and S. K. Manirul Islam, Catal. Lett., 2017 Search PubMed.
- M. Elseman, A. E. Shalan, S. Sajid, M. M. Rashad, A. M. Hassan and M. Li, ACS Appl. Mater. Interfaces, 2018, 10, 11699 CrossRef PubMed.
- J. A. Aramburu, P. Garcia-Fernandez, N. R. Mathiesen and J. M. Garcia-Lastra, J. Phys. Chem. C, 2018, 122, 5071 CrossRef CAS.
- K. Pradeesh, G. S. Yadav, M. Singh and G. Vijaya Prakash, Mater. Chem. Phys., 2010, 124, 44 CrossRef CAS.
- S. Saikumar, J. J. Ahmad, G. Baumberg and G. Vijaya Prakash, Scr. Mater., 2012, 67, 834 CrossRef.
- B. Staskiewicz, O. Czupinski and Z. Czapla, J. Mol. Struct., 2014, 1074, 723 CrossRef CAS.
- S. Ahmad, C. Hanmandlu, P. K. Kanaujia and G. Vijaya Prakash, Opt. Mater. Express, 2014, 4, 1313 CrossRef CAS.
- Z. Czapla, J. Przeslawski, M. Crofton, J. Janczak, O. Czupinski, A. Ingram and M. Kostrzewa, Phase Transitions, 2017, 90, 637 CrossRef CAS.
- W. Zang and R.-G. Xiong, Chem. Rev., 2012, 112, 1163 CrossRef PubMed.
- A. R. Lim and L. K. Kwac, Sci. Rep., 2022, 12, 8769 CrossRef CAS PubMed.
- S. K. Abdel-Aal and A. Ouasri, J. Mol. Struct., 2022, 1251, 131997 CrossRef CAS.
- S. K. Abdel-Aal, M. F. Kandeel, A. F. El-Sherif and A. S. Abdel-Rahman, Phys. Status Solidi A, 2021, 218, 2100036 CrossRef CAS.
- S. K. Abdel, A. S. Abdel-Rahman, W. M. Gamal, M. Abdel-Kader, H. S. Ayoub, A. F. El-Sherif, M. F. Kandeel, S. Bozhko, E. E. Yakimov and E. B. Yakimov, Acta Crystallogr., Sect. B: Struct. Sci., Cryst. Eng. Mater., 2019, 75, 880 CrossRef PubMed.
- R. Kind, S. Plesko, P. Gunter, J. Roos and J. Fousek, Phys. Rev. B: Condens. Matter Mater. Phys., 1981, 23, 5301 CrossRef CAS.
- M. F. Mostafa, S. S. El-Khiyami and S. K. Alal, J. Phys. Chem. Solids, 2018, 118, 6 CrossRef CAS.
- M. F. Mostafa, S. S. El-Khiyami and S. K. Alal, Mater. Chem. Phys., 2017, 199, 454 CrossRef CAS.
- K. Ahmad and S. M. Mobin, Energy Technol., 2020, 8, 1901185 CrossRef CAS.
- S. K. Abdel-Aal and A. Ouasri, J. Mol. Struct., 2022, 1251, 131997 CrossRef CAS.
- A. Jaffe, Y. Lin, W. L. Mao and H. I. Karunadasa, J. Am. Chem. Soc., 2015, 137, 1673 CrossRef CAS PubMed.
- A. Kallel, J. Fail, H. Fuess and A. Daoud, Acta Crystallogr., Sect. B: Struct. Crystallogr. Cryst. Chem., 1980, 36, 2788 CrossRef.
- W. T. A. Harrison, Acta Crystallogr., Sect. E: Struct. Rep. Online, 2005, 61, m1951 CrossRef CAS.
- M. F. Mostafa and A. Hassen, Phase Transitions, 2006, 79, 305 CrossRef CAS.
- P. A. N. Xiao-Wei, W. U. Gang, W. A. N. G. Mang and C. H. E. N. Hong-Zheng, J. Zhejiang Univ., Sci., A, 2009, 10, 710 CrossRef.
- Q. Chen, N. D. Marco, Y. Yang, T.-B. Song, C.-C. Chen, H. Zhao, Z. Hong, H. Zhou and Y. Yang, Nano Today, 2015, 10, 355 CrossRef CAS.
- I. M. Hermes, S. A. Bretschneider, V. W. Bergmann, D. Li, A. Klasen, J. Mars, W. Tremel, F. Laquai, H.-J. Butt, M. Mezger, R. Berger, B. J. Rodriguez and S. A. L. Weber, J. Phys. Chem. C, 2016, 120, 5724 CrossRef CAS.
- S. K. Abdel-Aal, A. S. Abdel-Rahman, G. G. Kocher-Oberlehner, A. Ionov and R. Mozhchil, Acta Crystallogr., Sect. A: Found. Adv., 2017, 70, C1116 Search PubMed.
- E. Strelcov, Q. Dong, T. Li, J. Chae, Y. Shao, Y. Deng, A. Gruverman, J. Huang and A. Centrone, Sci. Adv., 2017, 3, e1602165 CrossRef PubMed.
- Y. Liu, L. Collins, R. Proksch, S. Kim, B. R. Watson, B. Doughty, T. R. Calhoun, M. Ahmadi, A. V. Ievlev, S. Jesse, S. T. Retterer, A. Belianinov, K. Xiao, J. Huang, B. G. Sumpter, S. V. Kalinin, B. Hu and O. S. Ovchinnikova, Nat. Mater., 2018, 17, 1013 CrossRef CAS PubMed.
- J. Lee, W. Lee, K. Kang, T. Lee and S. K. Lee, Chem. Mater., 2021, 33, 370 CrossRef CAS.
- A. R. Lim, Sci. Rep., 2020, 10, 20853 CrossRef CAS PubMed.
- A. R. Lim, S. H. Kim and Y. L. Joo, Sci. Rep., 2021, 11, 8408 CrossRef CAS PubMed.
- X. Guan and R. E. Stark, Solid State Nucl. Magn. Reson., 2010, 38, 74 CrossRef CAS PubMed.
- A. Abragam, The Principles of Nuclear Magnetism, Oxford University press, 1961 Search PubMed.
- R. K. Harris, Nuclear Magnetic Resonance Spectroscopy, Pitman Pub., UK, 1983 Search PubMed.
- J. L. Koenig, Spectroscopy of Polymers, Elsevier, New York, 1999 Search PubMed.
Footnote |
| † Electronic supplementary information (ESI) available: XRD data, bond distances and angles, and hydrogen-bond geometrics of the crystal structure. CCDC 2170927. For ESI and crystallographic data in CIF or other electronic format see https://doi.org/10.1039/d2ra02975h |
| This journal is © The Royal Society of Chemistry 2022 |

