
 Open Access Article
 This Open Access Article is licensed under a Creative Commons Attribution-Non Commercial 3.0 Unported Licence
Retracted Article: Fabrication of novel quantum dots for the estimation of COVID-19 antiviral drug using green chemistry: application to real human plasma†
Baher I. Salman *a,
Adel Ehab Ibrahimbc,
Sami El Deebbd and
Roshdy E. Sarayac
*a,
Adel Ehab Ibrahimbc,
Sami El Deebbd and
Roshdy E. Sarayac
aPharmaceutical Analytical Chemistry Department, Faculty of Pharmacy, Al-Azhar University, Assiut Branch, Assiut, 71524, Egypt. E-mail: bahersalman@azhar.edu.eg; bahersalman2013@yahoo.com; Tel: +201099031345
bNatural and Medical Sciences Research Center, University of Nizwa, Birket Almawz, P. O. box 33, Oman
cDepartment of Pharmaceutical Analytical Chemistry, Faculty of Pharmacy, Port Said University, Port Said 42511, Egypt
dInstitute of Medicinal and Pharmaceutical Chemistry, Technische Universitaet Braunschweig, 38106 12 Braunschweig, Germany
First published on 6th June 2022
Abstract
The COVID-19 pandemic has encouraged the search for novel antiviral medications. Recently, molnupiravir (MOL) has been approved as an oral antiviral to manage COVID-19. Thus, the development of sensitive and cost-effective methods for quantification of MOL in real plasma samples (pharmacokinetic) and pharmaceutical tablets is required. Herein, we present the fabrication of novel fluorescent polyamine quantum dots (PA@CQDs) fabricated from apricots using one step synthesis for analysis of MOL. The relative fluorescence intensity (RFI) of the synthesized quantum dots was influentially quenched by the addition of molnupiraivr. The linear range was found to be between 2–70 ng mL−1 with lower limit of quantitation (LOQ) equal to 1.61 ng mL−1. The fluorescent probe was successfully utilized in a pharmacokinetic study of MOL with maximum plasma concentration (Cmax) 920.2 ± 6.12 ng mL−1 without any matrix interference. The sensitivity and selectivity of the presented method allow its application in clinical laboratories.
1. Introduction
The COVID-19 pandemic emerged in late 2019 as an acute respiratory disorder with about three hundred million cases around the world and 5.4 million reported deaths.1 Elderly patients more than 65 years are the most vulnerable category of patients, with mortality rates of 6.26 and 3.35% among hospitalized and non-hospitalized patients.2 Even with limited population density in physically isolated islands, this pandemic showed substantial incidence despite tight restrictive measures.3 Although developed vaccines played an important role to decrease the spread of COVID-19,4 antiviral medications are still necessary to treat infected patients. Recently, MOL has reached phase II/III clinical trials as an antiviral drug that inhibits RNA replications, showing antiviral efficacy against COVID-19 in mild to moderate infections.5,6 Hence, the development of facile and cost effective analytical methods for the estimation of MOL is essential especially in developing countries which do not have very advanced instrumentation.7 The literature describes only one liquid chromatographic (LC) method for the quantification of MOL.8 Although LC methods are reliable analytical methods, access to equipment is limited in many developing countries.Carbon quantum dots are intelligent nanomaterials that have many applications in industry, and bio-medical analysis.9–11 In recent years, fluorescent carbon quantum dots acted as nano-sensors for various applications due to their tunable photoluminescence.12–15
This study describes the practical implementation of novel and cheap polyamine carbon quantum dots (PA@CQDs) for estimation of MOL in pharmaceutical formulations and human plasma samples as a proof-of-concept to utilize PA@CQDs in clinical laboratories.
2. Methodology part
2.1. Materials and reagents
MOL (99.96%) authentic powder was obtained from EIPICO, Egypt. Molcovir® tablets (200 mg MOL/tablet) were manufactured in India and purchased from local market of Egypt. All the other chemicals as boric acid, phosphoric acid, acetic acid, sodium hydroxide, methanol, ethanol, and acetonitrile from (alpha Chem, Egypt). Apricot fruits were obtained from the local market of Egypt.Stock solution of MOL was prepared by dissolving 10 mg of MOL powder into 100 mL ultra-pure water to obtain concentration range equal to 100 μg mL−1. Further dilutions were carried out using the same solvent to prepare working solutions.
2.2. Instruments
The dynamic light scattering measurements (DLS) were scanned by Zetasizer Red badge instrument of ZEN 3600 Nano ZS model (Malvern, UK). Transmission electron microscope (TEM) images were captured on TEM Assembly Parts Power of JEOL JEM-100CX II unit tungsten EM filament 120 (USA). Fourier-transform infrared (FTIR) spectrometer, Germany. Ultrasonic Cleaner (USA). pH-meter (China). Spectrofluorimeter FS2 (Scinco, Korea). The powder X-ray diffraction (PXRD) was scanned by Philips X-ray diffractometer.2.3. Synthesis of green quantum dots
Carbon quantum dots were synthesized using thermolysis of apricot. Firstly, 50 mL of apricot juice placed into a beaker and covered with perforated foil. Then, incinerated in electric oven at 180 °C for 4 h. Then product was crushed, and aggregates transferred into foiled bottle. 100 mg of the product were dispersed in 100 mL ultra-pure water, followed by sonication for 2 h to obtain homogenized mixture. The mixture was filtered to remove large particles, and the filtrate was stored at 4 °C for further use.2.4. Fluorimetric procedure for determination of MOL
A total of 0.7 mL of PA@CQDs dispersion (0.15 mg mL−1) was mixed with 1.0 mL of Britton–Robinson (BR) buffer (pH 6.5) into 5 mL volumetric flask, then 1 mL of working solution of MOL was added to obtain the final concentration range (2–70 ng mL−1) and mixed thoroughly and the volume adjusted using ultra-pure water. The fluorescence was measured at λem 504 nm after 10 min (excitation 440 nm).2.5. Preparation of real sample
MOL tablets (200 mg/tablet) was administrated as single oral dose by 5 healthy volunteers. The blood samples were collected after time intervals (0.25, 0.5 to 9 h) into heparinized tubes. The blood samples were centrifuged at 5000 rpm for 30 min to separate the plasma. Two milliliter of acetonitrile were used as protein precipitating agent.16,17 Then the centrifugation was carried out at 4000 rpm for 15 min to separate the supernatant, then analytical procedure (2.4. section) was followed.2.6. Estimation in pharmaceutical product and content uniformity test
Ten tablets of Molcovir® drug (200 mg MOL per tablet) were weighed and finally powdered. An amount equivalent to 10 mg from the powder were dissolved into 50 mL ultra-pure water with sonication for 3 min followed by filtration to remove undissolved excipients then volume completed to 100 mL with ultra-pure water to get concentration of 100 μg mL−1.For content uniformity test,18 each tablet of Molcovir® drug was individually weighed and finally powdered. An amount equivalent to 10 mg from the powder were dissolved into 50 mL ultra-pure water with sonication for 3 min followed by filtration to remove undissolved excipients then volume completed to 100 mL with ultra-pure water to get concentration of 100 μg mL−1. Then the analytical procedure was followed.
2.7. Reusability of the CQDs as fluorescent probes
The reusability of PA@CQDs was tested by recycling MOL estimation 10 times using fluorescent procedure of MOL. The quantum dots were collected via centrifugation after each cycle, washed with ultra-pure water, ethanol, and dried at for 40 min at 50 °C to be reused.3. Results and discussion
In this study, novel green polyamine carbon quantum dots (PA@CQDs) were synthesized based on hydrothermal carbonization method for estimation of MOL using apricot fruits. Apricot is a low-cost fruit and widely available in the local market of Egypt; it contains varying components as carbohydrates, minerals, vitamin C and dietary fiber. Thus, the apricot fruit is the most suitable green product for synthesis of (PA@CQDs). Therefore, the presented strategy was designed for green synthesis of PA@CQDs by simple facile solvent-free method. Furthermore, the prepared quantum dots have been utilized as an efficient luminescent precursor for highly selective, sensitive, and cheap estimation of MOL.3.1. Morphological characteristics of the quantum dots
The size diameter was determined using transmission electron microscope (TEM), the particle size was found to be 3 nm ± 0.52 as in Fig. 1a.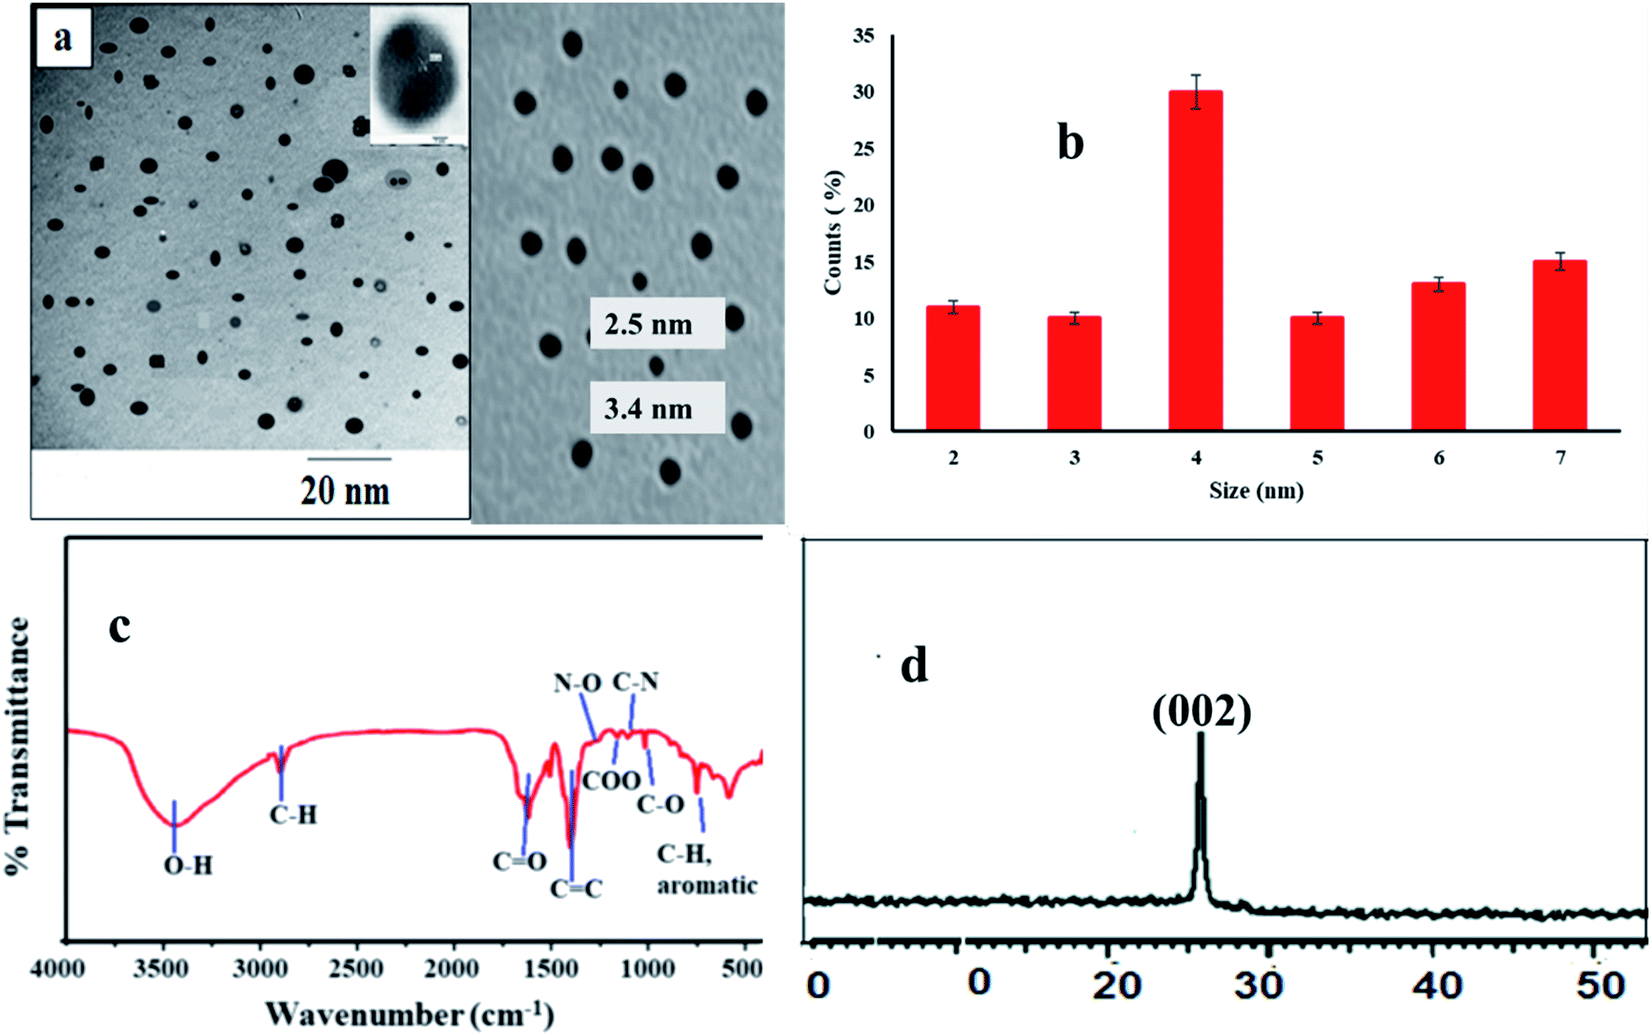 | ||
| Fig. 1 Morphological characters of PA@CQDs, (a) TEM image of carbon dots, (b) DLS image for particle size, (c) FTIR spectroscopy for examination of PA@CQDs and (d) PXRD for quantum dots. | ||
PA@CQDs average diameter was checked also using dynamic light scattering (DLS) and the size was found to be 4 nm ± 0.21 with good monodispersity 0.14 (Fig. 1b).
FTIR spectroscopy curve explains characteristic peaks appear at 3410 cm−1 and 2900 cm−1 corresponding to (–NH, –OH) and 2900 cm−1 –CH groups respectively. The peaks at 1690 and 1360 cm−1 correspond to –C![[double bond, length as m-dash]](https://www.rsc.org/images/entities/char_e001.gif) O and –COOH groups which confirms the presence of COOH on the surface of PA@CQDs. In addition, the peaks at 1556 and 1293 cm−1 refer to N–O and C–N stretching obtained from melatonin in apricot fruits19 (Fig. 1c).
O and –COOH groups which confirms the presence of COOH on the surface of PA@CQDs. In addition, the peaks at 1556 and 1293 cm−1 refer to N–O and C–N stretching obtained from melatonin in apricot fruits19 (Fig. 1c).
The powder X-ray diffraction (PXRD) image was carried out to study the formation of PA@CQDs, the peak at 25.54° is a diagnostic peak of carbon dots (Fig. 1d).
The energy dispersive X-ray spectrometer (EDX) was carried out to check the presence of C, N and O elements. The spectrum shows the presence C, N, and O elements as in Fig. 2a.
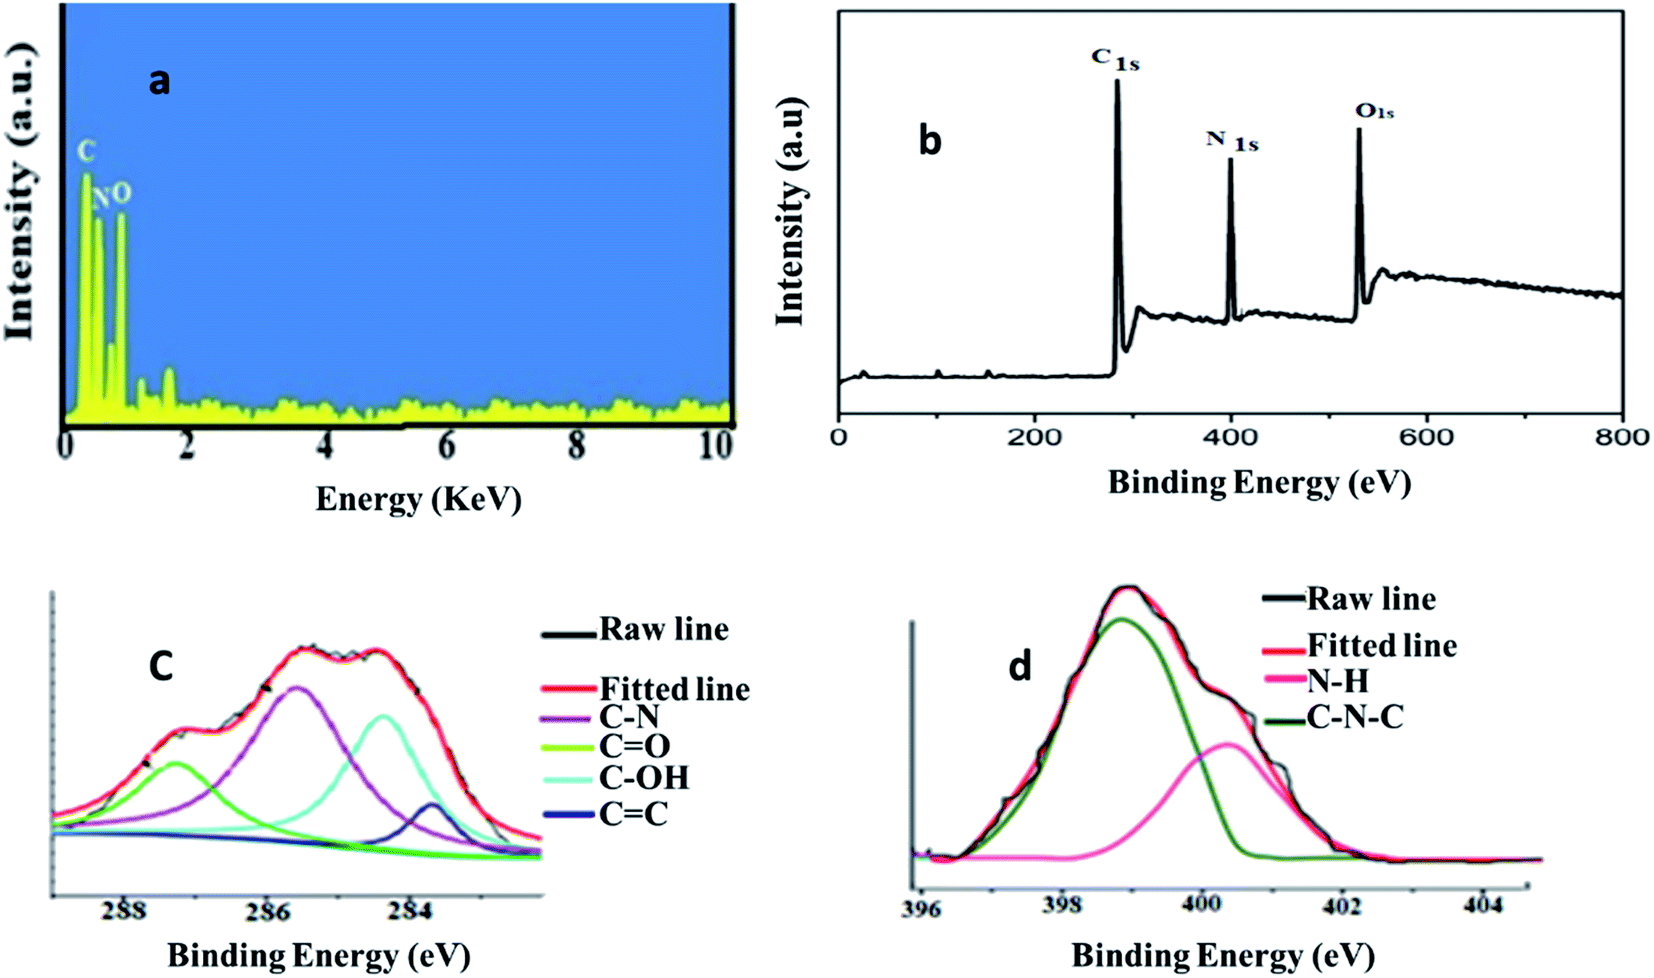 | ||
| Fig. 2 (a) EDX spectrum for element analysis of carbon dots, (b) XPS spectrum, (c) C 1s spectrum and (d) N 1s spectrum for element analysis of PA@CQDs. | ||
The elemental analysis was carried out using X-ray photoelectron spectroscopy (XPS). The XPS peaks of poly amine carbon dots were observed as three characteristic strong peaks at 285.1, 399.2, and 530.2 eV, respectively, corresponding to C 1s, N 1s, and O 1s. It signifies that C-dots are mostly made up of C (45.00%), O (33.99%), and N (21.1%) constituents (Fig. 2b).
The results refer to formation of N (21.1%) with percent higher than previously reported methods (6.88%, 9.15%)20,21 due to surface passivation of carbon dots particles. In C 1s spectrum (Fig. 2c) there are four peaks were observed at 283.5, 284.6, 285.4, and 287.5 eV, due to presence CC, C–OH, C–N, and CO groups, respectively.20,22 For O 1s spectrum has two peaks for C–OH, C–O–C and CO at 529.8 eV and 530.8 eV.†23 For N 1s spectrum, 2 peaks are observed at 399.8 eV and 401.4 eV, produced due to presence of C–N and N–H as shown in Fig. 2d.24 The results demonstrate the structure of PA@CQDs contain numerous of –NH2, which interpretate the interaction between MOL and PA@CQDs via electrostatic interaction.
3.2. Quantum yield of PA@CQDs
The quantum yield (QY) of PA@QDs was studied via single point method11 using the following equation:
Qst is (fluorescence quantum yield) for standard solution (quinin sulphate as reference),25 (I) is the fluorescence intensity, η is the refractive index and A is absorption. The quantum yield of polyamine quantum dots was found to be 37.19%.
3.3. Optical characters of PA@CQDs
PA@CQDs spectrum showed two peaks at 285 and 329 nm (Fig. 3a). These peaks were referred to π–π* electronic transition of CC and n–π* electronic transition of CO related to apricot carbon dots surface. Moreover, PA@CQDs produce emission peak λem = 504 nm (λex 440 nm), which indicate optical characters of carbon.
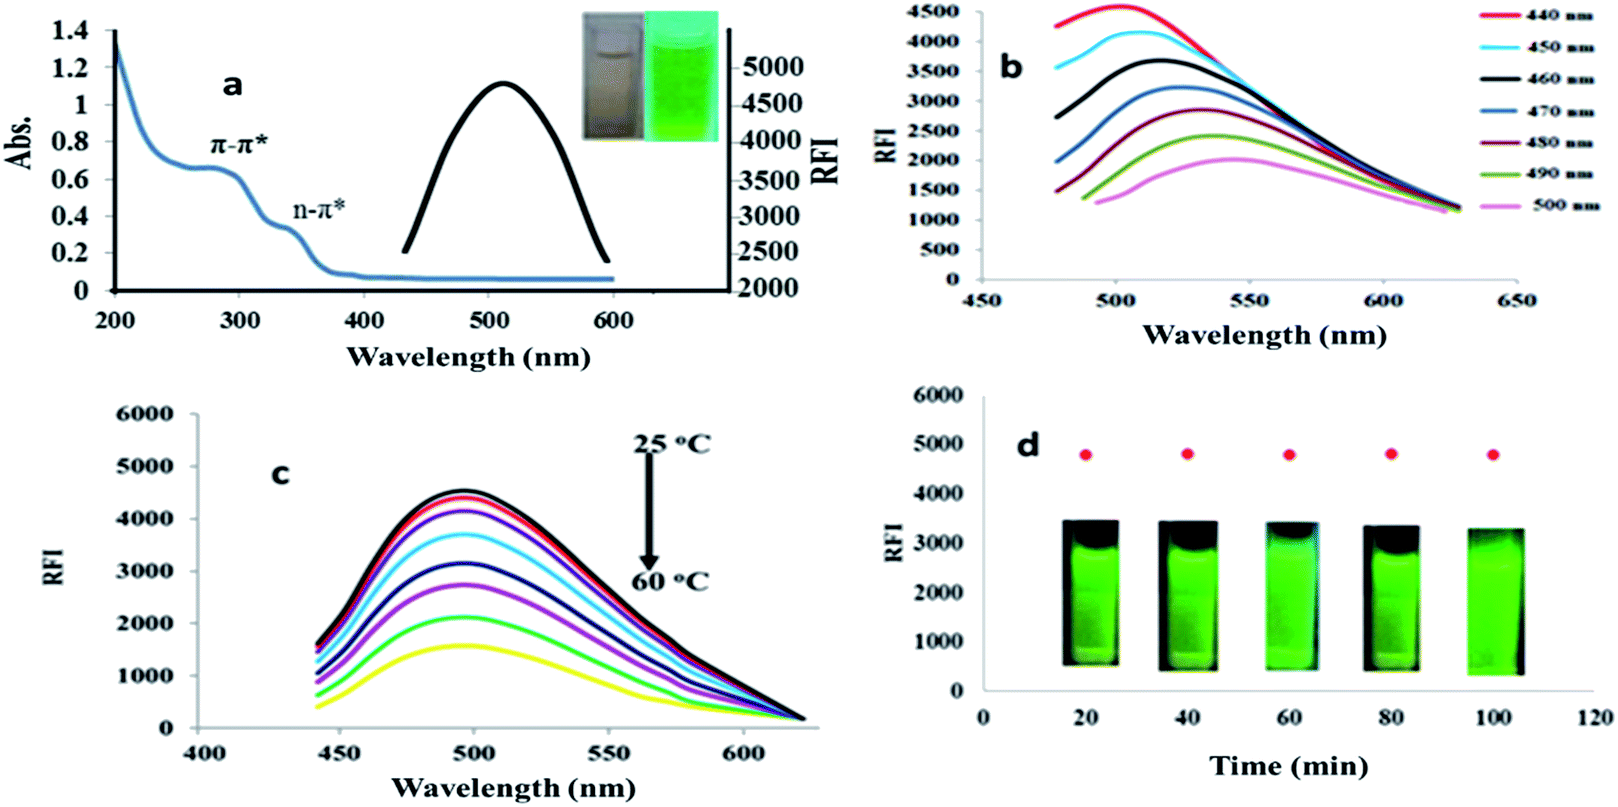 | ||
| Fig. 3 (a) Spectral characterization of PA@CQDs, (b) excitation dependent emission spectra, (c) effect of temperature on quantum dots stability, and (d) photo-stabilization of PA@CQDs. | ||
Fluorescence (FL) spectra of PA@CQ-dots were scanned with increased excitation wavelengths, increasing excitation wavelengths led to a red shift in the emission spectra of PA@CQ dots from 440 to 500 nm, which was followed by a decrease in RFI, confirming carbon dots excitation-dependent emission26 (Fig. 3b).
Moreover, the effect of temperature in the range of (25–60 °C) on relative fluorescence intensity (RFI) of PA@CQDs was studied. Increasing temperature beyond 25 °C declined the fluorescence intensity (Fig. 3c). Moreover, the photostability of quantum dots was studied by exposing PA@CQDs to UV light for different time intervals from 1 to 100 min. The particles showed high stability under UV radiation and FI was not decreased after 100 min of illumination Fig. 3d.
3.4. Optimization of the methodology
The effect of pH on RFI of PA@CQDs in presence and absence of MOL was checked. Stable quenching of carbon dots was observed in the range of pH from 6 to 7.5, rising the pH (7.5–10) led to unstable decline in RFI due to presence of varying function groups.27 So, pH 6.5 was selected as optimal point for the reaction (Fig. 4a).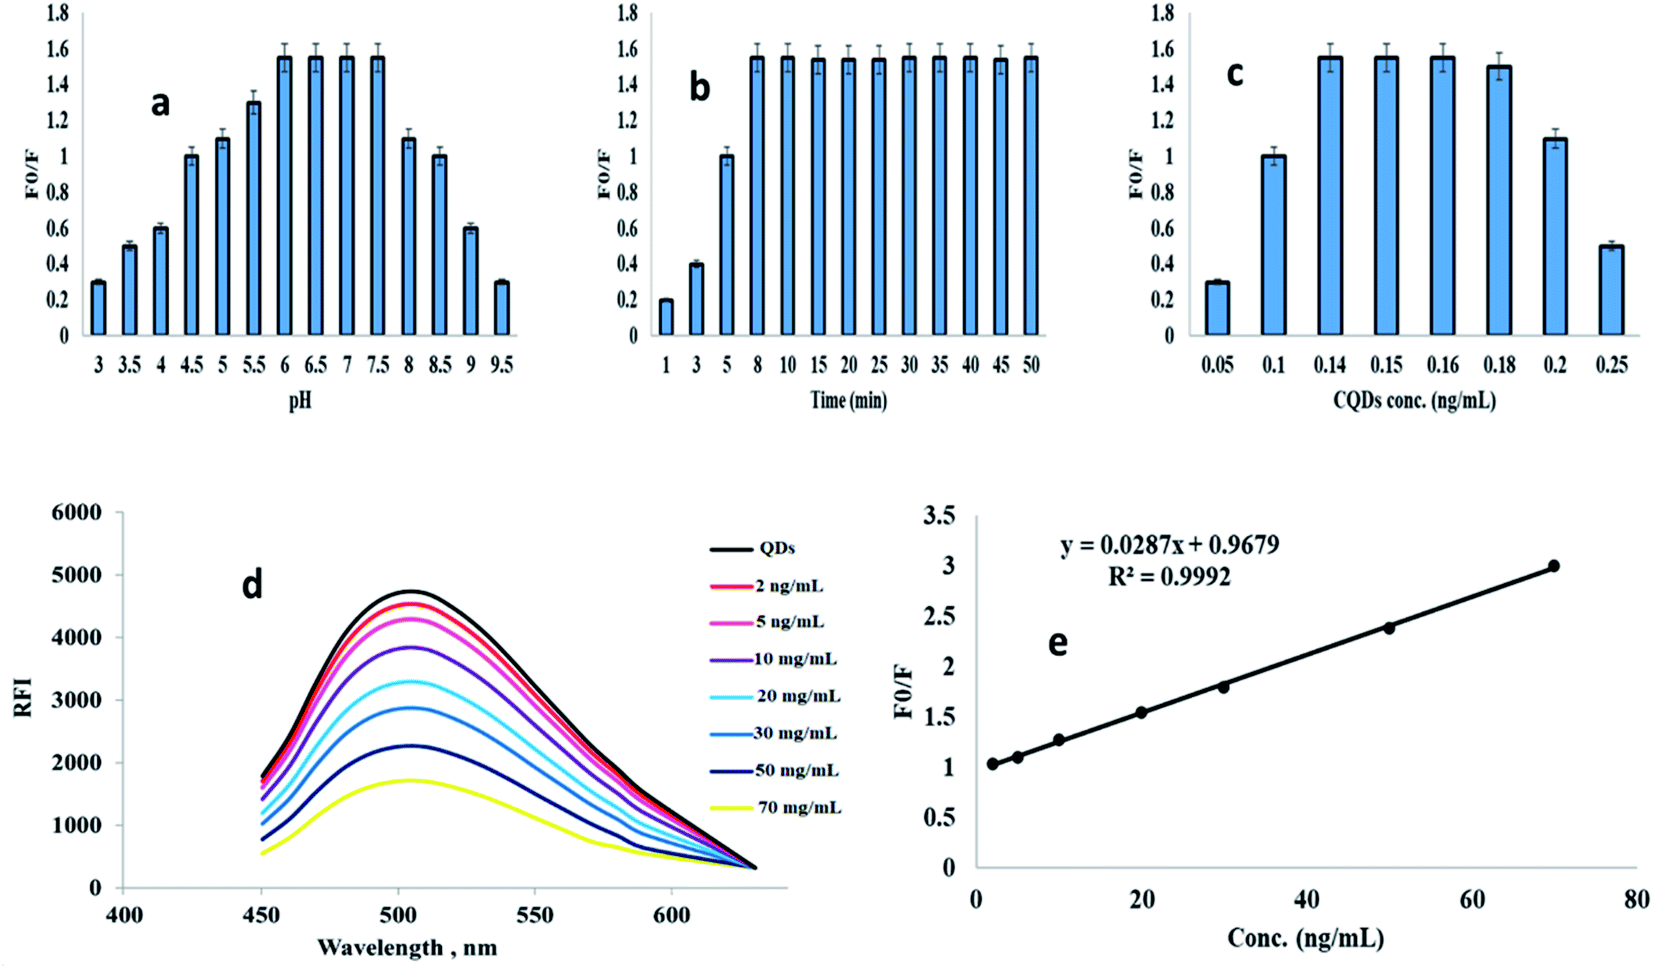 | ||
| Fig. 4 Effect of (a) pH for reaction of MOL with PA@CQDs, (b) reaction time, (c) PA@CQDs concentration, (d) quenching reaction of quantum dots with MOL, (e) Stern–Volmer curve for reaction of MOL with carbon dots. | ||
The efficacy of fluorescence quenching in the presence of MOL was investigated at different time intervals ranging from 0 to 50 minutes. Within 10 minutes, the maximal fluorescence quenching of PA@CQDs was achieved, and no further quenching was detected as the reaction time was increased (Fig. 4b).
As seen in Fig. 4c, the spectrum demonstrates effect of volume of PA@CQDs. Different concentrations of carbon dots were tested (0.05, 0.1, 0.15, 0.2 and 0.25 mg mL−1), it was found that 0.15 mg mL−1 (0.7 mL) is the most stable quenching obtained.
3.5. Reaction of MOL with PA@CQDs validation
The reaction was validated using International Conference of Harmonization (ICH) and US-FDA rules.28,29 The quenching of PA@CQDs with MOL was measured at 504 nm (excitation at 440 nm) (Fig. 4d).Using the Stern–Volmer equation, good linearity was established within the range of 2–70 ng mL−1, with a correlation coefficient of 0.9992 (Fig. 4e).
| F0/F = 1 + KSV[Q] |
The fluorescence efficiencies of the PA@CQDs in the absence and presence of the MOL, respectively, are F0 and F. Ksv is the Stern–Volmer constant while [Q] is the quencher conc.
The presented work is considered an ultra-sensitive one with lower limit of detection (LOD) value 0.58 ng mL−1 and lower limit of quantitation (LOQ) 1.78 ng mL−1 as seen in Table 1. The following formula was applied to determined LOQ and LOD based on ICH guidelines. LOQ = 10σ/slope, LOD = 3.3σ/slope, σ is standard deviation.
| Parameter | MOL |
|---|---|
| λex (nm) | 440 |
| λem (nm) | 504 |
| Concentration range (ng mL−1) | 2–70 |
| Determination coefficient (r2) | 0.9992 |
| Slope | 0.028 |
| Intercept | 0.967 |
| SD the intercept (Sa) | 0.005 |
| LOD* (ng mL−1) | 0.58 |
| LOQ** (ng mL−1) | 1.78 |
To study the accuracy of the proposed method, different concentrations of MOL (5.0, 10.0, 20.0, 50.0, and 70.0 ng mL−1) were used. As shown in Table S1,† the percent of recovery was ranged from (99.65 to 100.77%) with RSD values ranging from 0.39 to 0.96.
Furthermore, the methodology's repeatability was investigated utilizing three concentrations (20.0, 40.0, and 60.0 ng mL−1) three replicates. The RSD value was (0.20 to 1.05) as shown in Table S1,† indicating high reproducibility.
Intra-day and inter-day precision were surveyed utilizing three concentrations (20, 40 and 60 ng mL−1) and three replicates of each concentration in different laboratories with different instruments. The relative standard deviation (%RSD) values were ranged from (0.20 to 0.61%) to be very small below 2% indicating good repeatability and reliability of the analytical technique.
In addition, three concentrations were used in a bio-analytical validation investigation (5, 10, and 50.0 ng mL−1). As shown in Table S2,† the RSD value ranged from 1.50 to 1.95. The robustness of the PA@CQDs approach was tested by making minor change to the analytical procedure's parameters. It was observed there was no significant effect for small change in method variables as shown in Table S3.†
Stability of MOL in human plasma was investigated under various settings, as shown in Table S4.† The results (Table S4†) show that MOL is stable under a variety of different conditions.
Further, incurred sample reanalysis (ISR) was carried out to evaluate accuracy and precision of incurred plasma sample. The difference in the values between initial samples and incurred samples did not exceed than 3.80 to 5.11% Table S5.†
The selectivity of the proposed method was tested to check the excipient interference. MOL was tested in the presence of talc, starch, mannitol, magnesium stearate, lactose, and sodium chloride, among other excipients. The results show that there was no influence from the excipients, indicating that the suggested procedures have a high selectivity (Table S6).†
3.6. Suggested reaction mechanism
The reaction mechanism between MOL and PA@CQDs was interpretated with Stern–Volmer equation11,26 as:| F0/F = 1 + KSV[Q] |
The linearity of Stern–Volmer plot is a clear indication on the dynamic quenching mechanism. MOL interacts with the excited PA@QDs resulting in energy/electron transfer and led to quenching of the fluorescence of the quantum dots. This process is exactly described by the Stern–Volmer model (Fig. 4e).
In addition to the presence of multiple function groups in MOL structure as (Fig. S2†) OH groups allowed to formation hydrogen bonding and electrostatic attraction between MOL and polyamine carbon dots.27
3.7. Comparison method study
MOL has been recently approved as the first oral antiviral for treatment of COVID-19 viral infections. The reported method for estimation of MOL using LC-MS/MS8 has varying drawbacks as using very expensive equipment, need expensive organic solvents and special handling of the samples. However, the presented work is very cheap, economic, highly sensitive (LOD = 580 pg mL−1), selective and green method for estimation of MOL.3.8. Reusability of PA@CQDs for assay of MOL
The reusability of carbon dots was checked via estimation of MOL 10 times as seen in Fig. S3.† It was found that there was no significant change of RFI system during the recycling study, showing the good reusability of carbon dots for 10 cycles. So, good reusability of PA@CQDs suggested favored long-term use.3.9. Selectivity and lifetime stability of the PA@CQDs
The selectivity of the quantum dots reaction with MOL was studied in the presence of varying antiviral drugs as ritonavir (RIT), acyclovir (ACY), oseltamivir (OST) and favipiravir (FAV). The selectivity study of PA@CQDs was observed in Fig. 5a.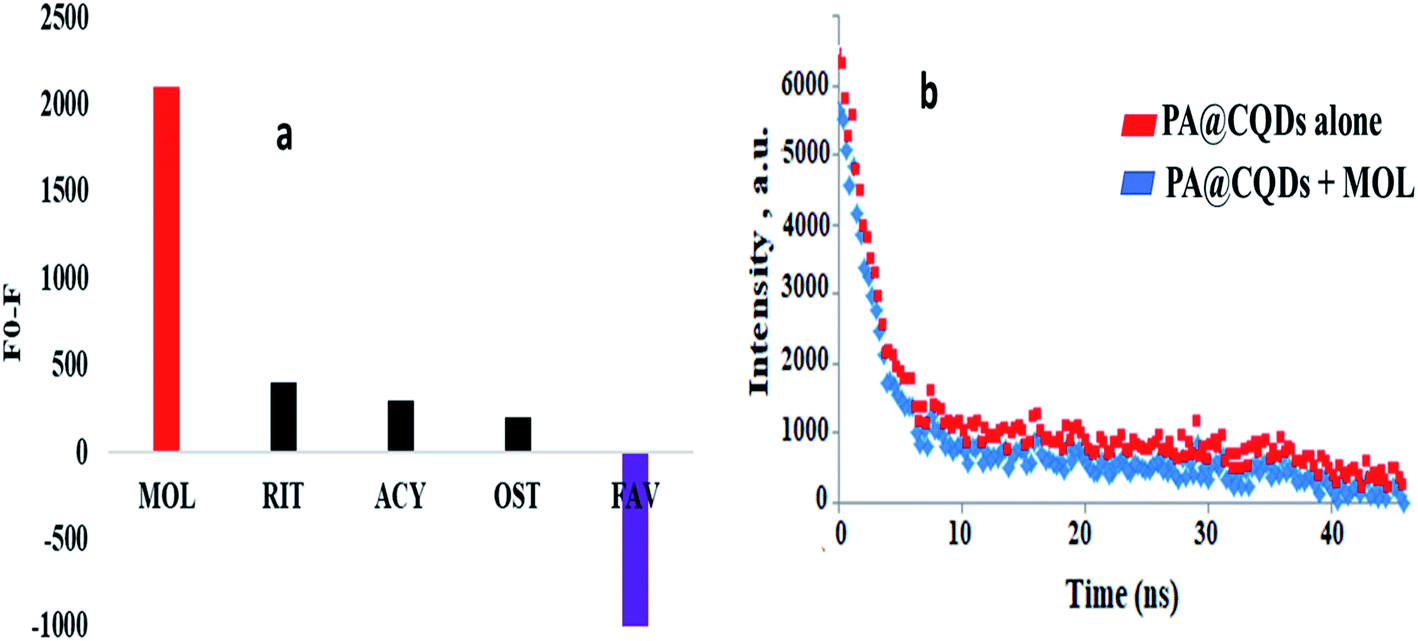 | ||
| Fig. 5 (a) Selectivity of the carbon dots with varying antiviral drugs, and (b) lifetime stability curve. | ||
It was observed no significance quenching with ritonavir (RIT), acyclovir (ACY), oseltamivir (OST) as in Fig. 5a. However, marked enhancement to PA@CQDs was observed (Fig. 5a) in presence of FAV due to presence of fluorine atoms which formed hydrogen bonding with PA@CQDs as previously reported.30 Moreover, lifetime stability was studied in presence and absence of MOL with PA@CQDs. As in Fig. 5b quenching effect of MOL was observed by decrease in the intensity of QDs.
3.10. Applications of PA@CQDs in human plasma
Owing to the high sensitivity of the proposed method, it was successfully applied for estimation of the studied drug in human plasma. MOL was determined in human plasma, where the % recovery results were found to be in the range from 96.16 ± 1.21 to 98.80 ± 0.92% using the investigated method as described in Table S7.†The pharmacokinetics of MOL has been evaluated using healthy human volunteers. The pharmacokinetic parameters were studied using a single oral dose (200 mg). The results were observed, where Cmax was found to be 920.20 ± 6.12 ng mL−1, Tmax is 1.50 ± 0.25 h. The obtained results were showed in Table 2 and were closely related to the previously reported method.31
| Time (h) | Found (ng mL−1) | Parameters | Results |
|---|---|---|---|
| 0.25 | 20.12 ± 3.55 | Cmax (ng mL−1) | 920.2 ± 6.12 |
| 0.5 | 355.93 ± 2.32 | Tmax (h) | 1.5 ± 0.25 |
| 1.0 | 920.21 ± 6.12 | t1/2 (h) | 1.30 ± 0.21 |
| 1.5 | 550.11 ± 2.21 | AUC (ng h mL−1) | 1750 ± 22.54 |
| 2.0 | 410.59 ± 1.11 | ||
| 2.5 | 380.33 ± 3.76 | ||
| 3.0 | 300.3 ± 1.60 | ||
| 3.5 | 266.84 ± 1.60 | ||
| 4.0 | 220.70 ± 1.09 | ||
| 4.5 | 160.88 ± 0.70 | ||
| 5.0 | 140.01 ± 0.79 | ||
| 5.5 | 100.60 ± 0.40 | ||
| 6.0 | 90.04 ± 0.33 | ||
| 7.0 | 80.44 ± 6.90 | ||
| 8.0 | 73.99 ± 2.44 | ||
| 9.0 | 60.43 ± 3.20 |
3.11. Content uniformity test and pharmaceutical dosage form
The PA@CQDs approach was successfully used to determine of MOL in pharmaceutical dosage form with satisfactory results and good recovery (101.44 ± 0.70). The basic approach according to USP recommendations18,32 was used to estimate the content uniformity test for MOL. Individual percentage recoveries were computed after analyzing the composition of each tablet. Table 3 shows the percentage of recovery.4. Conclusion
This study describes the first green chemistry-based synthesis of PA@CQDs as fluorescent probes for sensitive estimation of MOL in real human plasma. The produced fluorescent QDs have fluorescent quantum yield equal to 37.19%. The QDS was successfully applied for the determination of MOL in plasma samples with maximum plasma concentration equal to 920.2 ± 6.12 ng mL−1. The presented study can be easily applied in clinical laboratories and therapeutic drug monitoring system.Ethical statement
The procedure of pharmacokinetic analysis was done under compliance with ethical standards (institutional, national and with Helsinki Declaration of 1975).Conflicts of interest
There are no conflicts to declare.References
- Z. Wang and L. Yang, J. Med. Virol., 2022, 94, 1766–1767 CrossRef CAS PubMed.
- F. X. Marin-Gomez, J. M. Pena, M. A. Mayer, L. Méndez-Boo, N. Mora, E. Hermosilla, E. Coma, J. P. Vilaseca, A. Lies, M. Medina, Q. M. Catalina and J. V. Alablla, Int. J. Environ. Res. Public Health, 2022, 19, 483, DOI:10.3390/ijerph19010483.
- J. Y. Ko, M. L. Danielson, M. Town, G. Derado, K. J. Greenlund, P. D. Kirley, N. B Alden, K. Y. Hindes, E. J. Anderson, P. A. Ryan, S. Kim, R. Lynfield, S. M. Torres, G. R. Barney, N. M. Bennett, M. Sutton, H. K. Talbot, M. Hill, A. J. Hall, A. M. Fry, S. Garg and L. Kim, Clin. Infect. Dis., 2021, 72, e695–e703, DOI:10.1093/cid/ciaa1419.
- S. Cuschieri, E. Pallari, A. Hatziyianni, R. Sigurvinsdottir, I. D. Sigfusdottir and Á. K. Sigurðardóttir, Public Health, 2022, 202, 52–57, DOI:10.1016/j.puhe.2021.03.025.
- M. Imran, M. K. Arora, S. M. B. Asdaq, S. A. Khan, S. I. Alaqel, M. K. Alshammari, M. M. Alshehri, A. S. Alshrari, A. M. Ali, A. M. Al-shammeri, B. D. Alhazmi, A. A. Harshan, M. T. Alam and A. Khan, Molecules, 2021, 26, 5795, DOI:10.3390/molecules26195795.
- A. K. Singh, A. Singh, R. Singh and A. Misra, Clin. Res. Rev., 2021, 15, 102329, DOI:10.1016/j.dsx.2021.102329.
- G. R. Painter, M. G. Natchus, O. Cohen, W. Holman and W. P. Painter, Curr. Opin. Virol., 2021, 50, 17–22, DOI:10.1016/j.coviro.2021.06.003.
- A. J. Bernal, M. M. G. da Silva, D. B. Musungaie, E. Kovalchuk, A. Gonzalez, V. D. Reyes, A. M. Quirós, Y. Caraco, A. W. Diaz, M. L. Brown, J. Du, A. Pedley, C. Assaid, J. Strizki, J. A. Grobler, H. H. Shamsuddin, R. Tipping, H. Wan, A. Paschke, J. R. Butterton, M. G. Johnson and C. De Anda, N. Engl. J. Med., 2021, 386, 509–520, DOI:10.1056/nejmoa2116044.
- A. Basheer, Aircr. Eng. Aerosp. Technol., 2020, 92, 1027–1035 CrossRef.
- I. Ali, O. M. L. Alharbi, Z. A. ALothman, A. Alwarthan and A. M. Al-Mohaimeed, Int. J. Biol. Macromol., 2019, 132, 244–253, DOI:10.1016/j.ijbiomac.2019.03.211.
- M. F. B. Ali, B. I. Salman, S. A. Hussein and M. A. Marzouq, RSC Adv., 2020, 10, 44058–44065, 10.1039/d0ra07960j.
- A. M. Mahmoud, M. M. El-Wekil, M. H. Mahnashi, M. F. B. Ali and S. A. Alkahtani, Microchim. Acta, 2019, 186, 617–624, DOI:10.1007/s00604-019-3647-7.
- S. Narimani and N. Samadi, Microchem. J., 2021, 168, 106372, DOI:10.1016/j.microc.2021.106372.
- C. Zhao, X. Li, C. Cheng and Y. Yang, Microchem. J., 2019, 147, 183–190, DOI:10.1016/j.microc.2019.03.029.
- I. Ali, O. M. L. Alothman, Z. A. Alothman and A. Y. Badjah, Photochem. Photobiol., 2018, 94, 935–941, DOI:10.1111/php.12937.
- A. Amara, S. D. Penchala, L. Else, C. Hale, R. FitzGerald, L. Walker, R. Lyons, T. Fletcher and S. Khoo, J. Pharm. Biomed. Anal., 2021, 206, 114356, DOI:10.1016/j.jpba.2021.114356.
- B. I. Salman, S. A. Hussein, M. F. B. Ali and M. A. Marzouq, Microchem. J., 2019, 145, 959–965, DOI:10.1016/j.microc.2018.12.018.
- M. A. Marzouq, B. I. Salman, S. A. Hussein and M. F. B. Ali, Microchem. J., 2019, 147, 25–29, DOI:10.1016/j.microc.2019.03.002.
- U. S. Pharmacopoeial, Convention, 2017, 3, 4–6 Search PubMed.
- S. K. M. Abd El-Naby, A. A. A. Mohamed and Y. I. M. El-Naggar, Acta Sci. Pol. Hortorum Cultus;, 2019, 18, 167–174, DOI:10.24326/asphc.2019.3.16.
- H. Huang, J. J. Lv, D. Zhou, N. Bao, Y. Xu, A. Wang and J. J. Feng, RSC Adv., 2013, 3, 21691–21696, 10.1039/c3ra43452d.
- W. Wang, Y. C. Lu, H. Huang, J. J. Feng, J. R. Chen and A. J. Wang, Analyst, 2014, 139, 1692–1696, 10.1039/c3an02098c.
- V. K. Jothi, K. Ganesan, A. Natarajan and A. Rajaram, J. Fluoresc., 2021, 31, 427–436, DOI:10.1007/s10895-020-02652-6.
- S. Ghosh, A. R. Gul, C. Y. Park, P. Xu, S. H. Baek, J. R. Bhamore, M. W. Kim, M. Lee, S. K. Kailasa and T. J. Park, Microchem. J., 2021, 167, 106272, DOI:10.1016/j.microc.2021.106272.
- U. Latief, S. Islam, Z. M. S. H. Khan and M. S. Khan, Spectrochim. Acta, Part A, 2021, 262, 120132, DOI:10.1016/j.saa.2021.120132.
- D. Wu, X. Huang, X. Deng, K. Wang and Q. Liu, Anal. Methods, 2013, 5, 3023–3027 RSC.
- H. R. H. Ali, A. I. Hassan, Y. F. Hassan and M. M. El-Wekil, Anal. Bioanal. Chem., 2020, 412, 1353–1363, DOI:10.1007/s00216-019-02362-4.
- International Conference on Harmonization, Topic Q2 (R1) Validation of Analytical Procedures: Text and Methodology, 2005 Search PubMed.
- D. Zimmer, Bioanalysis, 2014, 6, 13–19, DOI:10.4155/bio.13.298.
- J. Hua, Y. Jiao, M. Wang and Y. Yang, Microchim. Acta, 2018, 185, 137, DOI:10.1007/s00604-018-2685-x.
- W. P. Painter, W. Holman, J. A. Bush, F. Almazedi, H. Malik, N. C. J. E. Eraut, M. J. Morin, L. J. Szewczy and G. R. Painter, Antimicrob. Agents Chemother., 2021, 65, 1–14 Search PubMed.
- M. A. Hammad, M. A. Omar, B. I. Salman and S. M. Derayea, Spectrochim. Acta, Part A, 2016, 157, 55–60, DOI:10.1016/j.saa.2015.12.012.
Footnote |
| † Electronic supplementary information (ESI) available. See https://doi.org/10.1039/d2ra02241a |
| This journal is © The Royal Society of Chemistry 2022 |