 Open Access Article
Graphitic carbon nitride and APTES modified advanced electrochemical biosensor for detection of 17β-estradiol in spiked food samples
M. S. Bacchuab,
M. R. Aliab,
M. N. Hasanab,
M. R. A. Mamunab,
M. I. Hossain ab and
M. Z. H. Khan
 *ab
*ab
aDept. of Chemical Engineering, Jashore University of Science and Technology, Jashore 7408, Bangladesh. E-mail: zaved.khan@yahoo.com
bLaboratory of Nano-bio and Advanced Materials Engineering (NAME), Jashore University of Science and Technology, Jashore 7408, Bangladesh
First published on 6th June 2022
Abstract
This work demonstrates a simple and inexpensive electrochemical biosensing pathway for selective and sensitive recognition of 17β-estradiol (E2) in environmental and food samples. The biosensing system is based on graphitic carbon nitride (g-C3N4) and a conductive polymer 3-aminopropyltriethoxysilane (APTES). The proposed biosensor shows the ability to detect E2 in attomolar levels within a wide linear logarithm concentration range of 1 × 10⁻⁶ to 1 × 10⁻¹⁸ mol L−1 with a limit of detection (LOD) of 9.9 × 10⁻¹⁹ mol L−1. The selectivity of the developed biosensor was confirmed by conducting the DPV of similarly structured hormones and naturally occurring substances. The proposed biosensor is highly stable and applicable to detect E2 in the presence of spiked food and environmental samples with satisfactory recoveries ranging from 95.1 to 104.8%. So, the designed electrochemical biosensor might be an effective alternative tool for the detection of E2 and other endogenous substances to attain food safety.
1 Introduction
In recent years, food concern has been raised due to various environmental polluted endocrine-disrupting chemicals (EDCs). EDCs have the potential to create an environmental hazard by jeopardizing the ecological balance.1 The primary female sex hormone 17β-estradiol (E2) has played a vital role in the enrichment of EDCs. E2 is the smallest natural estrogen steroid hormone which is very important for the development and regulation of the female reproductive tissues such as the thorax, uterus, intestinal motility, and vagina during puberty, adulthood, and majority of pregnancy.2,3 Naturally occurring conjugates of estrogens have become a new problem in the food industry owing to the environmental disrupting physiological effects of the hormones.4 Among these natural environmental estrogens, E2 is substantially more potential than prime metabolites estriol (E3) and estrone (E1). E2 is used widely in the feed processing industry illegally to promote animal growth activity, milk yield, the ratio of fatty meat of cattle and poultry.1,5,6 Although E2 does some crucial works in the female body, E2 carries several adverse effects such as a tumor, breast cancer, endocrine disorder, abnormal cell growth, etc. when it enters the human body due to food chain contamination.7 In particular, the high activity of E2, even at a very low concentration thus can be toxic and carcinogenic.8,9 Therefore, quantitative, reliable, sensitive, real-time, inexpensive, and rapid detecting tools for E2 are vitally important in the fields of food safety and health protection.Nowadays, a large number of advanced techniques has been developed for the quantification of E2 in food and environmental fields, such as enzyme-linked immunosorbent assay (ELISA),10 high-performance liquid chromatography (HPLC),11,12 UV-vis spectrophotometry,2 capillary electrophoresis,13 Gas Chromatography-Mass Spectrometry (GCMS).14 In practical application, these methods contain some drawbacks such as time-consuming, highly expensive, unsatisfactory detection limit and sensitivity, complex pre-treatment process, and requirement of trained operators.15,16 To overcome these obstacles, electrochemical biosensing system are highly recommended by many researcher group in recent years.
Moreover, in recent years the electrochemical biosensor is one of the promising methods which become popular due to fast response, inexpensive, easy to perform, and real-time detection, etc.16,17 Nano-particle and conductive polymer are widely used in electrochemical biosensing platform to enhance selectivity, sensitivity, bio-compactability, and active sensing surface area, etc.18 Graphitic carbon nitride (g-C3N4) is nitrogen and carbon rich polymeric semiconductor offers some special properties such as medium band gab (2.7 eV), low toxicity, easy preparation, larger surface area, and high electrocatalytic properties etc.19,20 The g-C3N4 is widely used in fabrication of electrochemical biosensor to detect biomolecules and boost the electrochemical performance of the biosensor.21 In literature, Yola et al., for very first time developed an molecular imprinted sensor based on g-C3N4 for determination of melamine in food sample.22 Recently, Silva et al., represents g-C3N4 nanosheet based electrochemical sensor for monitoring hydroxychloroquine sulfate in urine and pharmaceutical formulation sample.21 The pioneeror group reported g-C3N4 increase the surface conductivity of electrode and recognition ability of designed biosensor. APTES is a conductive polymer is widely used in different biosensing platform to enhance electrocatalytic properties of biosensor.23,24
In this work, we have reported g-C3N4 and APTES modified electrochemical biosensor for selective recognition of E2. Different surface topographical analysis such as ATR-FTIR, SEM were carried out to confirm interaction between APTES and g-C3N4. The voltametric behaviours of the developed biosensor were investigated through CV, DPV, and EIS. The biosensor is capable to detect E2 at the attomolar level in food and environmental sample.
2 Experiment
2.1 Apparatus
An electrochemical workstation Corrtest CS300 (China) was used to conduct all voltammetric measurements. Electrochemical impedance spectroscopy (EIS) data were obtained from a Metrohm DropSens μStat-i 400s (Switzerland). A conventional three-electrode system was used to conduct all measurements which consist of a different modified screen-printed electrode (SPE) (3 mm in diameter) as the working electrode, platinum wire as the auxiliary electrode, Ag/AgCl as the reference electrode. The surface topography of different modified electrodes materials was investigated by using ZEISS Gemini SEM 500 (UK) and NICOLET iS20 Attenuated total reflectance-Fourier transform infrared (ATR-FTIR) spectroscopy (Germany). All voltammetric experiments were executed at room temperature at N2 atmosphere.2.2 Chemicals and reagents
17β-Estradiol (E2) and 3-aminopropyltriethoxysilane (APTES) were obtained from Aladdin Biochemical Technology Co. Ltd (China). Thiourea (CH4N2S), trichloroacetic acid, potassium ferrocyanide (K4[Fe(CN)6]), potassium ferricyanide (K3[Fe(CN)6]), potassium chloride (KCl), and other reagents were parched from Merck (India). For electrochemical measurement, a supporting electrolytic solution was used for all electrochemical measurement purposes which were made of 5 × 10⁻³ mol L−1 (K4[Fe(CN)6]), (K3[Fe(CN)6]) and 0.1 mol L−1 KCl. Food samples of water, milk, and poultry meat were purchased from a local market. Ultrapure water (Type I) produced from Evoqua was used to prepare all working solutions (Germany, resistivity < 18 MΩ).2.3 Synthesis of graphitic carbon nitride (g-C3N4)
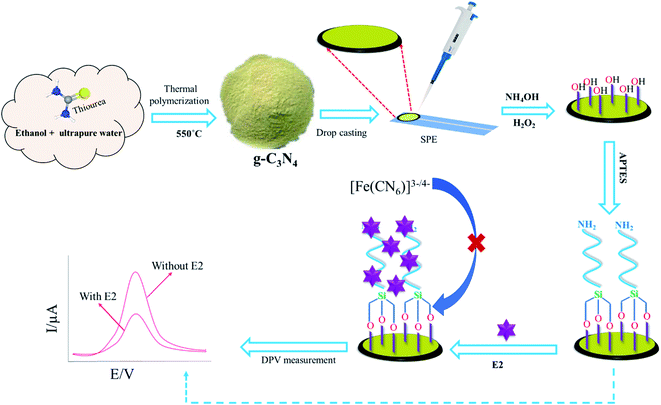
The graphitic carbon nitride (g-C3N4) was typically synthesized using the solvent assist method25 with minor modification. In short, 12 g of thiourea was dissolved in 30 mL of absolute ethanol in a semi-closed crucible. The solution was directly calcined in a muffle furnace at 550 °C for 2 h at a heating rate of 5 °C min−1 and then naturally cooled to room temperature. The obtained powder was collected for further use.2.4 Fabrication of APTES/g-C3N4/SPE
The screen-printed electrode (SPE) surface was washed ultrapure water and dried at room temperature under nitrogen (N2) gas. After that, a 10 μL aliquot of 1 mg mL−1 prepared g-C3N4 suspension was drop-casted onto the working electrode of the SPE-activated surface, and then dried at N2 gas. Eventually, we eagerly followed a similar method for APTES modification, which was reported previously work.23 In short, the working electrode was rinsed thoroughly with ultrapure water and immersed in a solution of H2O/NH4OH/H2O2 (5![[thin space (1/6-em)]](https://www.rsc.org/images/entities/char_2009.gif) :
:![[thin space (1/6-em)]](https://www.rsc.org/images/entities/char_2009.gif) 1
1![[thin space (1/6-em)]](https://www.rsc.org/images/entities/char_2009.gif) :
:![[thin space (1/6-em)]](https://www.rsc.org/images/entities/char_2009.gif) 1) for 30 min, and then dried at 60 °C to hydroxylate active g-C3N4/SPE surface. Subsequently, the electrode was further rinsed with ultrapure water and also immersed in APTES with 2% ethanol solution for 60 min, and also dried at 70 °C. Finally, the electrodes were carefully rinsed ultrapure water, and then dried at room temperature. Then modified electrode (APTES/g-C3N4/SPE) was stored at 4 °C for further used.
1) for 30 min, and then dried at 60 °C to hydroxylate active g-C3N4/SPE surface. Subsequently, the electrode was further rinsed with ultrapure water and also immersed in APTES with 2% ethanol solution for 60 min, and also dried at 70 °C. Finally, the electrodes were carefully rinsed ultrapure water, and then dried at room temperature. Then modified electrode (APTES/g-C3N4/SPE) was stored at 4 °C for further used.
2.5 Electrochemical measurement techniques
The electrochemical behavior was measured using different modified electrodes in the probe solution which was carried out in 0.1 M KCl containing 5 mM [Fe(CN)6]3−/4− solution at a potential range from −0.2 V to +0.6 V with a scan rate of 50 mV and pulse period of 0.1 s. The difference of the DPV response was determined by subtracting the oxidation peak potential of [Fe(CN)6]3−/4− with and without binding E2. Electrochemical impedance spectroscopy (EIS) was conducted in the same solution containing a frequency range of 0.1 Hz to 100![[thin space (1/6-em)]](https://www.rsc.org/images/entities/char_2009.gif) 000 Hz and an amplitude of 10 mV. Scheme 1 depicts step by step procedure for fabrication of the biosensor and detection of E2.
000 Hz and an amplitude of 10 mV. Scheme 1 depicts step by step procedure for fabrication of the biosensor and detection of E2.
2.6 Pre-treatment of real samples
The preparation of a real sample was described in our previous work.26 In short, 2 g of milk, water, and poultry meat sample was taken into a polypropylene tube with 10 ml trichloroacetic acid (10% w/v) and vertexed for 2 min. The supernatant was separated by Whatman filter paper to obtain a fresh solution after centrifuging for 15 min at 5000 rpm respectively. These solutions were diluted 100 times with 5 × 10⁻³ mol L−1 [Fe(CN)6]3−/4− at a pH of 7.0 for further application.3 Result and discussion
3.1 Surface topography of the modified biosensor
The surface topography of different modified electrodes were investigated through SEM, ATR-FTIR which is shown in (Fig. 1). Fig. 1A shows the SEM image of g-C3N4/SPE which confirmed a sheet like g-C3N4 successfully incorporate on the surface of SPE. Fig. 1B shows the SEM image of APTES on the surface of g-C3N4/SPE. EDX of g-C3N4 with percentage of different element present in g-C3N4 is shown in Fig. 1C. The functional group analysis of g-C3N4, g-C3N4/APTES, g-C3N4/APTES/E2 were conducted through FTIR (Fig. 1D). The FTIR spectra of g-C3N4 shows a series of intense band at 1410, 1570, 1641 cm−1 for C–N stretching vibration which confirmed successful synthesis of g-C3N4. The bands at 1320 and 1240 cm−1 were assigned to C–NH–C stretching vibration. The presence of s-triazine unit in out-of-plane of g-C3N4 was confirmed by a sharp peak at 806 cm−1.27,28 After conjugation of APTES with g-C3N4, the intensity of s-triazine ring got weaker after conjugation of APTES suggesting APTES successfully bind with g-C3N4 by intermolecular interaction. Other peaks were found at 1580 cm−1 for N–H, 1290 and 765 cm−1 for Si–C, and 1165 and 765 cm−1 for Si–O–C which confirmed presence of APTES on the surface of g-C3N4.28 The FTIR analysis of g-C3N4/APTES/E2 shows some similarity in peak intensity and shifting which indicates E2 interact with g-C3N4/APTES. Some intense peak was found at 3449, 1342 and 1230 cm−1 for –OH, C–O and –CH2 due to addition of E2.29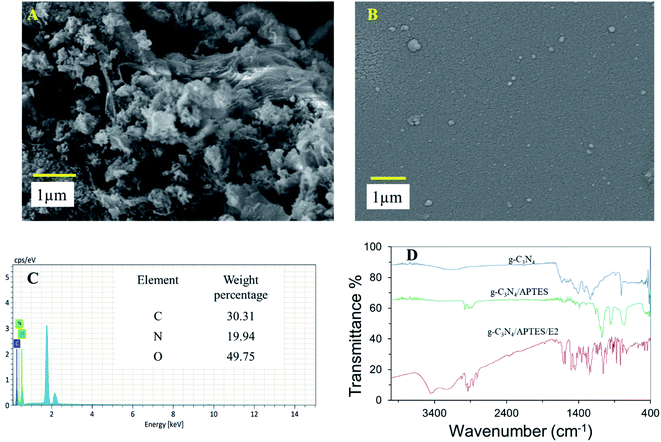 | ||
| Fig. 1 SEM image of g-C3N4/SPE (A), g-C3N4/APTES/SPE (B); EDX analysis of g-C3N4/SPE (C) and FTIR spectra of g-C3N4, g-C3N4/APTES, g-C3N4/APTES/E2 (D). | ||
3.2 Electrochemical behavior of modified electrodes
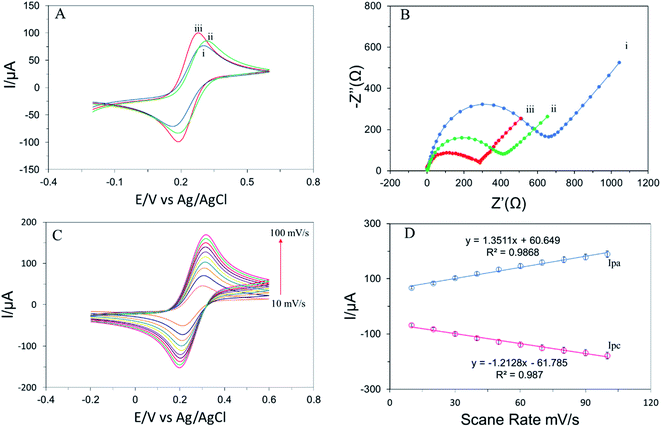
To assess the electrochemical properties of different modified electrodes, cyclic voltammetry (CV) and electrochemical impedance spectroscopy (EIS) were carried out. Fig. 2A represents the cyclic voltammogram of the different modified electrodes in the supporting electrolyte at a scan rate of 50 mV s−1 in a potential range of −0.2 V to 0.6 V. To compare the electron transfer kinetics of different modified electrodes, the difference between oxidation and reduction peak potential (ΔEp = Epc − Epa) was calculated. Fig. 2A depicts the bare SPE exhibited ΔEp value of 130 mV suggesting a poor electron transfer rate.30 Surprisingly, the ΔEp value was significantly decreased (108 mV) after drop-casting g-C3N4 on the surface of SPE which indicates the electron transfer kinetics become higher due to enhancement of conductivity and active surface.31 The conductive polymer attached with g-C3N4 and decreased the value of ΔEp (66 mV) by enhancing electron transfer efficiency.24 The behavior of the proposed biosensor was also proved by EIS measurement in the supporting redox probe at a frequency ranging from 0.1 to 105 Hz with an amplitude of 10 mV. Fig. 2B shows the Nyquist plot of different modified electrodes which compare the semi-circles portion lying on the axis. A higher semi-circle exhibits higher electron transfer resistance (Rct) due to the long charge transfer process.3 The Rct of g-C3N4/SPE is smaller than bare SPE that indicates g-C3N4 creates several active sites for electron transfer and enhances the conductivity of the modified electrode. Dramatically, the Rct value of APTES/g-C3N4/SPE was significantly decreased after attaching the conductive polymer to the surface of g-C3N4/SPE.The effect of scan rate on the peak current of APTES/g-C3N4/SPE was confirmed by a series of CVs analyses of the supporting electrolyte at different scan rates of 10, 20, 30, 40, 50, 60, 70, 80, 90, 100 mV s−1 in the potential range of −0.2 V to 0.6 V which is shown in Fig. 2C and D. The results of the experiment show excellent linearity between the scan rate and oxidation (Ipa), and reduction (Ipc) peak current with satisfactory correlation coefficient (R2) suggesting a mass transfer phenomena belonging to adsorption control process on the interface of APTES/g-C3N4/SPE and solution.32
3.3 Optimization of experimental condition
To achieve the better performance of the proposed electrochemical biosensor, several parameters such as pH, amount of g-C3N4 used for drop-casting were optimized. To optimize the pH for detection of E2, a series of DPV of 1 × 10⁻⁷ mol L−1 E2 in supporting electrolyte at different pH ranging 5.5 to 8.5. Fig. 3A shows the pH-dependent peak current deviation behavior of E2 (after and before adding E2). The highest peak current deviation was found at pH 7.0 indicating the highest amount of electron transfer occurred at neutral conditions. Fig. 3B represents the relationship between peak current deviation (after and before adding E2) and volume of g-C3N4 drop cast on the electrode surface. The current deviation value of E2 was rose consecutively by adding g-C3N4(0 to 10 μl) and become the highest for 10 μl drop-casting. Surprisingly, the peak deviation was fall for adding g-C3N4 furthermore due to the higher amount of g-C3N4 cover electrode surface and reduce electron transfer rate.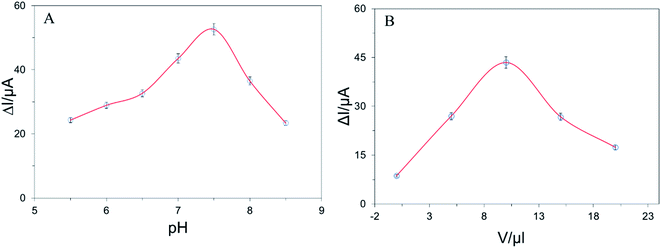 | ||
| Fig. 3 (A) The effect of pH and (B) the volume of g-C3N4 used on current response performed with 1.0 × 10⁻⁹ mol L−1 E2. | ||
3.4 Analytical performance of the modified biosensor
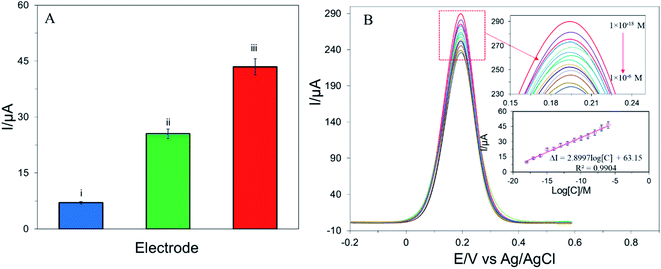
The analytical performance of different modified electrodes was measured by recording the DPV of E2 in the supporting electrolyte. Fig. 4A depicts the current deviation (ΔI) of the different modified electrodes which was calculated from the oxidation peak current deviation of supporting electrolyte in the presence and absence of E2. APTES/g-C3N4/SPE shows a higher peak current deviation than g-C3N4/SPE and bare SPE. Fig. 4B represents the concentration-dependent DPV response of E2 which reveals the peak current decreased with increasing the concentration of E2 suggesting the active sites of APTES/g-C3N4/SPE were almost occupied by E2.15 The calibration curve in Fig. 4B expresses a linear relationship between ΔI and logarithm concentration of E2 in the range of 1 × 10⁻⁶ to 1 × 10⁻¹⁸ mol L−1 with an R2 value of 0.9904. The limit of detection (LOD) was calculated as 9.9 × 10⁻¹⁹ mol L−1 from the signal–noise ratio (S/N = 3). Table 1 represents a comparison of LOD, wide range of linearity, and method adopted to detect E2 with some previously reported biosensors for detection of E2.3,8,15,16,33–38| Electrode type | Electrochemical method | Dynamic range (mol L−1) | LOD (mol L−1) | Ref. |
|---|---|---|---|---|
| a MWCNTs – multi wall carbon nanotubes, MIS – molecularly imprinted sensor, MIPs – molecularly imprinted polymers, FNCP – functionalised nanoporous conducting polymer, CuTthP: Cu(II)-meso-tetra(thien-2-yl)porphyrin, MIL-53 (AlO Hbdc, bdc = benzene-1,4-dicarboxylate). | ||||
| Pt/MWNTs/GCE | CV | 1.8 × 10⁻¹² to 5.5 × 10⁻¹¹ | 6.6 × 10⁻¹³ | 33 |
| MIS/PtNPs/GCE | DPV | 3.0 × 10⁻⁸ to 5.0 × 10⁻⁵ | 1.6 × 10⁻⁸ | 34 |
| MIPs/AuNPs/GCE | EIS | 1.0 × 10⁻¹² to 1.0 × 10⁻⁷ | 1.8 × 10⁻¹² | 15 |
| Aptamer/FNCP/GCE | EIS | 1.0 × 10⁻¹⁵ to 1.0 × 10⁻⁶ | 1.0 × 10⁻¹⁵ | 35 |
| GC/RGO/CuTthP | DPV | 1.0 × 10⁻⁷ to 1.0 × 10⁻⁶ | 5.3 × 10⁻⁹ | 37 |
| Fe3O4/MIP/SPCE | SWV | 5.0 × 10⁻⁸ to 1.0 × 10⁻⁵ | 2.0 × 10⁻⁸ | 8 |
| Poly(3,6-diamino-9-ethylcarbazole)/MIP/GCE | EIS | 1.0 × 10⁻¹⁸ to 1.0 × 10⁻⁵ | 3.6 × 10⁻¹⁸ | 3 |
| MIP/MIL-53/CNTs/GCE | DPV | 1.0 × 10⁻¹⁴ to 1.0 × 10⁻⁹ | 6.9 × 10⁻¹⁹ | 36 |
| Nanowell-based MIPs | EIS | 1.0 × 10⁻¹² to 1.0 × 10⁻⁵ | 1.0 × 10⁻¹³ | 1 |
| g-C3N4/APTES/SPE | DPV | 1.0 × 10⁻⁶ to 1.0 × 10⁻¹⁸ | 9.9 × 10⁻¹⁹ | This work |
3.5 Selectivity, reproducibility, and stability of electrochemical biosensor
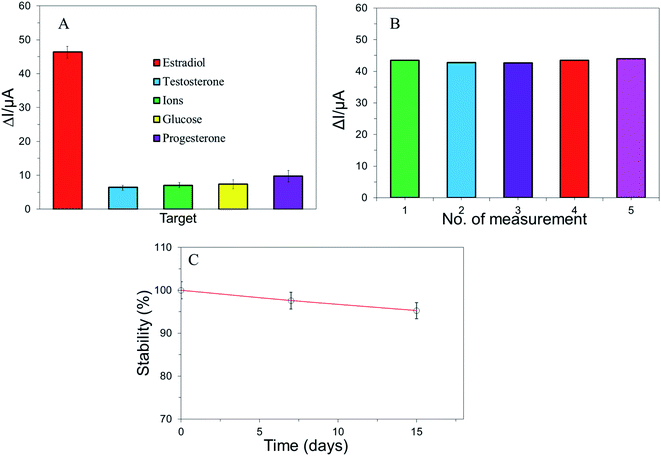
The selectivity, reproducibility, and stability of a biosensor is the most important parameters to evaluate the practical application of the biosensor. The selectivity of the electrochemical biosensor was investigated by using the DPV current responses in the presence of similar structural compounds such as testosterone, progesterone, and naturally occurring substances such as some ions (Na+, K+, Ca2+, Mg2+, Fe2+, Fe3+, Al3+, NO3−, SO42−, Cl−), glucose. Fig. 5A shows that the current responses ΔI of E2 was higher than others at same concentration (1 × 10⁻⁶ mol L−1) by using the same electrode in the supporting electrolytic solution. This result evaluated that the electrochemical biosensor was good selectivity to recognize E2 molecules.In practical application, reproducibility can play an important role for the APTES/g-C3N4/SPE based on the electrochemical biosensor. In this study, inter-assay and intra assay reproducibility was analysed according to standard methodology. To evaluate the intra-assay reproducibility and repeatability of electrochemical biosensor, the peak response of E2 in the supporting electrolyte was investigated by using 1 × 10⁻⁷ mol L−1. After conducting five repetitive DPV response of same modified electrodes, the relative standard deviation was calculated as 1.18% which was shown in Fig. 5B. The inter-assay reproducibility was explored by conducting similar operation in E2 of different concentration. For a relative standard deviation (1.5%) was found which is reliable for biosensing application. The results of the experiment proved that the reproducibility of this sensor was satisfactory. Furthermore, the DPV response of E2 was obtained 97.6% and 95.24% after one- and two-weeks storage, respectively (Fig. 5C) while stored at 4 °C which indicates the biosensor is highly stable.
3.6 Application of electrochemical biosensor in real food sample analysis
To access the practical application of the modified electrochemical biosensor, the biosensor was used to detect E2 in the spiked milk, meat and water sample via standard addition methods. DPV of 1 × 10⁻⁶ mol L−1, 1 × 10⁻¹⁰ mol L−1 and 1 × 10⁻¹⁶ mol L−1 E2 was carried out in the presence of as prepared spiked real sample. The biosensor exhibits excellent recoveries ranging from 95.1% to 104.8% which is shown in Table 2. In addition, these results proved that the proposed biosensor shows high efficiency to detect E2 in food and environmental samples.| Sample type | Added (mol L−1) | Found (mol L−1) (mean ± SD) | Recovery (%) |
|---|---|---|---|
| Milk | 1.0 × 10⁻⁶ | 1.048 ± 0.008 ×10⁻⁶ | 104.8 |
| 1.0 × 10⁻¹⁰ | 1.021 ± 0.004 ×10⁻¹⁰ | 102.1 | |
| 1.0 × 10⁻¹⁶ | 0.951 ± 0.008 ×10⁻¹⁶ | 95.1 | |
| Meat (poultry) | 1.0 × 10⁻⁶ | 0.968 ± 0.002 ×10⁻⁶ | 99.8 |
| 1.0 × 10⁻¹⁰ | 1.030 ± 0.002 ×10⁻¹⁰ | 103.0 | |
| 1.0 × 10⁻¹⁶ | 1.012 ± 0.002 ×10⁻⁶ | 101.2 | |
| Water | 1.0 × 10⁻⁶ | 0.998 ± 0.007 ×10⁻⁶ | 96.8 |
| 1.0 × 10⁻¹⁰ | 0.985 ± 0.005 ×10⁻¹⁰ | 98.5 | |
| 1.0 × 10⁻¹⁶ | 0.963 ± 0.002 ×10⁻¹⁶ | 96.3 |
4 Conclusion
Conventional methods for screening E2 in food and environmental samples suffer from some drawbacks such as lack of selectivity, lack of sensitivity, time-consuming experimental procedure, expensive, and required trained operator. To overcome the arising problems, an advance electrochemical biosensor was developed to monitor E2 in environmental and food sample. The electrochemical biosensor is based on g-C3N4 and APTES modified SPE and used to identify E2 attomolar level with high selectivity and stability. The biosensor exhibits wide range of linearity from 1 × 10⁻⁶ to 1 × 10⁻¹⁸ mol L−1. The biosensor was successfully applied to detect E2 in spiked milk, meat and water samples with excellent recoveries. So, the developed biosensor can detect E2 at the lowest limit with excellent selectivity, stability and sensitivity compare to the previously reported biosensor for detection E2. Thus, the design biosensor will be an effective tool for monitoring food quality and detecting of E2 in foodstuff and environmental contaminates.Conflicts of interest
The authors declare that there is no conflict of interest in this work.Acknowledgements
The work has been done with the financial support from the Ministry of Information and Communication Technology, Government of Bangladesh (Innovation Fund).References
- H. Pu, Z. Huang, D. W. Sun and H. Fu, Crit. Rev. Food Sci. Nutr., 2019, 59, 2144–2157 CrossRef CAS PubMed.
- B. Yilmaz and Y. Kadioglu, Arabian J. Chem., 2017, 10, S1422–S1428 CrossRef CAS.
- W. Liu, H. Li, S. Yu, J. Zhang, W. Zheng, L. Niu and G. Li, Biosens. Bioelectron., 2018, 104, 79–86 CrossRef CAS PubMed.
- W. Zhu, H. Peng, M. Luo, N. Yu, H. Xiong, R. Wang and Y. Li, Food Chem., 2018, 261, 87–95 CrossRef CAS PubMed.
- M. Pezzolato, C. Maurella, K. Varello, D. Meloni, C. Bellino, L. Borlatto, D. Di Corcia, P. Capra, M. Caramelli and E. Bozzetta, Food Control, 2011, 22, 1668–1673 CrossRef CAS.
- X. Du, L. Dai, D. Jiang, H. Li, N. Hao, T. You, H. Mao and K. Wang, Biosens. Bioelectron., 2017, 91, 706–713 CrossRef CAS PubMed.
- X. Yao, Z. Wang, L. Dou, B. Zhao, Y. He, J. Wang, J. Sun, T. Li and D. Zhang, Sens. Actuators, B, 2019, 289, 48–55 CrossRef CAS.
- A. A. Lahcen, A. A. Baleg, P. Baker, E. Iwuoha and A. Amine, Sens. Actuators, B, 2017, 241, 698–705 CrossRef.
- T. T. Schug, A. Janesick, B. Blumberg and J. J. Heindel, J. Steroid Biochem. Mol. Biol., 2011, 127, 204–215 CrossRef CAS PubMed.
- T. Tanaka, H. Takeda, F. Ueki, K. Obata, H. Tajima, H. Takeyama, Y. Goda, S. Fujimoto and T. Matsunaga, J. Biotechnol., 2004, 108, 153–159 CrossRef CAS PubMed.
- A. Peñalver, E. Pocurull, F. Borrull and R. M. Marcé, J. Chromatogr. A, 2002, 964, 153–160 CrossRef.
- A. Stafiej, K. Pyrzynska and F. Regan, J. Sep. Sci., 2007, 30, 985–991 CrossRef CAS PubMed.
- F. Regan, A. Moran, B. Fogarty and E. Dempsey, J. Chromatogr. A, 2003, 1014, 141–152 CrossRef CAS PubMed.
- A. Azzouz and E. Ballesteros, Food Chem., 2015, 178, 63–69 CrossRef CAS PubMed.
- X. Zhang, Y. Peng, J. Bai, B. Ning, S. Sun, X. Hong, Y. Liu, Y. Liu and Z. Gao, Sens. Actuators, B, 2014, 200, 69–75 CrossRef CAS.
- T. Wen, M. Wang, M. Luo, N. Yu, H. Xiong and H. Peng, Food Chem., 2019, 297, 124968 CrossRef CAS PubMed.
- Y. Li, X. Zhao, P. Li, Y. Huang, J. Wang and J. Zhang, Anal. Chim. Acta, 2015, 884, 106–113 CrossRef CAS PubMed.
- T. B. Tran, S. J. Son and J. Min, BioChip J., 2016, 10, 318–330 CrossRef CAS.
- H. Medetalibeyoğlu, Carbon Lett., 2021, 31(6), 1237–1248 CrossRef.
- G. Kesavan and S. M. Chen, Microchem. J., 2020, 159, 105587 CrossRef CAS.
- J. O. S. Silva, M. V. S. Sant'Anna, A. Gevaerd, J. B. S. Lima, M. D. S. Monteiro, S. W. M. M. Carvalho and E. Midori Sussuchi, Electroanalysis, 2021, 1–10 Search PubMed.
- M. L. Yola, T. Eren and N. Atar, J. Electrochem. Soc., 2016, 163, B588–B593 CrossRef CAS.
- M. Z. H. Khan, X. Liu, J. Zhu, F. Ma, W. Hu and X. Liu, Biosens. Bioelectron., 2018, 108, 76–81 CrossRef CAS PubMed.
- M. R. Ali, M. S. Bacchu, M. A. A. Setu, S. Akter, M. N. Hasan, F. T. Chowdhury, M. M. Rahman, M. S. Ahommed and M. Z. H. Khan, Biosens. Bioelectron., 2021, 188, 113338 CrossRef CAS PubMed.
- W. Zhang, Z. Zhao, F. Dong and Y. Zhang, Chin. J. Catal., 2017, 38, 372–378 CrossRef CAS.
- M. R. Ali, M. S. Bacchu, M. Daizy, C. Tarafder, M. S. Hossain, M. M. Rahman and M. Z. H. Khan, Anal. Chim. Acta, 2020, 1121, 11–16 CrossRef CAS PubMed.
- M. Kim, S. Hwang and J. S. Yu, J. Mater. Chem., 2007, 17, 1656–1659 RSC.
- S. Sunasee, K. H. Leong, K. T. Wong, G. Lee, S. Pichiah, I. W. Nah, B. H. Jeon, Y. Yoon and M. Jang, Environ. Sci. Pollut. Res., 2019, 26, 1082–1093 CrossRef CAS.
- A. R. Unnithan, A. R. K. Sasikala, P. Murugesan, M. Gurusamy, D. Wu, C. H. Park and C. S. Kim, Int. J. Biol. Macromol., 2015, 77, 1–8 CrossRef CAS PubMed.
- M. R. Ali, M. S. Bacchu, M. R. Al-Mamun, M. S. Ahommed, M. A. Saad Aly and M. Z. H. Khan, RSC Adv., 2021, 11, 15565–15572 RSC.
- B. Sriram, J. N. Baby, Y.-F. Hsu, S.-F. Wang and M. George, J. Electrochem. Soc., 2021, 168, 087502 CrossRef CAS.
- M. Z. H. Khan, M. S. Ahommed and M. Daizy, RSC Adv., 2020, 10, 36147–36154 RSC.
- X. Lin and Y. Li, Biosens. Bioelectron., 2006, 22, 253–259 CrossRef CAS PubMed.
- L. Yuan, J. Zhang, P. Zhou, J. Chen, R. Wang, T. Wen, Y. Li, X. Zhou and H. Jiang, Biosens. Bioelectron., 2011, 29, 29–33 CrossRef CAS PubMed.
- B. Zhu, O. A. Alsager, S. Kumar, J. M. Hodgkiss and J. Travas-Sejdic, Biosens. Bioelectron., 2015, 70, 398–403 CrossRef CAS PubMed.
- D. Duan, X. Si, Y. Ding, L. Li, G. Ma, L. Zhang and B. Jian, Bioelectrochemistry, 2019, 129, 211–217 CrossRef CAS.
- F. C. Moraes, B. Rossi, M. C. Donatoni, K. T. de Oliveira and E. C. Pereira, Anal. Chim. Acta, 2015, 881, 37–43 CrossRef CAS PubMed.
- K. Spychalska, D. Zając and J. Cabaj, RSC Adv., 2020, 10, 9079–9087 RSC.
| This journal is © The Royal Society of Chemistry 2022 |

