 Open Access Article
Novel near-infrared reflective black inorganic pigment based on cerium vanadate
Takuro Moriomotoa,
Ryohei Oka *b,
Kohei Minagawaa and
Toshiyuki Masui
 *cd
*cd
aDepartment of Engineering, Graduate School of Sustainability Science, Tottori University, 4-101, Koyama-cho Minami, Tottori 680-8552, Japan
bField of Advanced Ceramics, Department of Life Science and Applied Chemistry, Nagoya Institute of Technology, Gokiso, Showa, Nagoya, 466-8555, Japan. E-mail: oka.ryohei@nitech.ac.jp; Tel: +81-52-735-5365
cFaculty of Engineering, Tottori University, 4-101, Koyama-cho Minami, Tottori 680-8552, Japan
dCanter for Research on Green Sustainable Chemistry, Tottori University, 4-101, Koyama-cho Minami, Tottori 680-8552, Japan. E-mail: masui@tottori-u.ac.jp; Fax: +81-857-31-5264; Tel: +81-857-31-5264
First published on 6th June 2022
Abstract
Gd3+-doped cerium vanadates, Ce1−xGdxVO4 (0 ≤ x ≤ 0.30), were synthesized as near-infrared (NIR) reflective black pigments by a conventional solid-state reaction method. Crystal structure, particle size, optical properties, and color of the samples were characterized. The Ce1−xGdxVO4 (0 ≤ x ≤ 0.30) samples were obtained in a single-phase form and the lattice volume decreased with increasing Gd3+ concentration. Optical absorption below 630 nm was observed in all samples, which corresponded to the charge-transfer transition between Ce4f and V3d orbitals. The absorption spectrum of Ce1−xGdxVO4 was shifted to the longer wavelength side as the Gd3+ content increased, because of the increase in the crystal field around V5+ due to the lattice shrinkage. As a result, the sample color gradually changed from dark brown to black with increasing Gd3+ content. Among the samples synthesized in this study, Ce0.80Gd0.20VO4 absorbed visible light with wavelengths shorter than 650 nm and exhibited the darkest color. Furthermore, this black pigment showed a sufficient NIR reflectance value (R = 66.3%), which was higher than those of the commercially available products (R < 50%).
Introduction
The urban heat-island effect gives rise to the ambient temperature in an urban area being higher than that in the surrounding countryside. This phenomenon often adversely affects the habitability of many cities, including the high-power consumption of air conditioners, poor air quality, and human health in the summer.1 Natural sunlight consists of 5% ultraviolet light (UV; 280–400 nm), 43% visible light (Vis; 400–700 nm), and 52% near-infrared light (NIR; 700–2500 nm).2 The photon energy obtained by absorbing light is converted into vibration energy and finally into thermal energy. In addition, NIR light in the wavelength range of 700 to 1300 nm plays the most important role in heat generation.3 Therefore, in order to mitigate heat storage, it is desirable for the material to reflect NIR light in this region, and pigments of various colors that reflect NIR light have been reported.4–18The NIR reflection properties of various color pigments (white, yellow, blue, etc.) are generally superior to those of black pigments, because these pigments tend to reflect NIR light as well as visible light.19,20 Common black pigments such as carbon black basically absorb not only visible light but also NIR light to store heat. Generally, they are painted on roads and exterior walls, so in urban areas where the proportion of roads and exterior walls is higher than that of green areas, the temperature rises, and the artificial heat exhausted by air conditioning increases.21 The heat island effect is a serious problem in the world. By using NIR reflective black pigment on the road surface and the wall of the building, it can be expected to alleviate the phenomenon. Several compounds such as (Fe, Cr)2O3 and Fe2TiO4 have been reported as NIR-reflective black pigments.4,22 However, (Fe, Cr)2O3 contains toxic chromium, and the NIR-reflective properties of both materials are not sufficient.
This study focused on cerium vanadate (CeVO4) as the host material for environmentally friendly NIR-reflective black pigments composed of only low toxic elements. It has been reported that CeVO4 shows optical absorption due to a Ce4f–V3d charge transfer transition and its optical band gap energy is 1.8 eV.23,24 Therefore, this vanadate compound should exhibit a dark brown color and reflect NIR light. The wavelength of the optical absorption caused by the Ce4f–V3d charge transfer transition can be controlled by adjusting the crystal field strength around V5+, because the split width of the V3d orbitals corresponds to the crystal field strength, which is enhanced by the lattice contraction. Since the absorption wavelength depends on the energy difference between the Ce4f and the V3d orbitals, the optical absorption wavelength shifts to the longer wavelength side when smaller ions are doped into the Ce3+ site.
As a dopant to modify the crystal field strength, Gd3+ (ionic radius: 0.1053 nm),25 which is smaller than Ce3+ (ionic radius: 0.1143 nm),25 was selected. When Gd3+ ions are doped into the Ce3+ site, the split width of the V3d orbital should be widened due to lattice shrinkage. The color of the material is expected to change from dark brown to black due to the decrease in the energy between the Ce4f and the V3d orbitals. Therefore, Ce1−xGdxVO4 (0 ≤ x ≤ 0.30) solid solutions were synthesized in this study. Their NIR reflection and color properties were characterized, and the composition was optimized to satisfy both sufficient blackness and high NIR reflectance.
Experimental
Materials and methods
The Ce1−xGdxVO4 (0 ≤ x ≤ 0.30) powder samples were synthesized by a conventional solid-state reaction method. Stoichiometric amounts of CeO2 (FUJIFILM Wako Pure Chemical Industries, Ltd., 99.5%), V2O5 (FUJIFILM Wako Pure Chemical Industries, Ltd., 99.0%), and Gd2O3 (Shin-Etsu Chemical Co., Ltd., 99.9%) were mixed in an agate mortar. The mixtures were calcined in an alumina crucible at 900 °C for 6 h in an air atmosphere. Finally, the samples were ground in an agate mortar before characterization.Characterization
The powder samples obtained were characterized by the following methods. The chemical composition of the samples analyzed by X-ray fluorescence spectroscopy (XRF; Rigaku, ZSX Primus) were in good agreement with the nominal stoichiometric compositions of the starting mixtures. The crystal structure was identified by X-ray powder diffraction (XRD; Rigaku, Ultima IV) with Cu-Kα radiation (40 kV and 40 mA). The sampling width and the scan speed were 0.02° and 6 min−1, respectively. The lattice volume was calculated with the CellCalc Ver. 2.20 software from the XRD peak angles refined using α-Al2O3 as a standard. The morphology of the Ce1−xGdxVO4 (x = 0, 0.10, 0.20 and 0.30) particles was investigated using a field-emission-type scanning electron microscope (FE-SEM; JEOL, JSM-6701F).The optical reflectance spectra were measured using an ultraviolet-visible-near-infrared (UV-Vis-NIR) spectrometer (JASCO, V-770 with an integrating sphere attachment). Barium sulphate (BaSO4) and polytetrafluoroethylene (PTFE) powders were used as reference samples in the visible and NIR light regions, respectively. NIR solar reflectance (R) was calculated according to the American Society for Testing and Materials (ASTM) Standard G173-03 and estimated by the following formula:
Results and discussion
X-ray powder diffraction (XRD) and field-emission-type scanning electron microscopic (SEM) image
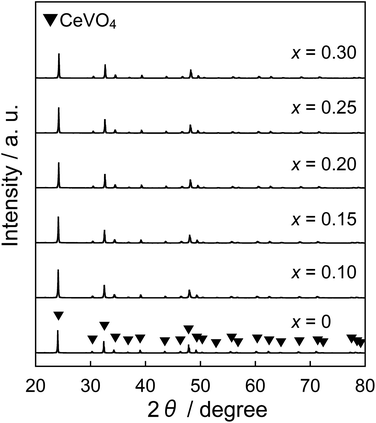
Fig. 1 shows the XRD patterns of the Ce1−xGdxVO4 (0 ≤ x ≤ 0.30) samples. It has been reported that CeVO4 has tetragonal27,28 and monoclinic structures.28–30 In all samples, the diffraction pattern was indexed to that of the tetragonal CeVO4 phase and obtained in a single-phase form. The lattice volumes of the Ce1−xGdxVO4 (0 ≤ x ≤ 0.30) samples are listed in Table 1. The lattice volume monotonically decreased as the Gd3+ concentration increased. These results indicated that Ce3+ ions (0.1143 nm)25 in the CeVO4 lattice were partially substituted with smaller Gd3+ ions (0.1053 nm)25 and the Ce1−xGdxVO4 (0 ≤ x ≤ 0.30) solid solutions were successfully synthesized in a single-phase form.| x | Lattice volume/nm3 |
|---|---|
| 0 | 0.3551 |
| 0.10 | 0.3529 |
| 0.15 | 0.3514 |
| 0.20 | 0.3501 |
| 0.25 | 0.3491 |
| 0.30 | 0.3478 |
Fig. 2 shows the FE-SEM images and particle size distributions of the Ce1−xGdxVO4 (0 ≤ x ≤ 0.30) samples. The average particle size increased with increasing the Gd3+ concentration; the size increased from 1.99 mm (x = 0) to 3.49 mm (x = 0.30). This particle growth was promoted by the Gd3+ doping, because the melting point of GdVO4 (1800 °C)31 is lower than that of CeVO4 (1832 °C).32
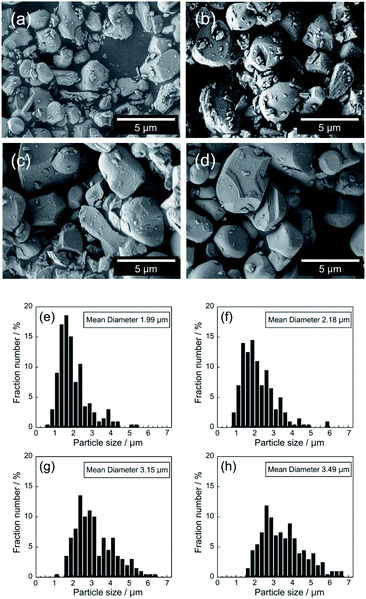 | ||
| Fig. 2 FE-SEM images and particle size distributions of Ce1−xGdxVO4; x = 0 (a and e), x = 0.10 (b and f), x = 0.20 (c and g), and x = 0.30 (d and h). | ||
Reflectance spectra
The UV-Vis-NIR reflectance spectra of the Ce1−xGdxVO4 (0 ≤ x ≤ 0.30) samples are shown in Fig. 3(a). An enlarged view of the reflectance spectra in the visible light region (300–750 nm) is also depicted in Fig. 3(b). All samples were found to strongly absorb visible light with wavelengths shorter than 650 nm, and this optical absorption was attributed to the Ce4f–V3d charge transfer transition.23 Since the crystal field energy around V5+ was increased by the lattice contraction, the spectral curve was shifted to the longer wavelength side by the Gd3+ doping. Actually, the band gap energy was decreased by the Gd3+ doping, as shown later in Table 2. As a result, the color of the sample gradually changed from reddish brown to black as the Gd3+ content increased.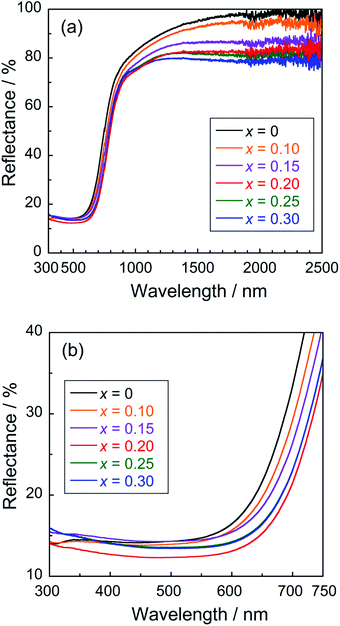 | ||
| Fig. 3 Reflectance spectra of the UV-Vis-NIR (a) and UV-Vis (b) regions of the Ce1−xGdxVO4 (0 ≤ x ≤ 0.30) samples. | ||
| x | L* | a* | b* | C | Eg/eV | R/% |
|---|---|---|---|---|---|---|
| 0 | 26.8 | +11.1 | +6.62 | 12.9 | 1.69 | 77.5 |
| 0.10 | 27.3 | +8.57 | +5.14 | 9.99 | 1.67 | 74.1 |
| 0.15 | 25.1 | +6.99 | +3.72 | 7.92 | 1.63 | 70.0 |
| 0.20 | 22.2 | +5.71 | +2.77 | 6.35 | 1.60 | 66.3 |
| 0.25 | 23.2 | +6.14 | +3.24 | 6.94 | 1.62 | 67.0 |
| 0.30 | 23.1 | +6.17 | +3.18 | 6.99 | 1.62 | 66.0 |
In the range of x from 0 to 0.20, the absorption wavelength shifted to the longer wavelength side with increasing the amount of Gd3+. Since the ionic radius of Gd3+ is smaller than that of Ce3+, partial replacement of Ce3+ with Gd3+ causes the crystal lattice to contract and the crystal field energy near V5+ to increase. This red shift of the spectral curve was due to a decrease in the transition energy between the Ce4f and the V3d orbitals, caused by an increase in the split width of the V3d orbitals. In the x region of x ≥ 0.20, on the other hand, the spectral curve shifted to the shorter wavelength side as the Gd3+ content increased. This blue shift was due to the narrowing of the energy band of the Ce4f orbitals due to the decrease in the Ce3+ concentration, leading to an increase in the Ce4f–V3d charge transfer energy. In other words, there is a trade-off relationship between the increase in the splitting width of the V3d orbitals and narrowing of the Ce4f orbitals. The boundary between the x regions, where the former and latter effects were dominant, was approximately x = 0.20.
When Gd3+ was doped, the NIR reflectivity of the sample decreased. Based on the Mie scattering theory,33 light scattering capacity is generally maximized when the particle size is approximately equal to the wavelength of the corresponding light. As already shown in Fig. 2, the average particle size of the sample increased from 1.99 to 3.49 μm with increasing the Gd3+ concentration. Therefore, the decrease in the NIR reflectivity was caused by an increase in the number of particles that were too large in size compared to the wavelength of NIR light (700–2500 nm).34
Chromatic properties and NIR solar reflectance
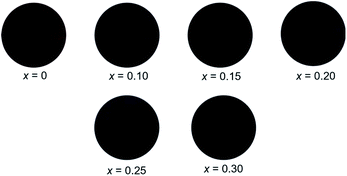
The L*a*b*C color coordinate data, bandgap energies (Eg) and NIR solar reflectance (R) of the Ce1−xGdxVO4 (0 ≤ x ≤ 0.30) powder samples are summarized in Table 2. The photographs of them are also displayed in Fig. 4. In the x region of x ≤ 0.20, the brightness (L*), redness (a*), yellowness (b*) and chroma (C) values were decreased by doping with Gd3+. When 0.25 ≤ x, on the other hand, the L*, a*, b*, and C values of Ce1−xGdxVO4 (0.25 ≤ x) were almost the same as those of the x = 0.20 sample. These results are consistent with the reflection behavior in the red light (600–750 nm) region shown in Fig. 3. The sample color gradually changed from reddish brown to black with increasing the Gd3+ content. The darkest black was obtained with Ce0.80Gd0.20VO4 among all samples. As mentioned in Fig. 3(a), the optical reflection in the NIR light region (700–2500 nm) was reduced by the partial substitution of Ce3+ with Gd3+, resulting in the decrease in the R value. However, the Ce0.80Gd0.20VO4 sample, which exhibited the darkest black of all samples, showed a sufficient high R value (66.3%). From these results above, Ce0.80Gd0.20VO4 is considered the best black pigment with good NIR-reflective property.Chemical stability tests
The chemical stability of the Ce0.80Gd0.20VO4 pigment was evaluated using the powder sample. The acid/base resistance of the Ce0.80Gd0.20VO4 pigment was tested in 4% CH3COOH and 4% NH4HCO3 aqueous solutions, and the pigment was soaked in the acid solution and the base solution, respectively. After allowing them to stand at room temperature for 2 h, the pigments were washed with deionized water and ethanol and then dried at ambient temperature.The chromatic coordinate data of the samples after the chemical stability test are summarized in Table 3. The color was almost unchanged after the leaching test in the acid and the base solutions. Therefore, the Ce0.80Gd0.20VO4 pigment has chemical stability.
| Treatment | L* | a* | b* | C | R/% |
|---|---|---|---|---|---|
| As synthesized | 22.2 | +5.71 | +2.77 | 6.35 | 66.3 |
| 4% CH3COOH | 21.3 | +5.31 | +2.62 | 5.92 | 69.1 |
| 4% NH4HCO3 | 21.4 | +5.38 | +2.78 | 6.06 | 72.3 |
Comparison with commercially available pigments
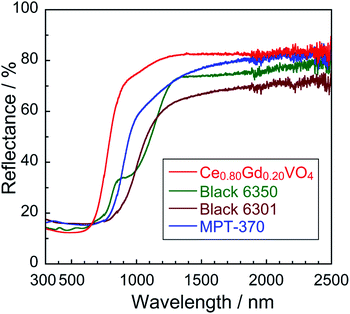
The UV-Vis-NIR diffuse reflectance spectrum and the color parameters for the optimized Ce0.80Gd0.20VO4 pigment were compared with those of several commercially available NIR-reflective black pigments such as Black 6350 (iron and chromium oxide; Asahi Kasei), Black 6301 (manganese and bismuth oxide, Asahi Kasei), and MPT-370 (calcium, manganese, and titanium oxide, Ishihara Sangyo). The UV-Vis-NIR results are shown in Fig. 5 and the color parameters are summarized in Table 4. The photographs of these pigments are also demonstrated in Fig. 6. As evidenced from these results, the present Ce0.80Gd0.20VO4 pigment showed higher reflectance in the NIR wavelength region and higher R values than those of the commercially available pigments. Therefore, we can conclude that Ce0.80Gd0.20VO4 is a novel black pigment with sufficient blackness and NIR-reflective property.| Pigment | L* | a* | b* | C | R/% |
|---|---|---|---|---|---|
| Ce0.80Gd0.20VO4 | 22.2 | +5.71 | +2.77 | 6.35 | 66.3 |
| Black 6350 | 27.0 | +0.78 | +3.53 | 3.62 | 44.7 |
| Black 6301 | 25.0 | +0.42 | +0.97 | 1.06 | 40.1 |
| MPT-370 | 25.7 | +0.59 | −0.48 | 6.35 | 49.0 |
 | ||
| Fig. 6 Photographs of Ce0.80Gd0.20VO4 (a), Black 6350 (b), Black 6301 (c), and MPT-370 (d) pellets made from the powder samples. | ||
Conclusions
The Ce1−xGdxVO4 (0 ≤ x ≤ 0.30) solid solutions were synthesized by a conventional solid-state reaction method with the aim of developing a new NIR-reflective black pigment. In the samples with the x range of 0 to 0.20, the spectral curve shifted to the longer wavelength side because the energy gap between the Ce4f and the V3d orbitals decreased as the crystal field energy around V5+ increased due to the lattice shrinkage. As a result, the color of the sample gradually changed from reddish brown to black. Both adequate blackness and high NIR solar reflectance (R) were obtained at Ce0.80Gd0.20VO4. The R value for this sample was 66.3% and the L*a*b*C color parameters were L* = 22.2, a* = +5.71, b* = +2.77, and C = 6.35, respectively. In particular, the R value was significantly higher than those of the conventional commercially available black pigments (R < 50%). Ce0.80Gd0.20VO4 has both sufficient blackness and NIR-reflective property, which could make this pigment an effective alternative to the conventional black pigments for thermal shielding.Conflicts of interest
There are no conflicts to declare.Acknowledgements
This work was supported by JSPS KAKENHI (Grant Numbers JP19K05668 and JP20H02439).References
- A. Mohajerani, J. Bakaric and T. Jeffrey-Bailey, J. Environ. Manage., 2017, 197, 522 CrossRef PubMed.
- L. Liu, A. Han, M. Ye and W. Feng, Sol. Energy, 2015, 113, 48 CrossRef CAS.
- B. Kaur, N. Quazi, I. Ivanov and S. N. Bhattacharya, Dyes Pigm., 2012, 92, 1108 CrossRef CAS.
- R. Levinson, P. Berdahl and H. Akbari, Sol. Energy Mater. Sol. Cells, 2005, 89, 351 CrossRef CAS.
- P. Jeevanandam, R. S. Mulukutla, M. Phillips, S. Chaudhuri, L. E. Erickson and K. J. Klabunde, J. Phys. Chem. C, 2007, 111, 1912 CrossRef CAS.
- L. S. Kumarai, P. P. Rao, A. N. P. Radhakrishnan, V. James, S. Sameera and P. Koshy, Sol. Energy Mater. Sol. Cells, 2013, 112, 134 CrossRef.
- T. R. Aju Thara, P. P. Rao, S. Divya, A. K. V. Raj and T. S. Sreena, ACS Sustainable Chem. Eng., 2017, 5, 5118 CrossRef CAS.
- M. Zhao, A. Han, M. Ye and T. Wu, Sol. Energy, 2013, 97, 350 CrossRef CAS.
- V. Elakkiya and S. Sumathi, Mater. Lett., 2020, 263, 127246 CrossRef CAS.
- A. K. V. Raj, P. P. Rao, S. Divya and T. R. Ajuthara, Powder Technol., 2017, 311, 52 CrossRef CAS; P. Meenakshi and M. Selvaraj, Sol. Energy Mater. Sol. Cells, 2018, 174, 530 CrossRef.
- P. Meenakshi and M. Selvaraj, Sol. Energy Mater. Sol. Cells, 2018, 174, 530 CrossRef CAS.
- B. Huang, Y. Xiao, H. Zhou, J. Chen and X. Sun, ACS Sustainable Chem. Eng., 2018, 6, 10735 CrossRef CAS.
- A. E. Smith, M. C. Comstock and M. A. Subramanian, Dyes Pigm., 2016, 133, 214 CrossRef CAS.
- S. Jose and M. L. Reddy, Dyes Pigm., 2013, 98, 540 CrossRef CAS.
- R. Ianoş, E. Muntean, C. Păcurariu, R. Lazău, C. Bandas and G. Delinescu, Dyes Pigm., 2017, 142, 24 CrossRef.
- D. Saraswathy, P. P. Rao, A. K. V. Raj and T. R. Ajuthara, Dyes Pigm., 2017, 142, 472 CrossRef CAS.
- X. Zhao, Y. Zhang, Y. Huang, H. Gong and J. Zhao, Dyes Pigm., 2015, 116, 119 CrossRef CAS.
- S. Jose, A. Prakash, S. Laha, S. Natarajan and M. L. Reddy, Dyes Pigm., 2014, 107, 118 CrossRef CAS.
- R. Levinson, P. Berdahl, H. Akbari, W. Miller, I. Joedicke, J. Reilly, Y. Suzuki and M. Vondran, Sol. Energy Mater. Sol. Cells, 2007, 91, 304 CrossRef CAS.
- R. Levinson, H. Akbaria and J. C. Reilly, Build. Environ., 2007, 42, 2591 CrossRef.
- A. Mohajerani, J. Bakaric and T. Jeffrey-Bailey, J. Environ. Manage., 2017, 197, 522 CrossRef PubMed.
- E. B. Faulkner and R. J. Schwartz, High Performance Pigments, 2nd edn, Wiley-VCH, 2009 Search PubMed.
- M. R. Dolgos, A. M. Paraskos, M. W. Stoltzfus, S. C. Yarnell and P. M. Woodward, J. Solid State Chem., 2009, 182, 1964 CrossRef.
- M. Oshikiri, J. Ye and M. Boero, J. Phys. Chem. C, 2014, 118, 8331 CrossRef CAS.
- R. D. Shannon, Acta Crystallogr., Sect. A: Cryst. Phys., Diffr., Theor. Gen. Crystallogr., 1976, 32, 751 CrossRef.
- P. Kubelka and F. Munk, Z. Tech. Phys., 1931, 12, 593 Search PubMed.
- C. T. G. Petit, R. Lan, P. I. Cowin and S. Tao, J. Solid State Chem., 2010, 183, 1231 CrossRef CAS.
- A. B. Garg, K. V. Shanavas, B. N. Wani and S. M. Sharma, J. Solid State Chem., 2013, 203, 273 CrossRef CAS.
- K.-J. Range, H. Meister and U. Klement, Z. Naturforsch., B: J. Chem. Sci., 1990, 45, 598 CrossRef CAS.
- M. Yoshimura and T. Sata, Bull. Chem. Soc. Jpn., 1969, 42, 3195 CrossRef CAS.
- G. A. Rykova, V. M. Skorikov, Yu. M. Baryshnikov and G. G. Yagol'nikov, Russ. J. Inorg. Chem., 1976, 21, 1698 Search PubMed.
- L. S. O'Bannon, Dictionary of Ceramic Science and Engineering, Plenum Press, New York, 1984 Search PubMed.
- G. Mie, Ann. Phys., 1908, 25, 377 CrossRef CAS.
- J. Song, J. Qin, J. Qu, Z. Song, W. Zhang, X. Xue, Y. Shi, T. Zhang, W. Ji, R. Zhang, H. Zhang, Z. Zhang and X. Wu, Sol. Energy Mater. Sol. Cells, 2014, 130, 42 CrossRef CAS.
| This journal is © The Royal Society of Chemistry 2022 |


