 Open Access Article
Preparation, characterization and in vitro study of bellidifolin nano-micelles
Fan Gao†
 a,
Ziyue Chen†b,
Li Zhoua,
Xuefeng Xiaob,
Lin Wangc,
Xingchao Liua,
Chenggang Wang*c and
Qiuhong Guo*a
aHebei TCM Formula Preparation Technology Innovation Center, Hebei University of Chinese Medicine, Shijiazhuang 050091, People's Republic of China. E-mail: qiuhong70105@163.com
bSchool of Chinese Materia Medica, Tianjin University of Traditional Chinese Medicine, Tianjin 301617, People's Republic of China
cState Key Laboratory of Drug Delivery Technology and Pharmacokinetics, Tianjin Institute of Pharmaceutical Research, Tianjin 300301, People's Republic of China. E-mail: wangcg@tipr.com.cn
First published on 10th August 2022
Abstract
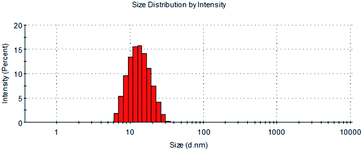
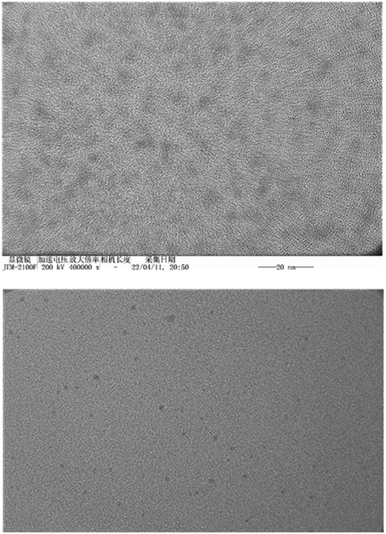
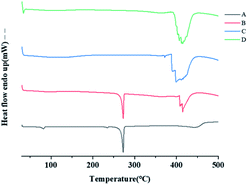
Bellidifolin (BEL), a xanthone compound, has significant therapeutic effectiveness in cardiac diseases such as arrhythmias. However, BEL is limited in clinical applications by its hydrophobicity. In this work, we used BEL as the active pharmaceutical ingredient (API), and polyethylene glycol 15-hydroxy stearate (Kolliphor HS15) as the carrier to prepare BEL nano-micelles by a solvent-volatilization method. According to an analysis by differential scanning calorimetry (DSC), BEL was successfully encapsulated in HS15 as BEL nano-micelles with a 90% encapsulation rate, and particle size was 12.60 ± 0.074 nm in the shape of a sphere and electric potential was −4.76 ± 4.47 mV with good stability and sustained release characteristics. In addition, compared with free drugs, these nano-micelles can increase cellular uptake capacity, inhibit the proliferation of human cardiac fibroblasts, and down-regulate the expression of Smad-2, α-SMA, Collagen I, and Collagen III proteins in myocardial cells to improve myocardial fibrosis. In conclusion, the BEL nano-micelles can provide a new way for the theoretical basis for the clinical application of anti-cardiac fibrosis.
1 Introduction
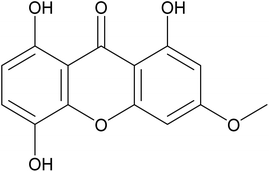
Myocardial fibrosis (MF) is a common pathological phenomenon in the late stage of a variety of heart diseases, which is characterized by excessive deposition of extracellular matrix (ECM) protein in the myocardium, which distorts the myocardial structure, resulting in arrhythmias and cardiac dysfunction by impairing cardiac contraction and diastolic functions and dysregulation of excitation-contraction coupling. More seriously, MF may develop into sudden cardiac death and heart failure.1 Therefore, taking appropriate measures to prevent and treat myocardial fibrosis is expected to delay the development of heart disease, which is of great significance to improve people's health status and quality of life.Bellidifolin (BEL), is a xanthone compound, which molecular formula is C14H10O6 and whose molecular weight is 274.22 g mol−1. BEL is a yellowish powder that insoluble in water. Fig. 1 shows the chemical formula of BEL. BEL is the main active ingredient of Mongolian medicine Gentianella acuta (Michx.) Hulten.2,3 It is commonly known as a “Stable heart herb”. Residents in Inner Mongolia brew it instead of tea, which can prevent and treat cardiac arrhythmia and other heart diseases with significant effects.4 Some research groups have found that Gentiana can reverse isoproterenol-induced myocardial fibrosis in rats and improve cardiac function through anti-oxidation, inhibiting the inflammatory signaling pathway of myocardial tissue and down-regulating the expression of Galectin-3, NF-κB-P65, TGF-β1, and CTGF.5,6 Gentian can also inhibit isoproterenol-induced myocardial fibrosis in rats by down-regulating TGF-β1, inhibiting phosphorylation of TGF-β receptor I/II, and blocking the activation of the TGF-β1/Smads signaling pathway.6 In this study, the pharmacodynamics of BEL was further studied. In mice, BEL inhibited isoproterenol-induced cardiac structure disorder and collagen deposition. In vitro, BEL inhibited the proliferation of myocardial fibroblasts induced by TGF-β1. Both cell and animal studies have proved that BEL has a potential effect on myocardial fibrosis.7 However, the insoluble nature of BEL limits its applications in clinical.
Nano-micelles are amphiphilic polymers formed by hydrophilic (such as PEG, PVP) and lipophilic (such as PET, PCPP-SA) parts with nanoscale core–shell structure. Because of their inherent properties, they are particularly well suited for drug delivery systems (DDS). Due to the inherent structural properties of nano-micelles, their advantages include (1) protecting encapsulated drugs against degradation in vitro,8(2) circulating in the blood for a long time and releasing drugs gradually, (3) being suitable for carrying drugs through the intestinal mucus layer and reaching the intestinal epithelial cells and increasing the absorption of drugs in the intestinal tract with the small size of particles.9 They can also contain toxic or insoluble compounds in the allowable dose range for safe application. Most of these advantages are related to the hydrophilic part, especially the PEG part. Nanostructured systems with low cost, low toxicity, stability in aqueous media, and high hydration degree have important application value in pharmacology.10 For example, Genexol® PM, a micelle formulation of paclitaxel approved by the FDA, is used for the therapeutic of breast, lung, and ovarian cancers.11
Kolliphor®HS15 (Polyoxyl 15 hydroxy stearate, HS15) is novel non-ionic surfactant developed by BASF Aktiengesellschaft. It is a composite material comprising polyglycerol esters of 12-hydroxystearic acid (70%) combined with free polyethylene glycol (30%) and has a monograph in the European, US, and Japanese Pharmacopoeias.12 Fig. 2 shows the chemical structure formula of Kolliphor HS15. It is widely used to increase drug solubility, enhance absorption and improve drug bio availability.13,14 In order to improve the stability and solubility of coenzyme Q10, Liu15 et al. established a stable nano-micelle delivery system to carry Coenzyme Q10, using HS15 as the carrier. After reviewing the literature, there are few reports about the preparation that can increase the solubility of BEL. Therefore, we prepared BEL into nano micelle to research the physical properties and compare BEL nano micelle (BEL@HS15) with free drug resistance in vitro myocardial fibrosis, in order to lay a foundation for further preclinical studies.
2 Materials and methods
2.1 Materials
Bellidifolin was purchased from Alfa (China). Kolliphor HS15 was purchased from BASF(GER). Human Cardiac Fibroblast Cells (HCF) were provided by the Hebei University of Chinese Medicine (China). Dulbecco's modified Eagle's medium (DMEM), fetal calf serum were purchased from Gibco (USA). Phosphate Buffered Saline (PBS), Hoechst33342, Antifade Mounting Medium was purchased from Biosharp (China). Pyrene was purchased from Macklin (China). Coumarin-6 was purchased from Aladdin (China). TGF-β1 was purchased from Novoprotein (China). Cell Counting Kit-8 (CCK-8) was purchased from HaiGene Technology (China). Smad-2 ELISA Kit, α-SMA ELISA Kit, Collagen I ELISA Kit, Collagen III ELIAS Kit were purchased from Fine Text (China). Acetone, Methanol, and Acetonitrile (HPLC grade) were purchased from Kemiou (China).2.2 Preparation of BEL@HS15
BEL@HS15 was prepared by the solvent evaporation method. A certain amount of Kolliphor HS15 was dissolved in 10 mL pure water, and 1 mg of BEL was dissolved in 1 mL acetone. The acetone solution was slowly added to the pure water while stirring with magnetic force and heated with magnetic stirring. A 0.45 μm microporous membrane was used to remove the free drugs, and a clear yellow micellar solution was obtained. Through the previous orthogonal experiment, the optimal preparation process conditions were optimized. The concentration of HS15 was 30 mg mL−1, and the concentration of BEL was 0.102 mg mL−1.2.3 Characterization of BEL@HS15
 | (1) |
 | (2) |
Er is the cumulative release rate, Ve is the volume absorbed each time (mL), Ci is the drug concentration of the ith sample (μL mL−1), V0 is the volume of the release medium (mL), Cn is the drug concentration of the Nth sample (μL mL−1), n is the number of samples, where i = n − 1 (n > 0), m is the total drug mass.
2.4 Cells on myocardial fibrosis in vitro experiments
HCFs supernatant was collected from each group, and the expression of Collagen I and Collagen III secreted by cells was detected by the ELISA kit. The old cell culture medium of each group was absorbed and discarded, the cells were washed with PBS 3 times, the cell lysate was added, and the cells were detached by operation on ice. After the lysate was completed, the cells were centrifuged at 12000 rpm at 4 °C for 10 min. HCFs supernatant of each group was collected, and the expressions of Smad-2 and α-SMA in the cells were detected by ELISA kit. The experimental procedures are carried out in strict accordance with the instructions.
2.5 Statistical analyses
The statistical analysis software SPSS22.0 for Windows (SPSS Inc., Chicago, IL, USA) was used. The results are recorded as mean ± standard deviation (SD). Analysis of variance (ANOVA) was employed for multiple group comparisons. P < 0.05 was considered statistically significant.3 Results and discussion
3.1 Characterization of BEL@HS15
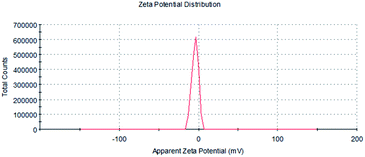
BEL@HS15 potential distribution as shown in Fig. 4, under the optimum preparation process of preparation of BEL@KolliphorHS15 negatively charged surface, zeta potential for −4.76 MV.
 | (3) |
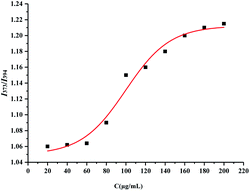
A1 is I373/I394 at low surfactant concentration; A2 is I373/I394 at high surfactant concentration; x is HS15 concentration; x0 is the CMC of HS15; Δx is the slope of the curve drawn at the midpoint x0 of the mutation, which intersects with the two straight lines A1 and A2 parallel to the X-axis. The value of 1/4 of the horizontal distance between the two intersection points is a parameter describing the degree of mutation of the Boltzamann curve.
X0 is the CMC of HS15, and the equation obtained by fitting is  , R2 = 0.9731, so the CMC of HS15 is 99.74 μg mL−1.
3.2 Cells on myocardial fibrosis in vitro experiments
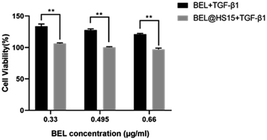
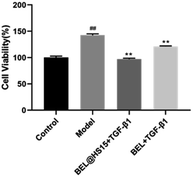 | ||
| Fig. 12 Effect of BEL and BEL@HS15 on HCFs cell activity. Compared with control group, #P < 0.05, ##P < 0.01; Compared with model group, *P < 0.05, **P < 0.01. | ||
![[x with combining macron]](https://www.rsc.org/images/entities/i_char_0078_0304.gif) ± s, n = 3)a
± s, n = 3)a
| Groups | Smad-2 | α-SMA | Collagen I | Collagen III |
|---|---|---|---|---|
| a A1, A2, and A3 are monomers with drug concentrations of 0.33, 0.495, and 0.66, respectively; B1, B2, and B3 are micelles with drug concentrations of 0.33, 0.495, and 0.66, respectively, compared with the control group, #P < 0.05, ##P < 0.01; 0.01; compared with model group, *P < 0.05, **P < 0.01; compared with B3, †P < 0.05, ‡P < 0.01. | ||||
| Control group | 2.504 ± 0.06 | 113.53 ± 1.58 | 1.02 ± 0.03 | 2.69 ± 0.14 |
| Model group | 3.60 ± 0.04## | 231.15 ± 18.20## | 1.60 ± 0.06## | 8.57 ± 0.59## |
| A1 | 3.43 ± 0.08*‡ | 190.44 ± 5.20**‡ | 1.51 ± 0.02‡ | 6.73 ± 0.29**‡ |
| A2 | 3.34 ± 0.05**‡ | 181.43 ± 1.80**‡ | 1.39 ± 0.03**‡ | 5.09 ± 0.25**‡ |
| A3 | 3.09 ± 0.06**‡ | 174.67 ± 6.20**‡ | 1.15 ± 0.04**† | 4.49 ± 0.18**‡ |
| B1 | 3.29 ± 0.04**‡ | 159.65 ± 4.09**‡ | 1.41 ± 0.03**‡ | 4.93 ± 0.11**‡ |
| B2 | 2.98 ± 0.08**‡ | 145.68 ± 3.75**† | 1.19 ± 0.02**‡ | 3.88 ± 0.26**† |
| B3 | 2.76 ± 0.04** | 131.11 ± 5.56** | 1.04 ± 0.03** | 2.99 ± 0.07** |
4 Discussion
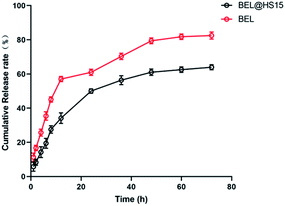
In the preliminary preparation methods, the film dispersion method, solvent volatilization method, and the choice of organic phase were investigated respectively.This study investigated the physicochemical properties of BEL@HS15 prepared by the best preparation process. The particle size of nano micelles plays a crucial role in their transport in vivo. The appropriate particle size can avoid rapid glomerular filtration and increase biological distribution in vivo, without potential toxic effects in the body, which are due to unwanted accumulation of drugs and polymers.8 Therefore, it can efficiently carry drugs to the lesion site. Nano particle size analyzer and transmission electron microscope were used for particle size detection and visual observation of nano micelles. The results show that nano micelles had small particle sizes and were evenly distributed in solution. In storage and system for dosing, nano micelle will be diluted in the body by lots of body fluids. When the concentration is lower than CMC, nano micelle is dissociated with wrapped drug sedimentation occurring, thereby leading to efficacy or side effects. Good dilution stability is a necessary condition for drugs to play their role, so storage stability and dilution stability become important indicators for the stability of nano-micelles.18 The experimental results show that the micelle has good dilution stability. Pre-experiments confirmed that the size, PDI and z-potential of the prepared systems were not statistically different in the presence of albumin/FBS, and did not affect the stability of bellidifolin nano-micelles. Another feature of nano micelles is that they can release drugs slowly, avoid toxic and side effects caused by the sudden release of drugs, reduce drug dosage and improve drug efficacy at the same time.19 Cumulative release rate detection is a simple and effective quality control method. The in vitro cumulative release rates of BEL@HS15 and BEL were compared by dialysis method to evaluate the quality and effectiveness of the preparation. It was shown that BEL@HS15 had the characteristic of slow drug release. The release curve was fitted and BEL@HS15 conformed to the primary release model, laying the theoretical foundation for further development and application of BEL@HS15.
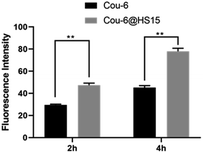
Myocardial fibrosis (MF) is mediated by cardiac fibroblasts, which account for two-thirds of the total number of mammalian heart cells and are the most abundant cell in the heart.20 It plays a key role in protecting myocardial extracellular matrix (ECM) homeostasis and wound healing after myocardial injury. Pathological damage to the heart can lead to a severe inflammatory response in the myocardial tissue, which leads to the accumulation of macrophages and neutrophils. Neutrophils secrete a variety of cytokines and growth factors, including TGF-β1, which binds to TGF-β1 receptor to activate the TGF-β/Smad pathway in cardiac fibroblast and upregulate transcription of ECM proteins and α-SMA. These ECM proteins are converted into myofibroblasts,21 and the extracellular deposition of a large number of these ECM proteins will form fibrotic scar tissue, which is tough and inflexible, thus leading to pathological changes in the heart, such as myocardial infarction, heart failure, arrhythmia and other cardiovascular diseases.22 TGF-β/Smad pathway is the most classic pathway to induce myocardial fibrosis, TGF-β1 and IITGF-β receptor (TβRII) binding, therefore TβRII is activated. Then recruit typeITGF-β receptor (TβRI) on the cell membrane to form a heterodimer, activated TβRII can make TβRI phosphorylation. Further, the activity of receptor serine protein kinase is activated, thus the expression of downstream regulatory factors Smad-2 and Smad-3 are increased and phosphorylated. The phosphorylated Smad-2 and Smad-3 combine with Smad-4 to form a complex and transfer to the nucleus to play a role in transcriptional regulation, which can mediate the increase of ECM protein and α-SMA synthesis in ECM.23 And a large amount of ECM deposition promotes myocardial fibrosis, which in turn promotes the secretion of TGF-β1, causing a vicious cycle. The main pathological manifestations of MF are an excessive proliferation of myocardial fibroblasts, excessive deposition of ECM, and transformation to myofibroblasts.24 Therefore, the CCK-8 method was used in this study to detect the abnormal proliferation of myocardial fibroblasts. ECM protein mainly includes myocardial Collagen fibroin, which is mainly composed of Collagen I and III. Collagen I is the main structural protein that constitutes the extracellular framework. Collagen I accounts for about 85% of the total amount of Collagen in the myocardium, responsible for establishing thick fibre and endowing them with tensile strength. Collagen III, which accounts for 11% of the total collagen protein of the normal heart, is aggregated in the form of microfibers and is responsible for the elasticity of the matrix network. The balance between ECM synthesis and degradation is crucial for maintaining the integrity of the heart structure.1 α-SMA is a marker of myocardial fibroblasts activation.25 The expression of more α-SMA and MF is closely related to TGF-β/Smad classic pathway. Smad-2 enters the cell nucleus to transcribe and regulate, leading to the transformation of cells, thus mediating the deposition of myocardial collagen fibrin. Collagen I, Collagen III, α-SMA and Smad-2 were selected as detection indexes in this study, and morphological observation method was used to observe the changes of cell morphology, to explore the pharmacodynamic effect of BEL on the treatment of myocardial fibrosis. The experimental results showed that the drug-loaded micelles with the same concentration had a higher inhibitory rate on the proliferation of fibroblasts than BEL, and the inhibition rate was concentration-dependent.
5 Conclusions
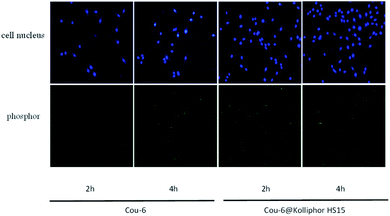
In this study, BEL was taken as the research object, HS15 was used as the carrier material, and it was prepared into BEL@HS15 by a solvent evaporation method, in order to improve the oral absorption and drug efficacy of BEL. The particle size, potential, microstructure, and stability of BEL@HS15 were investigated under the optimum preparation conditions. The sustained-release properties of BEL@HS15 were confirmed by in vitro release test. BEL cell uptake in vitro and anti-myocardial fibrosis efficacy tests were studied using myocardial fibroblasts as models. It was confirmed that BEL@HS15 could significantly inhibit myocardial fibrosis. In this experiment, by selecting preparation methods and optimizing the preparation process, BEL nano micelles with appropriate particle size, high encapsulation rate, good stability, and slow-release effect were successfully prepared in this experiment. The preparation improved the problem of poor water-solubility of BEL, and effectively improved the anti-myocardial fibrosis effect. It provides a theoretical reference for further development and clinical application of BEL in the future.Conflicts of interest
There are no conflicts to declare.Acknowledgements
The Project was Supported by Open Research fund of State Key Laboratory of Drug Delivery and Pharmacokinetics, Tianjin Institute of Pharmaceutical Research, Tianjin 300301, People's Republic of China (No. 10162005) and the Fundamental Research Funds for Hebei University of Chinese Medicine, Shijiazhuang 050091, People's Republic of China (JYZ2020002).References
- L. Li, Q. Zhao and W. Kong, Matrix Biol., 2018, 68–69, 490–506 CrossRef CAS PubMed.
- D. N. Olennikov, N. K. Chirikova and C. Vennos, Nat. Prod. Commun., 2017, 12, 55–56 CrossRef PubMed.
- Z. Wang, Q. Wu, Y. Yu, C. Yang, H. Jiang, Q. Wang, B. Yang and H. Kuang, J. Ethnopharmacol., 2015, 174, 261–269 CrossRef CAS PubMed.
- L. Li-Juan and L. Min-Hui, Biochem. Syst. Ecol., 2009, 37, 497–500 CrossRef.
- A. Y. Li, J. J. Wang, S. C. Yang, Y. S. Zhao, J. R. Li, Y. Liu, J. H. Sun, L. P. An, P. Guan and E. S. Ji, Biomed. Pharmacother., 2019, 110, 733–741 CrossRef CAS PubMed.
- H. X. Yang, G. R. Xu, C. Zhang, J. H. Sun, Y. Zhang, J. N. Song, Y. F. Li, Y. Liu and A. Y. Li, Int. J. Mol. Med., 2020, 45, 223–233 CAS.
- H. X. Yang, J. H. Sun, T. T. Yao, Y. Li, G. R. Xu, C. Zhang, X. C. Liu, W. W. Zhou, Q. H. Song, Y. Zhang and A. Y. Li, Front. Pharmacol., 2021, 12, 644886 CrossRef CAS PubMed.
- N. Majumder, N. G. Das and S. K. Das, Ther. Delivery, 2020, 11, 613–635 CrossRef CAS PubMed.
- G. S. Kwon, Crit. Rev. Ther. Drug Carrier Syst., 2003, 20, 357–403 CrossRef CAS PubMed.
- I. Pepić, J. Lovrić and J. Filipović-Grčić, Eur. J. Pharm. Sci., 2013, 50, 42–55 CrossRef PubMed.
- S. S. Kesharwani, S. Kaur, H. Tummala and A. T. Sangamwar, Colloids Surf., B, 2019, 173, 581–590 CrossRef CAS PubMed.
- L. Illum, F. Jordan and A. L. Lewis, J. Controlled Release, 2012, 162, 194–200 CrossRef CAS PubMed.
- A. Leonardi, C. Bucolo, G. L. Romano, C. B. Platania, F. Drago, G. Puglisi and R. Pignatello, Int. J. Pharm., 2014, 470, 133–140 CrossRef CAS PubMed.
- J. Hou, E. Sun, C. Sun, J. Wang, L. Yang, X. B. Jia and Z. H. Zhang, Int. J. Pharm., 2016, 512, 186–193 CrossRef CAS PubMed.
- L. Liu, K. Mao, W. Wang, H. Pan, F. Wang, M. Yang and H. Liu, AAPS PharmSciTech, 2016, 17, 757–766 CrossRef CAS PubMed.
- X. Huang, W. Liao, G. Zhang, S. Kang and C. Y. Zhang, Int. J. Nanomed., 2017, 12, 2215–2226 CrossRef CAS PubMed.
- J. Aguiar, P. Carpena, J. A. Molina-Bolívar and C. Carnero Ruiz, J. Colloid Interface Sci., 2003, 258, 116–122 CrossRef CAS.
- A. K. Jannu, E. R. Puppala, B. Gawali, N. P. Syamprasad, A. Alexander, S. Marepally, N. Chella, J. K. Gangasani and V. G. M. Naidu, Int. J. Pharm., 2021, 605, 120819 CrossRef CAS PubMed.
- X. Gao, F. Zheng, G. Guo, X. Liu, R. Fan, Z. Y. Qian, N. Huang and Y. Q. Wei, J. Mater. Chem. B, 2013, 1, 5778–5790 RSC.
- A. Deb and E. Ubil, J. Mol. Cell. Cardiol., 2014, 70, 47–55 CrossRef CAS PubMed.
- S. Bolivar, J. A. Espitia-Corredor, F. Olivares-Silva, P. Valenzuela, C. Humeres, R. Anfossi, E. Castro, R. Vivar, A. Salas-Hernández, V. Pardo-Jiménez and G. Díaz-Araya, Cytokine, 2021, 138, 155359 CrossRef CAS PubMed.
- S. Redondo, J. Navarro-Dorado, M. Ramajo, Ú. Medina and T. Tejerina, Vasc. Health Risk Manage., 2012, 8, 533–539 CrossRef PubMed.
- J. C. Liu, F. Wang, M. L. Xie, Z. Q. Cheng, Q. Qin, L. Chen and R. Chen, Int. J. Cardiol., 2017, 228, 388–393 CrossRef PubMed.
- X. L. Zhou, Y. H. Fang, L. Wan, Q. R. Xu, H. Huang, R. R. Zhu, Q. C. Wu and J. C. Liu, J. Cell. Physiol., 2019, 234, 8834–8845 CrossRef CAS PubMed.
- C. Fix, A. Carver-Molina, M. Chakrabarti, M. Azhar and W. Carver, J. Cell. Physiol., 2019, 234, 13931–13941 CrossRef CAS PubMed.
Footnote |
| † These authors contributed equally to this work, and Z. Chen is the co-first author for this paper. |
| This journal is © The Royal Society of Chemistry 2022 |

