 Open Access Article
Impact of physicochemical changes in milk ultrafiltration permeate concentrated by reverse osmosis on calcium phosphate precipitation
Nolwenn Paugama,
Yves Pouliota,
Gabriel Remondettob,
Thierry Maris c and
Guillaume Brisson
 *a
*a
aDepartment of Food Sciences, Institute of Nutrition and Functional Foods (INAF) and Dairy Science and Technology Research Centre (STELA), Laval University, Paul Comtois Hall, 2425 De l'Agriculture Street, Quebec City, QC, Canada. E-mail: guillaume.brisson@fsaa.ulaval.ca
bAgropur, Saint-Hubert, QC, Canada
cDepartment of Chemistry, University of Montréal, Montréal, QC, Canada
First published on 5th September 2022
Abstract
This study aimed to characterize and compare the mechanisms of calcium phosphate precipitation in skimmed milk ultrafiltration permeate (MP) and MP preconcentrated by reverse osmosis (ROMP). The effects of different physicochemical parameters such as the pH (8.0), the heating time (60 or 120 min at 60 °C) and the seeding of samples with dicalcium phosphate (DCP) were tested. The concentration of salts (K, Ca, Na, Mg, and P) in the freeze-dried precipitates was measured using inductively coupled plasma (ICP). The amount of remaining ionic calcium was also monitored. Fourier transform infrared spectroscopy (FTIR) and X-ray diffraction (XRD) analysis were used to characterize the type of calcium phosphate precipitates that formed. The morphological structure of particles was determined using scanning electron microscopy (SEM). The chemical analyses showed that RO increased the rate of precipitated ions, especially Ca and P in MP, while alkalinization to pH 8.0 and heating at 60 °C significantly increased the precipitation of salts, with the calcium phosphate structure changing into complex forms such as hydroxyapatite (HAP) and whitlockite. MP preconcentration by RO paves the way for improving the precipitation yield of milk salts in the form of HAP for Ca fortification in various foods. It offers an original way to valorize the milk salts contained in the high volumes of MP generated by the cheese industry.
1 Introduction
Milk preconcentration by ultrafiltration (UF) enables protein standardization of cheese milk, and protein concentration for manufacturing various grades of milk protein concentrates. It generates large volumes of milk permeate (MP), a by-product containing water, lactose, non-protein nitrogen and salts. MP has a green-yellow color and an approximate total solids content of only 6%. MP poses a major environmental problem for the dairy industry because more than 75% of the solids in UFMP are lactose, and lactose has a high biological oxygen demand (BOD).1–3 Various technologies have been developed to valorize lactose recovered from cheese whey (bioconversion, chemical conversion, bioplastics, animal nutrition, agricultural use, etc.),4 and most of them are suitable for MP.However, MP also contains essential nutrients for bone growth and energy metabolism in mammals, including calcium (Ca) and phosphorus (P). In human nutrition, those two elements can be sourced from food or synthetic forms deriving from mineral extraction, yet dairy products remain one of the best sources available.5 As MP contains a high concentration of Ca and P, exploring salts valorization is of significant interest.6 These milk salts can be obtained from the lactose crystallization process after decanting the lactose slurry by centrifugation.
It has been shown that milk-derived calcium phosphate (MDCP) suspensions can be prepared by inducing Ca and P precipitation with sweet or acid whey to generate hydroxyapatite (HAP) using the following formula: Ca5(PO4)3(OH).7 HAP may serve various purposes. For example, in the medical field, it allows bone grafts to integrate prostheses. As Ca and P naturally represents 80% to 90% of bone salts, HAP supplementation can also foster bone growth in newborn specialized nutrition, complement calcium supplements, or be used as a direct enrichment in food to prevent osteoporosis in the elderly.8–10 In addition, calcium phosphate precipitation in whey streams decreases the salt load, resulting in a more suitable substrate for the bioconversion of lactose or its use in the pharmaceutical industry (excipient) or food industry (candies, bakery products, etc.).11
It is now well established that physicochemical changes have an impact on calcium phosphate precipitation in MP, both in terms of quantity and quality. While Mekmeme et al. (2009) have shown that increasing the pH above 6.5 initiates the precipitation of apatic phases of calcium phosphate such as octacalcium phosphate, Brulé et al. (1978) have shown that heating dairy solutions up to 60 °C changes the equilibrium of salts. Seeding MP with DCP crystals can also induce calcium phosphate precipitation, as demonstrated by Pouliot, Landry and Giasson (1991) and others.12–15
Tanguy et al. (2016) and Crowley et al. (2019) have characterized the formation of calcium phosphate precipitates during evaporation of milk or whey permeates. Such concentrated systems are somewhat similar to reverse osmosis (RO) concentrates. Concentration of milk effluents by RO is now largely used for preconcentration of dairy fluids such as milk and whey.16 RO could be used to increase the ion concentration in MP to optimize the selective precipitation of salts.17
For the present study, MP and RO-concentrated MP (ROMP) were seeded with dicalcium phosphate (DCP) to precipitate salts using different pHs (initial and pH 8.0) and elevated temperature treatment times (60 °C, 60 min and 120 min). This new approach for the valorization of MP salts using a combination of physicochemical treatments and RO is of great interest for the production of calcium phosphate precipitates with a high nutritional value.
2 Materials and methods
2.1 Chemicals
Calcium phosphate dibasic anhydrous powder was purchased from Sigma-Aldrich (St Louis, MO, USA). The sodium hydroxide (NaOH) used for the preparation of 0.1, 1.0, 2.0 and 5.0 M solutions was from Fisher Chemical (Ottawa, ON, Canada). All of the following were purchased from the company Bio-Rad (Hercules, CA, USA): Mini-PROTEAN TGX Stain-Free Gels (12%, 15-well comb, 15 μL), 2× Laemmli sample buffer, Precision Plus Protein TM All Blue Standards, 10× Tris/glycine buffer, 10× Tris/glycine/sodium dodecyl sulfate (SDS), Coomassie blue solution. Acetic acid and nitric acid were purchased from Anachemia (Radnor, PA, USA), and methanol from Fisher Chemical (Ottawa, ON, Canada). Potassium bromide and 2-mercaptoethanol were obtained from Sigma-Aldrich (St Louis, MO, USA). Ethyl alcohol was purchased from Commercial Alcohols (Brampton, ON, Canada). Lastly, a 0.1 M CaCl2 calcium calibration standard was provided by Thermo Fisher Scientific (Waltham, MA, USA).2.2 Milk permeate supply and concentration by reverse osmosis
Skimmed milk permeate (MP) was provided by a local dairy plant (Agropur, Quebec City, QC, Canada). 80 L-lots were collected at the processing plant and stored at 4 °C until use (within two days). A sample from each lot was kept for pH measurement and chemical analyses. The average compositions of the MP and ROMP used in this study are detailed in Table 1.| Composition | MP | ROMP |
|---|---|---|
| a Average value for 3 separate lots (± standard deviation). | ||
| Total solids% (w/v) | 5.89 ± 0.08 | 14.84 ± 0.21 |
| Lactose (g/100 g) | 4.92 ± 0.03 | 12.34 ± 0.17 |
| Elements (mg/100 g) | ||
| Ca | 32.03 ± 1.29 | 85.33 ± 1.03 |
| Na | 33.01 ± 0.33 | 85.54 ± 1.20 |
| P | 40.32 ± 1.34 | 106.07 ± 1.74 |
| K | 156.8 ± 6.41 | 406.49 ± 8.24 |
| Mg | 6.94 ± 0.21 | 18.46 ± 0.15 |
![[thin space (1/6-em)]](https://www.rsc.org/images/entities/char_2009.gif) |
||
| pH values | 6.77 ± 0.06 | 6.69 ± 0.03 |
RO concentration of MP was performed using a pilot system (GEA NIRO Filtration engineering, model L Pilot Plant 65 L, Hudson, WI, USA) equipped with a spiral-wound polyamide membrane with a 98% NaCl rejection (Parker Hannifin, model RO2540-BS05-S, Cleveland, OH, USA). The filtrations were performed at 10 °C under a transmembrane pressure of 2.07 MPa. The total solids concentration of the retentate was monitored using a refractometer (IP65:PAL-1 refractometer, Atago, Tokyo, Japan). The initial MP was around 6° Brix, and filtration was stopped once it reached 15° Brix. An average volume concentration factor (FCV) of 2.5× was reached for each experiment. The retentate was then stored at 4 °C overnight before use.
2.3 Precipitation of calcium phosphate
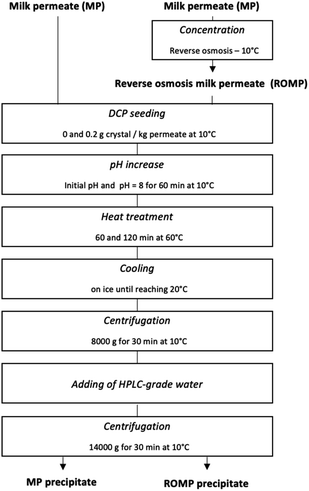
Precipitation of calcium phosphate was carried out according to the following flowchart (Fig. 1). The initial MP and ROMP were put in one-liter beakers on a stir plate and maintained at 10 °C in a controlled temperature room. The solutions were then seeded with dicalcium phosphate (DCP) to reach a g crystals/kg liquid permeate ratio of 0.2, in accordance with Pouliot et al.'s method.13 The pH of the initial MP and ROMP was adjusted with a pH meter to reach the target value of pH 8.00 while stirring for 60 minutes. The pH was measured and readjusted every twenty minutes using 0.1 M HCl or NaOH, accordingly. The samples were then put in a 60 °C orbital shaking water bath (VWR, Radnor, PE, USA) at a speed of 70 rotations per minute (rpm) for 60 and 120 minutes, respectively, to determine the impact of the heating time on the precipitation of salts. The come-up time required for the temperature to reach 60 °C was 50 minutes. Once the desired holding time had elapsed, the samples were rapidly cooled on ice until the temperature decreased to 20 °C. After thermal treatment, the MP and ROMP solutions were centrifuged in polycarbonate bottles using an Avanti J-E centrifuge (Beckman Coulter, Brea, CA, USA) at 8000g for 30 minutes at 10 °C, and the supernatant was recovered from the precipitate. The precipitate was then washed one time with HPLC-grade deionized water (18.2 mΩ cm) obtained with a PURELAB Ultra water purification system (ELGA LabWater, Woodridge, IL, USA) and centrifuged at 14![[thin space (1/6-em)]](https://www.rsc.org/images/entities/char_2009.gif) 000g for 30 minutes at 10 °C. The supernatant was discarded, and the tubes were weighted, closed, and frozen for 24 hours before freeze-drying.
000g for 30 minutes at 10 °C. The supernatant was discarded, and the tubes were weighted, closed, and frozen for 24 hours before freeze-drying.
2.4 Chemical analyses
The recovered ashes were weighted and rehydrated in 1 mL 25% nitric acid, then transferred in a 50-mL volumetric flask to be diluted in HPLC-grade water. The solution was mixed and passed through a 0.45 μm filter (Sarstedt, Nümbrecht, Germany). The specific contents of the main milk elements (Ca, Mg, K, Na, and P) were analyzed using inductively coupled plasma (ICP) optical emission spectrometry (model 5110, Agilent Technologies, Santa Clara, CA, USA), and the results were reported in mM. The Ca/P molar ratio was also calculated.
2.5 Characterization of the precipitates
2.6 Statistical analysis
The experiments were conducted on three different batches of milk permeate. Reverse osmosis and salts precipitation were carried out on the three batches, and each replicate was analyzed independently. The data were processed using multifactor two-way ANOVA. Tukey's method was used to perform multiple comparison tests with GraphPad Prism (GraphPad software version 9.2.0, San Diego, CA, USA) to compare the impact of physicochemical characteristics on the salts' precipitation in MP and ROMP. Statistical significant was established at P < 0.05.3 Results and discussion
Table 1 summarizes the average composition of the MP and ROMP lots generated for the precipitation experiments. The MP total solids, Ca, and P contents are in agreement with the published data.3 The pH values for MP (6.77 ± 0.06) slightly decreased (6.69 ± 0.03) upon RO concentration, and the contents of the main components increased nearly threefold.3.1 Impact of the treatments on calcium phosphate precipitation in MP and ROMP
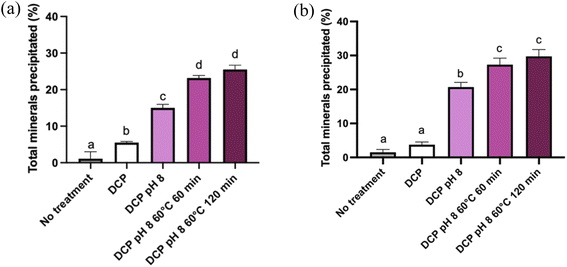
Fig. 2 illustrates the percentage of precipitated salts in MP and ROMP following the different treatments (seeding with DCP, increasing pH to 8.0, holding at 60 °C).The precipitation of salts in the MP samples increased significantly with the various treatments. Only 0.33% of the salts precipitated in MP without DCP seeding or pH modification. After DCP seeding, precipitation increased significantly to 6.77% (P < 0.05). Alkalinization to a pH of 8.0 further increased the amount of dry matter precipitated. Heat treatment also induced a significant augmentation of dry matter (P < 0.05). The highest levels of precipitated salts (∼30%) in MP and ROMP were observed upon combining DCP seeding with pH 8.0 and holding at 60 °C for 60 min. The incubation time (60 min vs. 120 min) did not have a significant impact on salts precipitation.
Seeding MP with DCP and increasing the pH increased the salts content in the precipitate by 5 times and 15 times compared to the initial content, respectively. DCP seeding combined with alkalinization to pH 8 and heat treatment was the most effective technique for increasing the initial salts content, reaching 25% of precipitated salts. The difference between the two heating incubation times at 60 °C did not have a significant impact, as 60 min was enough for most of the salts to precipitate (P < 0.05).12,20 A similar trend was observed in the ROMP samples. However, the amount of precipitated salts started to increase significantly (P < 0.05) after the pH was adjusted to 8.0, while adding DCP induced no further changes. Interestingly, this could mean that DCP seeding does not have a significant impact on calcium phosphate precipitation when it is not associated with another treatment. The heating time did not affect precipitation: there was no significant difference (P < 0.05) between heating for 60 min and 120 min at 60 °C.
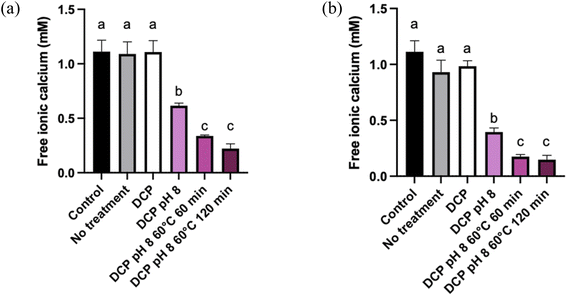
The detailed changes in salts precipitation resulting from the various physicochemical treatments are reported in Table 2. Similar trends were observed in MP and ROMP, but the values were generally higher for ROMP (P < 0.05). It is important to note that precipitation was reported in the untreated ROMP samples, whereas there were no precipitated salts in the untreated and DCP-seeded MP samples. In both MP and ROMP, DCP seeding did not change the amount of precipitated Ca significantly (P > 0.05). For the MP samples, increasing the pH to 8.0 resulted in increased precipitation. Heating at 60 °C also increased calcium precipitation significantly in MP and ROMP (P < 0.05). Similar trends were observed for P precipitation. The most significant changes among all species were seen in ROMP (DCP, pH 8, and 60 °C for 120 min), with major increases in Ca (71.83%), P (38.27%) and Mg (13.61%) precipitation. Much lower values (<5%) were reported for Na and K. The initial Ca2+ contents of MP and ROMP were 8 mM and 21.3 mM, respectively (not shown). These results agree with those presented in previous studies.21 It is interesting to note that the residual Ca2+ levels (<1 mM) in the supernatants following recovery of the precipitates (Fig. 3) were similar for RO and ROMP. Concentration of MP by RO increased the Ca and P concentration in the supernatant of the ROMP. Therefore, considerable part of the ionic Ca2+ in ROMP likely associated with PO42− in the form of soluble calcium–phosphate species such as monocalcium phosphate monohydrate and monocalcium phosphate anhydrous.
| Product | Treatments | Percentage of ions precipitateda,b | ||||
|---|---|---|---|---|---|---|
| Cac | K | Mg | Na | Pc | ||
| a Average value for 3 separate lots (± standard deviation).b Values with a different letter in the same column were significantly different (P < 0.05).c Values for Ca and P were corrected for the added DCP. | ||||||
| MP | No treatment | 0.0 ± 0.0a | 0.0 ± 0.0a | 0.0 ± 0.0a | 0.0 ± 0.0a | 0.0 ± 0.0a |
| DCP | 0.0 ± 0.0a | 0.0 ± 0.0a | 0.0 ± 0.0a | 0.0 ± 0.0a | 0.0 ± 0.0a | |
| DCP pH 8 | 20.96 ± 3.87b | 0.14 ± 0.11a | 4.22 ± 0.95ab | 0.27 ± 0.08ab | 11.15 ± 2.32b | |
| DCP pH 8 60 °C 60 min | 45.54 ± 3.06c | 0.44 ± 0.35a | 4.84 ± 0.67ab | 0.87 ± 0.16ab | 23.47 ± 2.42c | |
| DCP pH 8 60 °C 120 min | 46.26 ± 7.76c | 0.40 ± 0.33a | 4.33 ± 0.94ab | 0.73 ± 0.18ab | 24.95 ± 5.89c | |
![[thin space (1/6-em)]](https://www.rsc.org/images/entities/char_2009.gif) |
||||||
| ROMP | No treatment | 3.34 ± 1.52a | 0.27 ± 0.24a | 0.84 ± 0.32a | 0.15 ± 0.15a | 1.64 ± 0.65ab |
| DCP | 2.89 ± 2.19a | 0.08 ± 0.17a | 0.41 ± 0.38a | 0.09 ± 0.10a | 1.67 ± 1.21ab | |
| DCP pH 8 | 31.71 ± 12.65bc | 0.53 ± 0.61a | 7.99 ± 7.24b | 1.03 ± 0.89b | 12.91 ± 11.14b | |
| DCP pH 8 60 °C 60 min | 67.81 ± 9.44d | 1.80 ± 1.63b | 11.78 ± 2.01bc | 3.72 ± 0.32c | 35.67 ± 5.31cd | |
| DCP pH 8 60 °C 120 min | 71.83 ± 10.58d | 2.19 ± 1.98b | 13.61 ± 2.09bc | 4.52 ± 0.74c | 38.27 ± 5.87d | |
Table 2 also shows that other elements precipitated. While only thermal treatment showed to have a significant positive impact on K and Na precipitation (P < 0.05), the amounts precipitated were still low compared to Ca. With regard to Mg, increased pH and heat treatment resulted in lower solubility and increased precipitation. During complex apatic crystal formation, ions such as Mg2+ can integrate into the structure, leading to the development of non-stoichiometric forms.22 Previous studies attribute that to the migration of Mg2+ ions into the calcium phosphate microgranules.23,24 This expected precipitation of other ions depends on the physicochemical treatments applied to the system,25 such as heat treatment and alkalinization. DCP was added to the permeate to catalyze calcium phosphate precipitation specifically. However, precipitation of other primary ions was also observed, with greater magnitude and more precipitated ions in ROMP than in MP (P < 0.05). This is associated with supersaturation of the system, which is known to initiate and catalyze instant nucleation.26
The Ca/P molar ratios for the MP and ROMP precipitates are reported in Table 3. It is worth noting that all ratios range between 1.05 and 1.25, which indicates that more acidic forms of calcium phosphate (e.g. dicalcium phosphate and orthophosphate) precipitated. The ratios for complex apatic calcium phosphate species are generally between 1 and 2.27 HAP has a theoretical Ca/P molar ratio of 1.67. The Ca/P ratios calculated for the MP and ROMP precipitates are lower. This could be the consequence of calcium deficiency or of the washing process before freeze-drying. The washing process has been reported to reduce the percentage of phosphate in the precipitate considerably.28
| Treatments | Molar ratio Ca/Pa,b | ||
|---|---|---|---|
| MP | ROMP | ||
| a Average value for 3 separate lots (± standard deviation).b Values with a different letter in the same column were significantly different (P < 0.05). | |||
| Products | No treatment | 0.0 ± 0.0a | 1.25 ± 0.13a |
| DCP | 0.0 ± 0.0a | 1.05 ± 0.08a | |
| DCP pH 8 | 1.16 ± 0.05b | 1.27 ± 0.11a | |
| DCP pH 8 60 °C 60 min | 1.19 ± 0.07b | 1.18 ± 0.01a | |
| DCP pH 8 60 °C 120 min | 1.15 ± 0.10b | 1.17 ± 0.01a | |
Brulé et al. (1978) have demonstrated that heat treatment induces salts precipitation in dairy permeates. They reported that 40% of calcium and 25% of phosphorus precipitate upon heating at 60 °C as the Ca2+ content is expected to be higher than the P content.12
The differences between the precipitation results for MP and those for ROMP could result from the fact that the permeate system was near Ca2+ and PO42 saturation. The nucleation time was shorter for MP than for ROMP due to their different free-ion concentrations.25 However, a significant increase in the amount of precipitated salts was observed when DCP seeding was coupled with increasing the pH to 8.0 (P < 0.05), which agrees with the results of a previous experiment on whey permeate.13 The precipitation rate also increased upon heat treatment at 60 °C, but it was not affected by the heating time. Here, most of the salts precipitated within 60 minutes, and further incubation did not increase the recovered precipitates. The percentage of dry matter precipitated as a result of the treatment is low, which suggests a fairly good specificity of the precipitation of the salts. This was confirmed by measuring the residual lactose content in the supernatant. The lactose contents of the control MP and the ROMP (no treatment) were 4.93% and 12.36%, respectively. Seeding with DCP, alkalinization and heating did not affect the lactose content. The residual lactose contents in the supernatants of the MP and ROMP seeded with DCP, adjusted to pH 8.0 and incubated at 60 °C for 120 min were 4.83% and 12.35%, respectively. This confirms that the various treatments had no significant impact (P < 0.05) on the supernatant's lactose content.
The amount of free ionic Ca2+ in the supernatants was also monitored to follow the increase of Ca precipitation with each treatment. Fig. 3 shows the amount (mM) of free ionic Ca2+ in the supernatant according to the treatment used for MP and ROMP. The Ca2+ content in the control samples was around 1.2 mM, which is in line with the results obtained by.29 Ca2+ solubilization generally increases with ionic strength. While DCP seeding had no effect on ionic Ca2+ in the control samples, increasing the pH to 8.0 resulted in a significant decrease in ionic Ca2+ in MP and ROMP (P < 0.05). A more significant decrease was observed upon heat-induced precipitation, with more than two-thirds of the initial ionic Ca2 precipitating (P < 0.05). The pH 8.0–heating combination had a major impact on the precipitation of ionic Ca2+ in MP and ROMP. The increase of the pH is correlated with a dropping in ionic strength in the aqueous phase.30 These results agree with previous studies showing that heat treatment increases the rate of free ionic Ca2+ decrease in milk products.31,32 In addition, it has been shown that there is a negative relationship between the pH and ionic Ca2+ in milk products. Holt (2004) has shown that ionic Ca2+ in milk can decreases when the pH exceeds 5.0 to 7.0. Increasing the pH to 8 causes the rate of free ionic Ca2+ to decrease.33–35
3.2 Impact of the treatments on the characteristics of the precipitates
The XRD patterns presented in Fig. 4 provide illustrative examples of the main physicochemical and structural changes in MP and ROMP according to the various treatments. The samples were divided into three clusters based on their spectral properties and peak intensities. The first cluster includes control MP and control ROMP as well as the untreated samples with dominant KCl (species such as sylvite) naturally present in milk and dairy products along with sodium calcium phosphate silicate and sodium calcium magnesium phosphate. The second one is composed of all the DCP-seeded samples without further treatment with a mineral composition consisting mainly of calcium pyrophosphate, monetite, whitlockite and sylvite. The last cluster is comprised of all the pH-adjusted samples with or without thermal treatment. The X-ray pattern associated with the last cluster matches that of the HAP, but some impurities such as sylvite and whitlockite were also identified. These results suggest that alkalinization and thermal treatment had a positive effect, fostering the conversion of the precipitated calcium phosphate into more complex species. They also suggest that the calcium phosphate species found in the untreated MP and ROMP precipitates were of a different nature. The species in the first cluster are associated with MP, and those in the second cluster with ROMP. The results confirm that pH has a major impact on crystallization and the formation of complex apatic phases, and are in agreement with the findings of Mekmene et al.14 Concentration by RO could also have an influence on the calcium phosphate content. However, no treatment provided a perfect match with the pattern of a commercial synthetic HAP (Fig. 4).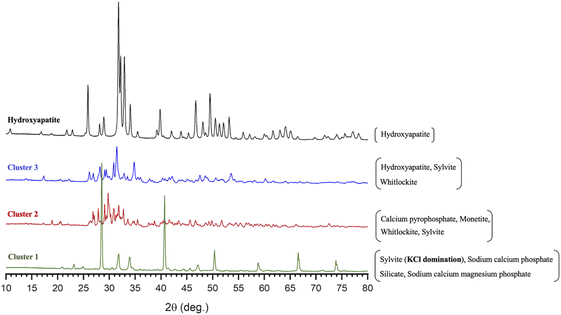 | ||
| Fig. 4 XRD spectral patterns showing the main phase composition and structure of the precipitated salts in the 3 MP and ROMP clusters compared to commercial synthetic HAP. | ||
Complementary to XRD, FTIR spectroscopy was performed to determine the chemical purity of the calcium-phosphate phase composition. The FTIR spectrograms in Fig. 5 provide information about the different precipitated groups based on their respective locations and peak intensities. As the FTIR spectrum shows, the most distinct groups found in HAP were PO43− (1120–1000 cm−1), OH− (3570–3200 cm−1), CO32− (1640–1400 cm−1), and HPO42− (870 cm−1) in the presence of non-stoichiometric HAP.19 All the IR spectra showed specific bands of calcium phosphates. Low-intensity OH− bands at 3570 cm−1 typical of stoichiometric HAP were observed in the heated MP samples.36 Surprisingly, such bands were also obtained with the unheated ROMP samples adjusted to pH 8.0. Those results suggest that preconcentrating MP by RO before inducing precipitation increased the production of HAP. Precipitation can be more efficient without heating treatment for preconcentrated samples. However, HPO42− was found in most ROMP samples, which indicates a calcium deficiency.28 All ions, phosphorus included, were concentrated through the RO process, which led to saturation rather than higher calcium content.
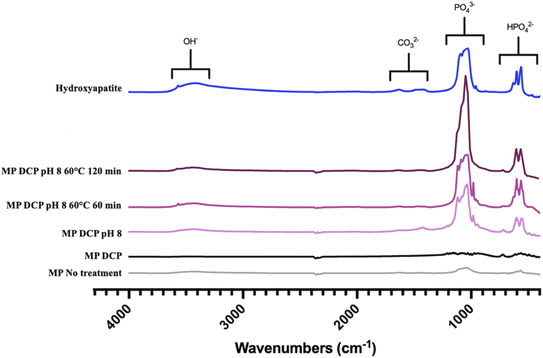 | ||
| Fig. 5 FTIR spectral view of the precipitated groups in MP samples for the different physicochemical parameters tested. | ||
The peak intensity was higher for the samples with a pH increased to 8.0 before precipitation. The absorbance corresponding to the PO43− group was around 0.15 for MP seeded with DCP and exceeded 1 for the pH-adjusted samples. The absorbance was above 2 for the samples thermally treated at 60 °C for two hours, which is close but not equal to the value for HAP. The XRD analysis showed that the HAP produced from MP was not pure, with whitlockite coprecipitating. Overall, the XRD spectra confirmed that HAP formation was specifically induced by the precipitation of calcium phosphate in MP and ROMP.
SEM images of the powder generated through the various treatments were used to investigate the morphological differences between the minerals produced as a result of precipitation. As shown in Fig. 6, the particle size was not homogeneous for all samples and varied between 40 μm and 200 μm. The largest particles were those thermally treated with a pH adjusted to 8.0. Particles without any treatment were porous and of irregular shapes. The particles started growing geometrically upon DCP addition. At higher magnification (6000×), it was possible to see the particle morphology in detail. The mineral particles in MP and ROMP without precipitation were granular, and the amorphous structure was visible. The differences in the mineral structure observed in MP and ROMP for the same treatment might be due to higher mineral concentration and a stronger mineral network between the particles. As shown in the SEM images, both DCP seeding and increased pH affected the salts. Heat treatment did not change the morphology of particles but increased their size, which is in line with Trinkunaite-Felsen's study.15
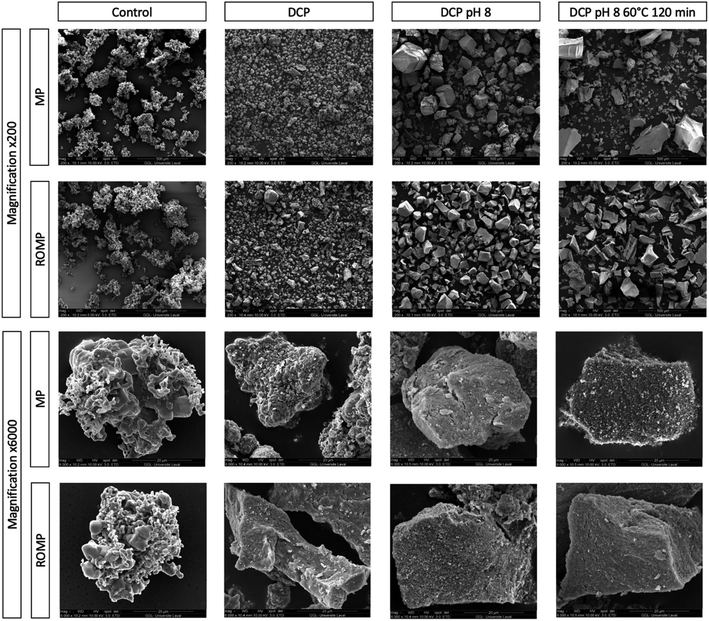 | ||
| Fig. 6 SEM images of MP and ROMP precipitated particles by treatment with 200× and 6000× magnification. | ||
As explained by Mostafa (2005), Spanos et al. (2007) and Djosic et al. (2008), the formation of HAP occurs in three different steps: (1) nucleation and growth of crystallites, (2) aggregation of crystals by physical attraction, and (3) crystal growth to form stable agglomerates. Spanos et al. have found (2007) that pH has a strong effect on calcium phosphate supersaturation.32,37,38 This is in agreement with the SEM images presented. As shown in Fig. 6, MP and ROMP particles have a nonhomogeneous crystal shape, contrasting with the more homogeneous, semispherical particle shape of synthetic HAP. Another study presented by Forero et al. (2018) showed that biological HAP has different particle sizes. The crystal growth and particle shape of HAP depend on the synthesis process parameters and the type of precursors used.39 pH has a significant impact on the morphological structure of HAP, and alkalinization is known to increase the size of HAP particles, which is in line with our results.40 A pH increased to more than 9.6 can cause particles to change shape and shift from rods to semispherical particles. This is partly due to an alteration in the electrical charge, which affects the distribution of the OH− ions.40
4 Conclusion
RO preconcentration of MP samples is an economically interesting option on various levels, especially with respect to the amount of chemicals used. For equal volumes of nonconcentrated MP and MP concentrated by RO to a concentration factor of 3, the same amount of DCP seeds was used, but the heating costs were lower for the concentrated MP. While adjusting the pH to 8.0 and heating at 60 °C increased the precipitation rate, the FTIR and DRX analysis results showed that alkalinization was efficient in inducing a change in the phase composition of calcium phosphate apatite, resulting in more complex forms of apatite such as HAP. Another critical aspect that should be investigated is how to further purify HAP.Abbreviations
| BOD | Biologic oxygen demand |
| DCP | Dicalcium phosphate |
| FTIR | Fourier transform infrared spectroscopy |
| HAP | Hydroxyapatite |
| ICP | Inductively coupled plasma |
| MP | Milk permeate |
| RO | Reverse osmosis |
| ROMP | Reverse osmosis milk permeate |
| SEM | Scanning electron microscopy |
| UF | Ultrafiltration |
| XRD | X-ray diffraction |
Author contributions
Conceptualization: Guillaume Brisson, Yves Pouliot, Nolwenn Paugam, Gabriel Remondetto; data curation: Nolwenn Paugam; formal analysis: Nolwenn Paugam, Thierry Maris; funding acquisition: Guillaume Brisson; investigation: Nolwenn Paugam, Guillaume Brisson; methodology: Nolwenn Paugam; project administration: Guillaume Brisson; resources: Guillaume Brisson, Gabriel Remondetto; software: Nolwenn Paugam, Thierry Maris; supervision: Guillaume Brisson; validation: Guillaume Brisson, Yves Pouliot, Gabriel Remondetto, Nolwenn Paugam; visualization: Nolwenn Paugam; writing – original draft: Nolwenn Paugam; writing – review & editing: Guillaume Brisson, Yves Pouliot, Thierry Maris, Gabriel Remondetto. All authors have read and agreed on the published version of the manuscript.Conflicts of interest
The authors declare that they have no conflict of interest. The funders had no role in the design of the study, in the collection, analysis or interpretation of data, in the writing of the manuscript or in the decision to publish the results.Acknowledgements
We would like to thank Diane Gagnon, Mélanie Martineau and Pascal Lavoie (Department of Food Sciences, Laval University) for their technical support throughout the project, Suzie Côté (Department of Geology and Geological Engineering, Laval University) for assisting us with the SEM analysis, and Thierry Maris (Department of Chemistry, University of Montréal) for helping us with XRD technology. We also extend our thanks to Agropur for providing the milk permeate required for this project and for running lactose HPLC analysis. The authors are grateful to Judith Laforest (Traductions Crescendo, Donnacona, QC, Canada) for editing this manuscript. This work was supported by the Quebec Ministère de l'Agriculture, des Pêcheries et de l'Alimentation (MAPAQ) through the Innov'Action program (No. IA119069).References
- F. Edimar Aparecida Filomeno, A. Yara Pereira Cerceau, F. Paulo Rogério and M. Valéria Paula Rodrigues, Tecnol. Aliment., 2015, 45, 342–348 Search PubMed.
- A. K. Slavov, Food Technol. Biotechnol., 2017, 55, 14–28 CAS.
- P. Menchik, T. Zuber, A. Zuber and C. I. Moraru, J. Dairy Sci., 2019, 102, 3978–3984 CrossRef CAS PubMed.
- F. Asunis, G. De Gioannis, P. Dessì, M. Isipato, P. N. L. Lens, A. Muntoni, A. Polettini, R. Pomi, A. Rossi and D. Spiga, J. Environ. Manage., 2020, 276, 111240 CrossRef CAS PubMed.
- R. P. Heaney, J. Am. Coll. Nutr., 2000, 19, 83S–99S CrossRef CAS PubMed.
- O. Mekmene, N. Leconte, T. Rouillon, S. Quillard, J. M. Bouler and F. D. R. Gaucheron, Int. J. Dairy Technol., 2012, 65, 334–341 CrossRef CAS.
- S. G. Anema, Dairy Sci. Technol., 2009, 89, 269–282 CrossRef CAS.
- European Food Safety Authority, EFSA J., 2015, 13(7), 4185 Search PubMed.
- C. L. Popa, Doctorate thesis, Université de Normandie, 2016 Search PubMed.
- H. Wu, D. Xu, M. Yang and X. Zhang, Langmuir, 2016, 32, 4643–4652 CrossRef CAS PubMed.
- M. Benaissa, Doctorate thesis, Université d'Oran, 2018 Search PubMed.
- G. Brulé, E. Real del Sol, J. Fauquant and C. Fiaud, J. Dairy Sci., 1978, 61, 1225–1232 CrossRef.
- Y. Pouliot, J. Landry and J. Giasson, Lait, 1991, 71, 313–320 CrossRef CAS.
- O. Mekmene, S. Quillard, T. Rouillon, J.-M. Bouler, M. Piot and F. Gaucheron, Dairy Sci. Technol., 2009, 89, 301–316 CrossRef CAS.
- J. Trinkunaite-Felsen, Z. Stankeviciute, J. C. Yang, T. C. K. Yang, A. Beganskiene and A. Kareiva, Ceram. Int., 2014, 40, 12717–12722 CrossRef CAS.
- J. Chamberland, S. Benoit, A. Doyen and Y. Pouliot, J. Water Proc. Eng., 2020, 38 Search PubMed.
- K. Gaid and Y. Treal, Desalination, 2007, 203, 1–14 CrossRef CAS.
- J. R. Euber and J. R. Brunner, J. Dairy Sci., 1979, 62, 685–690 CrossRef CAS.
- L. Berzina-Cimdina and N. Borodajenko, Infrared Phys. Technol., 2012, 12, 251–263 Search PubMed.
- T. Croguennec, R. Jeantet and P. Schuck, From Milk to Dairy Products, in Handbook of Food Science and Technology Vol. 3, ISTE Ltd., London, UK, Wiley, Hoboken, USA, 2016 Search PubMed.
- H. K. Vyas and P. S. Tong, J. Dairy Sci., 2003, 86, 2761–2766 CrossRef CAS PubMed.
- N. Vargas-Becerril, D. A. Sánchez-Téllez, L. Zarazúa-Villalobos, D. M. González-García, M. A. Álvarez-Pérez, C. de León-Escobedo and L. Téllez-Jurado, Ceram. Int., 2020, 46, 28806–28813 CrossRef CAS.
- C. Holt, Bull. Int. Dairy Fed., 1995, 2, 105–133 Search PubMed.
- H. E. Oh and H. C. Deeth, Int. Dairy J., 2017, 71, 89–97 CrossRef CAS.
- H. Nieuwenhuijse and T. Huppertz, Int. Dairy J., 2022, 126, 105220 CrossRef CAS.
- Y. Tahri, Doctorate thesis, Université de Lyon, 2016 Search PubMed.
- S. Raynaud, E. Champion, D. Bernache-Assollant and P. Thomas, Biomaterials, 2002, 23, 1065–1072 CrossRef CAS.
- N. N. Panova, Doctorate thesis, The University of Waikato, 2001.
- N. On-Nom, A. S. Grandison and M. J. Lewis, J. Dairy Sci., 2010, 93, 515–523 CrossRef CAS.
- J. Pellier, Doctorate thesis, École nationale Supérieure des Mines, 2012.
- F. Gaucheron, Y. Le Graët and P. Schuck, in Minéraux et produits laitiers, Tec & Doc Lavoisier, Paris, France, 2003, p. 922 Search PubMed.
- N. Spanos, A. Patis, D. Kanellopoulou, N. Andritsos and P. G. Koutsoukos, Cryst. Growth Des., 2007, 7, 25–29 CrossRef CAS.
- C. Holt, Eur. Biophys. J., 2004, 33, 421–434 CrossRef CAS PubMed.
- P. Walstra, P. Walstra, J. T. M. Wouters and T. J. Geurts, Dairy Science and Technology, Taylor & Francis Group, Baton Rouge, USA, 2005, p. 808 Search PubMed.
- M. J. Lewis, Int. J. Dairy Technol., 2011, 64, 1–13 CrossRef CAS.
- P. N. Kumta, C. Sfeir, D.-H. Lee, D. Olton and D. Choi, Acta Biomater., 2005, 1, 65–83 CrossRef.
- N. Y. Mostafa, Mater. Chem. Phys., 2005, 94, 333–341 CrossRef CAS.
- M. Djosic, V. Mišković-Stanković, S. Milonjic, Z. Kačarević-Popović, N. Bibić and J. Stojanović, Mater. Chem. Phys., 2008, 111, 137–142 CrossRef CAS.
- P. Forero, B. Segura-Giraldo, B. Garcia, E. Parra and P. J. Arango, Matéria, 2018, 23 DOI:10.1590/S1517-707620180004.0551.
- S. López-Ortiz, D. Mendoza-Anaya, D. Sánchez-Campos, M. E. Fernandez-García, E. Salinas-Rodríguez, M. I. Reyes-Valderrama and V. Rodríguez-Lugo, J. Nanomater., 2020, 2020, 5912592 Search PubMed.
| This journal is © The Royal Society of Chemistry 2022 |

