DOI:
10.1039/D2RA03017A
(Paper)
RSC Adv., 2022,
12, 32415-32428
Thermodynamic modeling of binary mixtures of ethylenediamine with water, methanol, ethanol, and 2-propanol by association theory†
Received
12th May 2022
, Accepted 31st October 2022
First published on 11th November 2022
Abstract
Association theories by statistical associating fluid theory (SAFT) and cubic plus association (CPA) equation of states (EoS) have effectively handled various thermodynamic purposes thus far; they consider hydrogen bonding effects in associating compounds (those with hydrogen bonds such as water and alcohols) in a proper way. The objective of this work is to thermodynamically undertake the study of ethylenediamine (EDA)–water, EDA–methanol, EDA–ethanol, and EDA–2-propanol binary mixtures in a manner to be useful for designing separation processes by CPA EoS. Accordingly, CPA EoS was applied to model vapor–liquid equilibrium (VLE) of several practical binary mixtures including EDA–water, EDA–methanol, EDA–ethanol, and EDA–2-propanol. It should be noted that the aforementioned mixtures are being studied by CPA EoS for the first time and necessary details are presented; two different association schemes (different situations for creating hydrogen bonds), 2B and 4C schemes, were considered for EDA. Water and studied alcohols were also modeled by 4C and 2B schemes, respectively. Moreover, the capability of two different combining rules (Elliot and CR-1) was evaluated. The azeotrope point available in the phase diagram of EDA–water system was correctly identified by CPA EoS. Furthermore, the liquid phase density of EDA–water was satisfactorily predicted by CPA EoS. It has also a high level of accuracy in VLE modeling of EDA–methanol, EDA–ethanol, and EDA–2-propanol mixtures. In the end, according to all provided results, it can be said that CPA EoS along with all required parameters obtained in this study is capable of describing thermodynamic behavior of studied mixtures.
1. Introduction
Ethylenediamine (EDA, ethanediamine) is an organic solvent which has a significant contribution in the production of drugs, emulsifiers, dyes, latexes stabilizers, plasticizers, motor oil additives, and fungicides.1 It is also widely used in the petrochemical industry.2 A binary mixture of EDA and water has also various applications; this mixed-solvent system serves as an appropriate medium for the production of nanomaterials by the solvothermal methods.3,4 Additionally, pure EDA and its mixture with water have shown a significant potential in absorbing undesirable gases such as SO2 and H2S.5 In addition to aqueous solutions of EDA, non-aqueous ones such as EDA–methanol and EDA–ethanol mixtures are of great importance in CO2 capturing.6 From another perspective, the separation of EDA and water has received the attraction of numerous researchers due to being a close relative volatility azeotropic mixture at atmospheric pressure.7–9 This mixture cannot be separated by a common distillation where other hybrid methods such as pressure-swing distillation, heterogeneous azeotropic distillation, and extractive distillation must be employed. In the latter, a separating agent, usually called entrainer, which is often a new component, is added to the system changing the relative volatilities of the original components desirably;7 methanol could be used as a light entrainer for the separating of EDA and water by extractive distillation.10 The above-mentioned statements highlight the necessity of applying a suitable thermodynamic model calculating the thermophysical properties of binary mixtures of EDA with water and alcohols. Particularly, the vapor–liquid equilibrium (VLE) of the mixtures should be properly calculated by the applied model. The VLE of EDA–water was satisfactorily modeled by universal quasichemical (UNIQUAC)11 equation at various pressures.12 The VLE of binary mixtures of several diamines with water was correctly modeled by the method of Barker which is based on the excess Gibbs function.13 Regarding binary mixtures of EDA with alcohols, Kato et al.14 reported the experimental VLE data for EDA and dipropylamine with methanol, ethanol, and 2-propanol; the VLE data were correlated by Wilson15 equation. From a thermodynamic point of view, it can be seen that these binary mixtures have not yet been studied adequately. Moreover, the aforementioned applied models are essentially based on γ–φ approach where the liquid phase is modeled by an activity coefficient model such as UNIQUAC11 and Wilson15 while the vapor phase is described by an equation of state (EoS).16,17 The approach is unable to calculate the density of liquid phase directly.18 On the other hand, both liquid and vapor phases are evaluated by an EoS in φ–φ approach.16,17 An EoS is fundamentally derived from Helmholtz energy and it is usually written in terms of pressure. In addition to calculating liquid density easily,19,20 any required thermodynamic property such as specific heat capacity and compressibility factor can be obtained by proper differentiating from Helmholtz energy.18 It is required to correctly take into account intermolecular forces for constructing an effective EoS where compounds with hydrogen bonds have complicated behavior. EDA can form hydrogen bonds among its own molecules with the aid of two available amino-groups (–NH2). It also can form hydrogen bonds with water molecules in the binary mixture of EDA–water.1 Alcohols are also known as a group possessing hydrogen bonds. Therefore, the proposed EoS for the binary mixtures of EDA with water and alcohols should take into consideration hydrogen bonding effects. Cubic plus association (CPA) EoS is a popular thermodynamic model that has successfully modeled a variety of non-ideal mixtures; association term in CPA EoS is specifically considered hydrogen bonding effects in associating components. It is worth noting that associating components refer to those with hydrogen bonds such as water and alcohols.21,22
To the best of our knowledge, the aforementioned systems suffer from the lack of a proper thermodynamic study and phase equilibria modeling by an effective and unified model which is vital for the practical purposes especially for designing separation processes and their feasibility study. The goal of this study is to thermodynamically undertake EDA–water, EDA–methanol, EDA–ethanol, and EDA–2-propanol binary mixtures in a manner to be useful for designing separation processes by CPA EoS. It is worth noting that an effective EoS such as CPA in addition to handling phase equilibria calculation, can calculate every desired thermophysical property of the mixture such as osmotic pressure which is significantly useful for designing organic solvent reverse osmosis and organic solvent forward osmosis processes.22 It should be noted that the aforementioned mixtures are being studied by CPA EoS for the first time and necessary details are presented.
2. Modeling
In CPA EoS, a simple EoS such as Soave–Redlich–Kwong (SRK) EoS23 is combined with an association term that takes into account hydrogen bonding effects. In terms of pressure, CPA EoS is given by eqn (1):24| |
 | (1) |
in eqn (1), v is the molar volume (m3 mol−1), ρ is the molar density (= 1/v), and b, T, and R are the co-volume parameter (m3 mol−1), temperature (K), and universal gas constant (= 8.314 J mol−1 K−1), respectively. The attractive parameter a (Pa m6 mol−2) is related to the critical temperature (Tc) as follows:24| |
 | (2) |
where a0 and c are constants. XAi is the mole fraction of molecule i which does not form hydrogen bonds at site A, which is defined by eqn (3).24| |
 | (3) |
The association strength ΔAiBj is calculated by eqn (4):24
| |
 | (4) |
where
ε and
β are the “association energy” and “association volume”, respectively.
g is the simplified radial distribution function which is calculated by
eqn (5):
24| |
 | (5) |
and
bij (
Fig. 20)
eqn (6):
| |
 | (6) |
In eqn (5), η is defined by the following expression (eqn (7)):24
| |
 | (7) |
In eqn (1) and (3), the summations  are done only over the sites. According to eqn (1)–(4), CPA EoS has five adjustable parameters for a pure associating component (a0, b, c, ε, and β), which are usually determined by fitting the experimental vapor pressure and liquid density data.
The conventional mixing rules were used in the cubic part to perform mixture calculations; they are given by eqn (8) and (9):24
| |
 | (8) |
| |
 | (9) |
where
kij is the binary interaction parameter (BIP) that is symmetric,
i.e.,
kij =
kji and
kii =
kjj = 0. The combining rules should be used dealing with the mixtures containing more than one associating compound such as EDA–water and EDA–methanol. Elliot and CR-1 are common combining rules whose capabilities were examined in this study; the CR-1 combining rule is given by
eqn (10) and
(11):
24| |
 | (10) |
| |
 | (11) |
and Elliot combining rules (ECR) is defined by
eqn (12):
24| |
 | (12) |
The BIP available in eqn (8) is usually determined by phase equilibria calculations such as VLE; it is actually adjusted to minimize the deviation between the model-calculated and experimental data.25
3. Results and discussion
3.1 Pure component
As mentioned previously, CPA has five constants for every pure associating component; the constants are dependent to the number of considered sites (scheme); 4C and 2B schemes showing there are four and two sites capable of forming hydrogen bonds, respectively. Further details about the schemes can be found elsewhere.26 It is worth noting that every pure associating component according to its structure could be modeled with more than one scheme; the best scheme is then selected. The CPA parameters of water, methanol, ethanol, and 2-propanol were provided by Kontogeorgis and Folas26 and reported in Table 1. To the best of our knowledge, EDA and the mixtures containing it have not yet studied by CPA EoS and this work aims to do so. According to Fig. 1, EDA has two lone electron pairs (electron donor) and four hydrogen atoms (electron acceptor) by which can form hydrogen bonds; among the defined schemes, 4C and 2B could be more suitable for EDA. These schemes are available in ESI.† The CPA parameters of EDA were obtained by minimizing the absolute average relative deviation (AARD) between the model-calculated and experimental vapor pressure and liquid molar volume (Table 2); AARD was calculated by eqn (13):| |
 | (13) |
In eqn (13), Scalci refers to model-calculated data while Sexpi is experimental data; NP is also the number of data points.
Table 1 CPA parameters for associating compounds26
| Compound |
Scheme |
Tc (K) |
a0 (Pa. (m3)2 mol−2) |
b (105) (m3 mol−1) |
c |
ε (Pa m3 mol−1) |
β |
| Water |
4C |
647.29 |
0.12277 |
1.4515 |
0.6736 |
16![[thin space (1/6-em)]](https://www.rsc.org/images/entities/char_2009.gif) 655 655 |
0.0692 |
| Methanol |
2B |
512.64 |
0.40531 |
3.0978 |
0.4310 |
24![[thin space (1/6-em)]](https://www.rsc.org/images/entities/char_2009.gif) 591 591 |
0.0161 |
| Ethanol |
2B |
513.92 |
0.86716 |
4.9100 |
0.7369 |
21![[thin space (1/6-em)]](https://www.rsc.org/images/entities/char_2009.gif) 532 532 |
0.008 |
| 2-Propanol |
2B |
508.30 |
1.06019 |
6.4110 |
0.9468 |
21![[thin space (1/6-em)]](https://www.rsc.org/images/entities/char_2009.gif) 000 000 |
0.0091 |
 |
| | Fig. 1 Molecular representation of ethylenediamine (EDA). | |
Table 2 CPA parameters for EDA obtained in this study (experimental data from ref. 27–29)
| Scheme |
Tc (K) |
T range (K) |
a0 (Pa (m3)2 mol−2) |
b (105) (m3 mol−1) |
c |
ε (Pa m3 mol−1) |
β |
AARD (P) |
AARD (vliq) |
| 2B |
613.1 |
283–464 |
1.00087 |
5.89932 |
1.39439 |
8455 |
0.4641 |
0.35 |
0.45 |
| 4C |
613.1 |
283–464 |
0.91523 |
5.96583 |
1.48337 |
5740 |
0.2022 |
0.34 |
0.66 |
It can be seen that from Table 2, both schemes have the same performance in calculating the vapor pressure and liquid molar volume of EDA. It is common that the mixture calculations show what scheme would be advantageous.21,26
3.2 Binary mixtures
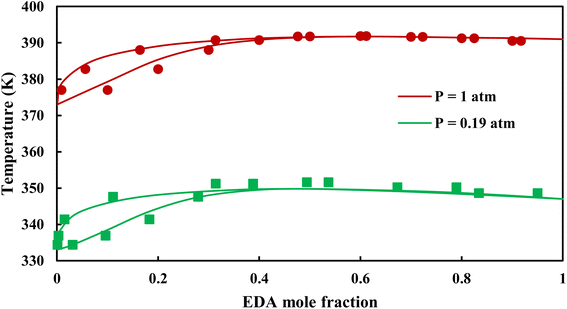
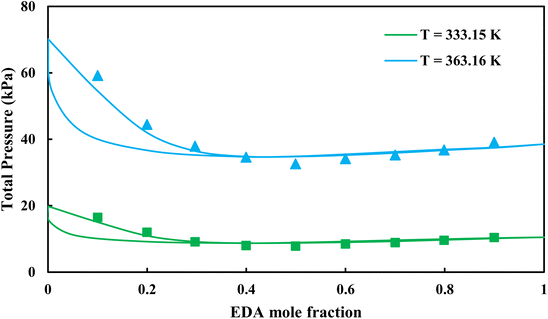
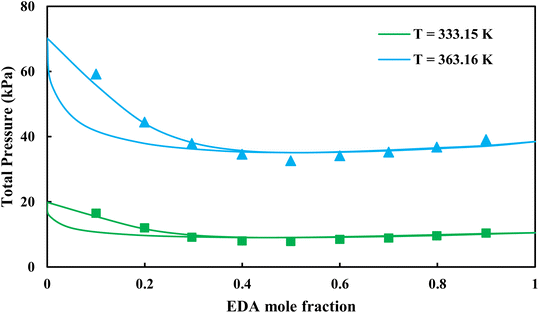
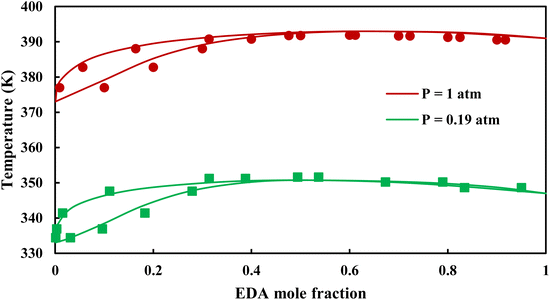
3.2.1. VLE calculation of EDA–water binary mixture. In this section; the potential of CPA EoS in correlating VLE experimental data of EDA–water binary system are extensively evaluated. For this purpose, both bubble point temperature calculation (Txy diagram) and bubble point pressure calculation (Pxy diagram) were performed by CPA EoS. In the bubble point temperature calculation, the BIP (kij) was adjusted in a manner to minimize the objective function (OF), OF = AARD (T) + Δy while in the bubble point pressure calculation, minimizing AARD (P) led to the optimized BIP. The optimized (adjusted) BIPs along with the calculated results by Eliott and CR-1 combining rules were presented in Tables 3 and 4, respectively; the results of 2B and 4C schemes were also provided. It can be seen that both schemes for EDA have almost the same performance. However, the BIPs of 4C scheme have lower absolute values which is superior from a thermodynamic viewpoint; BIPs are adjustable parameters which are generally obtained by minimizing an objective function. It means that their absolute values are mathematically meaningful rather than physically. According to the literature,24,30 it can be seen that the absolute values of BIPs decrease as the EoS's nature becomes more compatible with the physics of the problem. Therefore, it can be concluded that in case of water–EDA binary mixture 4C scheme is more compatible with the physics of problem. Concerning the capability of applied combining rules, although both combining rules show the practically similar performance, CR-1 has lower absolute BIPs values for both schemes of EDA. Some typical graphical representations of acquired results were also provided in Fig. 2–9; The EDA–water binary mixture has an azeotrope point at atmospheric and sub-atmospheric pressures. From the separation point of view specially distillation, the study of atmospheric pressure is extremely important whose results are available in Fig. 2, 3, 6 and 7. Moreover, for the further evaluation, a pressure of 0.19 atm was also studied; to the best of our knowledge, it is the lowest pressure for which experimental data have been reported in literature. Additionally, numerous temperatures (a wide range of temperature) were investigated in the bubble point pressure calculation. According to the all provided figures, the azeotrope point was properly described by CPA EoS.
Table 3 EDA–water correlation results by CPA EoS using ECR (experimental data from ref. 12, 13 and 28)
| Number of data points |
T (K) |
P (atm) |
EDA as 2B |
EDA as 4C |
| kij |
AARD (T) |
AARD (P) |
Δyb |
kij |
AARD (T) |
AARD (P) |
Δyb |
There was no experimental data.  |
| 8 |
— |
0.19 |
−0.59 |
0.40 |
— |
3.72 |
−0.50 |
0.32 |
— |
3.69 |
| 9 |
— |
1.00 |
−0.59 |
0.31 |
— |
2.12 |
−0.50 |
0.21 |
— |
1.73 |
| 9 |
293.15 |
— |
−0.59 |
— |
11.09 |
n.a.a |
−0.50 |
— |
12.37 |
n.a.a |
| 9 |
303.15 |
— |
−0.59 |
— |
10.26 |
n.a.a |
−0.50 |
— |
11.32 |
n.a.a |
| 9 |
313.15 |
— |
−0.59 |
— |
9.47 |
n.a.a |
−0.50 |
— |
10.25 |
n.a.a |
| 9 |
323.15 |
— |
−0.59 |
— |
8.46 |
n.a.a |
−0.50 |
— |
9.05 |
n.a.a |
| 9 |
333.15 |
— |
−0.59 |
— |
7.31 |
n.a.a |
−0.50 |
— |
7.71 |
n.a.a |
| 9 |
343.15 |
— |
−0.59 |
— |
6.07 |
n.a.a |
−0.50 |
— |
6.25 |
n.a.a |
| 9 |
353.15 |
— |
−0.59 |
— |
5.05 |
n.a.a |
−0.50 |
— |
4.71 |
n.a.a |
| 9 |
363.15 |
— |
−0.59 |
— |
4.00 |
n.a.a |
−0.50 |
— |
3.22 |
n.a.a |
![[thin space (1/6-em)]](https://www.rsc.org/images/entities/char_2009.gif) |
| Average |
|
|
|
0.36 |
7.71 |
2.92 |
|
0.27 |
8.11 |
2.71 |
Table 4 EDA–water correlation results by CPA EoS using CR-1 (experimental data from ref. 12, 13 and 28)
| Number of data points |
T (K) |
P (atm) |
EDA as 2B |
EDA as 4C |
| kij |
AARD (T) |
AARD (P) |
Δyb |
kij |
AARD (T) |
AARD (P) |
Δyb |
There was no experimental data.  |
| 8 |
— |
0.19 |
−0.52 |
0.23 |
— |
3.31 |
−0.39 |
0.23 |
— |
3.72 |
| 9 |
— |
1.00 |
−0.52 |
0.42 |
— |
1.08 |
−0.39 |
0.49 |
— |
1.48 |
| 9 |
293.15 |
— |
−0.52 |
— |
9.73 |
n.a.a |
−0.39 |
— |
12.36 |
n.a.a |
| 9 |
303.15 |
— |
−0.52 |
— |
8.88 |
n.a.a |
−0.39 |
— |
10.86 |
n.a.a |
| 9 |
313.15 |
— |
−0.52 |
— |
7.76 |
n.a.a |
−0.39 |
— |
9.20 |
n.a.a |
| 9 |
323.15 |
— |
−0.52 |
— |
6.61 |
n.a.a |
−0.39 |
— |
7.62 |
n.a.a |
| 9 |
333.15 |
— |
−0.52 |
— |
5.43 |
n.a.a |
−0.39 |
— |
6.08 |
n.a.a |
| 9 |
343.15 |
— |
−0.52 |
— |
4.23 |
n.a.a |
−0.39 |
— |
4.87 |
n.a.a |
| 9 |
353.15 |
— |
−0.52 |
— |
3.24 |
n.a.a |
−0.39 |
— |
4.35 |
n.a.a |
| 9 |
363.15 |
— |
−0.52 |
— |
3.02 |
n.a.a |
−0.39 |
— |
3.98 |
n.a.a |
![[thin space (1/6-em)]](https://www.rsc.org/images/entities/char_2009.gif) |
| Average |
|
|
|
0.33 |
6.11 |
2.20 |
|
0.36 |
7.42 |
2.60 |
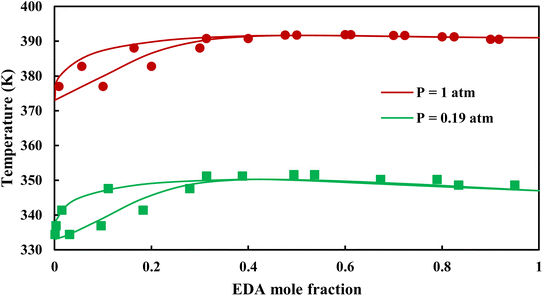 |
| | Fig. 2 Txy diagram of EDA–water by CPA EoS using ECR, and EDA with 2B scheme (solid lines) and experimental data12,28 (points). | |
 |
| | Fig. 3 Txy diagram of EDA–water by CPA EoS using ECR, and EDA with 4C scheme (solid lines) and experimental data12,28 (points). | |
 |
| | Fig. 4 Pxy diagram of EDA–water by CPA EoS using ECR, and EDA with 2B scheme (solid lines) and experimental data13 (points). | |
 |
| | Fig. 5 Pxy diagram of EDA–water by CPA EoS using ECR, and EDA with 4C scheme (solid lines) and experimental data13 (points). | |
 |
| | Fig. 6 Txy diagram of EDA–water by CPA EoS using CR-1, and EDA with 2B scheme (solid lines) and experimental data12,28 (points). | |
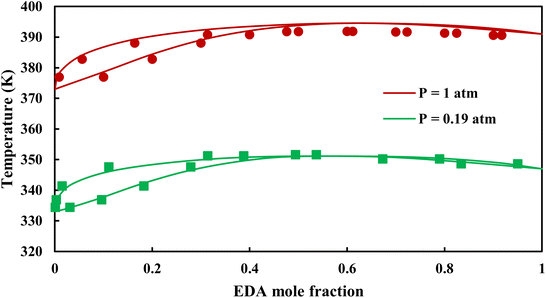 |
| | Fig. 7 Txy diagram of EDA–water by CPA EoS using CR-1, and EDA with 4C scheme (solid lines) and experimental data12,28 (points). | |
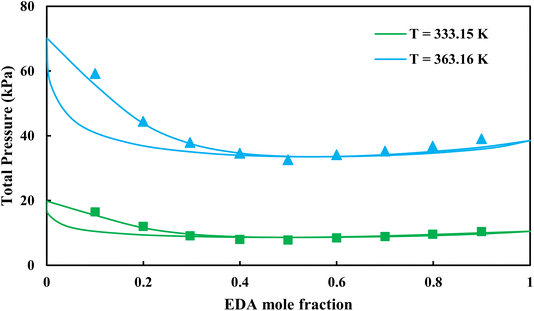 |
| | Fig. 8 Pxy diagram of EDA–water by CPA EoS using CR-1, and EDA with 2B scheme (solid lines) and experimental data13 (points). | |
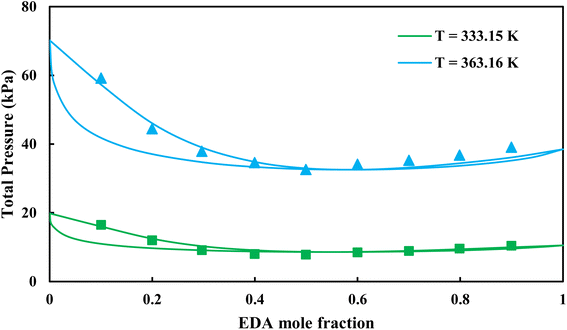 |
| | Fig. 9 Pxy diagram of EDA–water by CPA EoS using CR-1, and EDA with 4C scheme (solid lines) and experimental data13 (points). | |
3.2.2. Study of EDA–heptane binary mixture. One method for examining the competency of CPA (pure-component) parameters of an amine is to apply the liquid–liquid equilibrium (LLE) for that and an inert hydrocarbon.31 To the best of our knowledge, there are no LLE experimental data for EDA and alkanes in the literature. However, the data for infinite dilution activity coefficient of EDA–heptane binary mixture at T = 328.15 K and T = 343.15 K were reported by Pividal and Sandler.32 It should be stated that the prediction of the infinite dilution activity coefficient is a strict criterion to evaluate the performance of an EoS.33 The infinite dilution activity coefficient of a solute in a solvent, γi∞, is obtained by eqn (14):34| |
 | (14) |
where φiL(T, P, xi) is the liquid phase fugacity coefficient of the solute in the mixture, and xi is the mole fraction of the solute. φiL, 0(T, P) also refers to the fugacity coefficient of the pure solute in real or hypothetical liquid state. The calculated results applying CPA EoS by both schemes for EDA were presented in Fig. 10 and 11; Fig. 10 shows the infinite dilution activity coefficient of heptane in EDA–water system while Fig. 11 is related to infinite dilution activity coefficient of EDA at the same binary mixture. It is obviously that 4C produced more accurate results for infinite dilution activity coefficient of heptane (Fig. 10). However, the comparison cannot easily be made between 2B and 4C schemes for infinite dilution activity coefficient of EDA (Fig. 11) and the calculated AARDs show what scheme would be more beneficial in this regard. The AARDs between experimental and model-calculated data for the infinite dilution activity coefficient of heptane are 1.43% and 0.56% by 2B and 4C, respectively; they are respectively 11.00% and 11.10% for the infinite dilution activity coefficient of EDA. Therefore, in this situation, it can be said that 4C scheme is rather more advantageous.
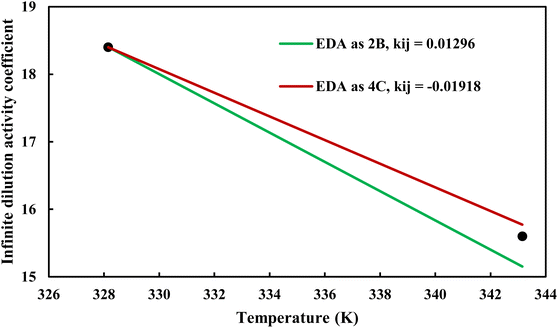 |
| | Fig. 10 Infinite dilution activity coefficient of heptane in EDA–heptane system by CPA EoS using 2B and 4C schemes (solid lines) and experimental data32 (points). | |
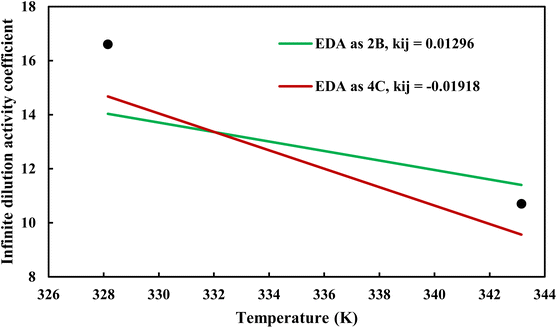 |
| | Fig. 11 Infinite dilution activity coefficient of EDA in EDA–heptane system by CPA EoS using 2B and 4C schemes (solid lines) and experimental data32 (points). | |
3.2.4. VLE calculation of EDA–alcohol systems. In this section; the potential of CPA EoS in correlating VLE experimental data of EDA–alcohols binary systems are investigated. The bubble point temperature calculation was performed at P = 98.66 kPa for methanol–EDA, ethanol–EDA, and 2-propanol–EDA. The obtained results applying CPA EoS by both combining rules and both schemes for EDA were given in Tables 6–9. As can be seen, both combining rules as well as both schemes for EDA have almost the same accuracy; their BIPs are also very close to each other. Therefore, in case of binary mixtures of EDA and studied alcohols there is no priority among the examined combining rules and schemes.
Table 6 EDA–alcohol correlation results by CPA EoS using ECR (experimental data from ref. 14)
| System |
Number of data points |
P (kPa) |
EDA as 4C |
| kij |
AARD T |
Δya |
 |
| Methanol–EDA |
9 |
98.66 |
−0.22 |
0.30 |
0.68 |
| Ethanol–EDA |
9 |
98.66 |
−0.14 |
0.38 |
1.28 |
| 2-Propanol–EDA |
9 |
98.66 |
−0.12 |
0.34 |
1.64 |
![[thin space (1/6-em)]](https://www.rsc.org/images/entities/char_2009.gif) |
| Average |
|
|
|
0.34 |
1.20 |
Table 7 EDA–alcohol correlation results by CPA EoS using CR-1 (experimental data from ref. 14)
| System |
Number of data points |
P (kPa) |
EDA as 4C |
| kij |
AARD T |
Δya |
 |
| Methanol–EDA |
9 |
98.66 |
−0.19 |
0.33 |
0.81 |
| Ethanol–EDA |
9 |
98.66 |
−0.13 |
0.40 |
1.27 |
| 2-Propanol–EDA |
9 |
98.66 |
−0.10 |
0.34 |
1.56 |
![[thin space (1/6-em)]](https://www.rsc.org/images/entities/char_2009.gif) |
| Average |
|
|
|
0.36 |
1.21 |
Table 8 EDA–alcohol correlation results by CPA EoS using ECR (experimental data from ref. 14)
| System |
Number of data points |
P (kPa) |
EDA as 2B |
| kij |
AARD T |
Δya |
 |
| Methanol–EDA |
9 |
98.66 |
−0.24 |
0.26 |
0.59 |
| Ethanol–EDA |
9 |
98.66 |
−0.14 |
0.40 |
1.32 |
| 2-Propanol–EDA |
9 |
98.66 |
−0.11 |
0.36 |
1.63 |
![[thin space (1/6-em)]](https://www.rsc.org/images/entities/char_2009.gif) |
| Average |
|
|
|
0.34 |
1.18 |
Table 9 EDA–alcohol correlation results by CPA EoS using CR-1 (experimental data from ref. 14)
| System |
Number of data points |
P (kPa) |
EDA as 2B |
| kij |
AARD T |
Δya |
 |
| Methanol–EDA |
9 |
98.66 |
−0.22 |
0.32 |
0.74 |
| Ethanol–EDA |
9 |
98.66 |
−0.13 |
0.40 |
1.28 |
| 2-Propanol–EDA |
9 |
98.66 |
−0.11 |
0.35 |
1.63 |
![[thin space (1/6-em)]](https://www.rsc.org/images/entities/char_2009.gif) |
| Average |
|
|
|
0.36 |
1.22 |
The graphical representation of results was also provided in Fig. 15–20. As can be seen, all three studied systems were precisely modeled by CPA EoS using both combining rules.
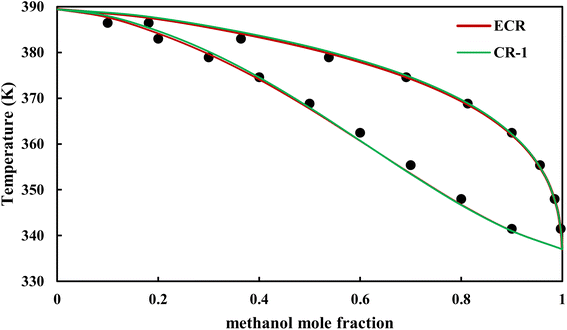 |
| | Fig. 15 Txy diagram of methanol–EDA by CPA EoS (EDA with 4C scheme) at P = 98.66 kPa, experimental data from ref. 14 (points). | |
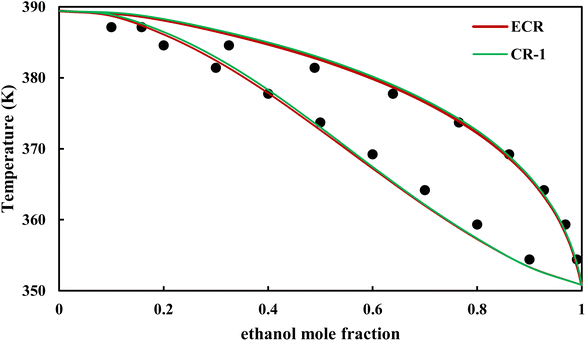 |
| | Fig. 16 Txy diagram of ethanol–EDA by CPA EoS (EDA with 4C scheme) at P = 98.66 kPa, experimental data from ref. 14 (points). | |
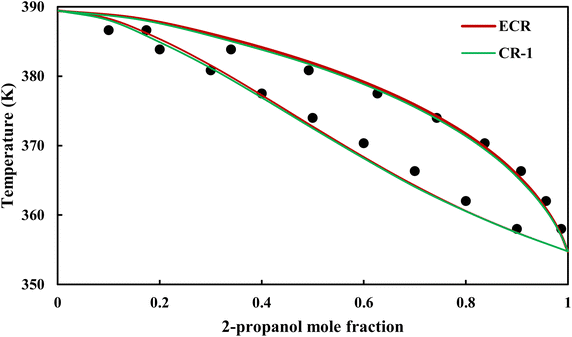 |
| | Fig. 17 Txy diagram of 2-propanol–EDA by CPA EoS (EDA with 4C scheme) at P = 98.66 kPa, experimental data from ref. 14 (points). | |
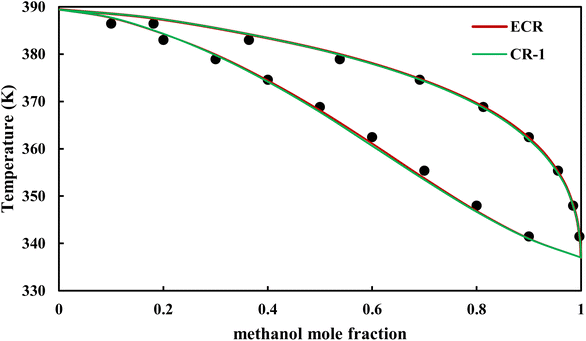 |
| | Fig. 18 Txy diagram of methanol–EDA by CPA EoS (EDA with 2B scheme) at P = 98.66 kPa, experimental data from ref. 14 (points). | |
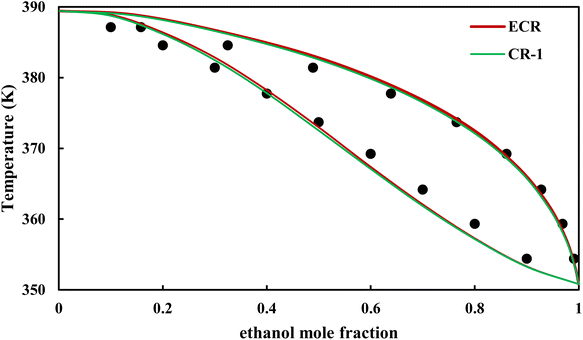 |
| | Fig. 19 Txy diagram of ethanol–EDA by CPA EoS (EDA with 2B scheme) at P = 98.66 kPa, experimental data from ref. 14 (points). | |
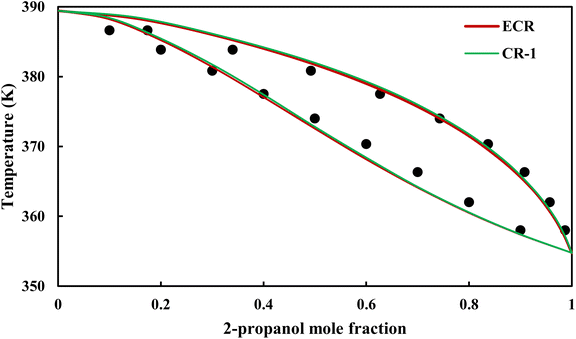 |
| | Fig. 20 Txy diagram of 2-propanol–EDA by CPA EoS (EDA with 2B scheme) at P = 98.66 kPa, experimental data from ref. 14 (points). | |
4. Conclusion
A thermodynamic model would be effective when its nature is compatible with the involved components. Additionally, its pure-compound constants and binary interaction parameters (BIPs) must be correctly determined to be useful for practical purposes; the vapor–liquid equilibrium (VLE) calculations in addition to being crucial for distillation design, result in such constants and parameters. A suitable thermodynamic model thanks to reliable constants and BIPs can properly calculate various thermophysical properties of studied system such as the osmotic pressure of organic liquid mixtures at any desired temperature, pressure, and composition; the proper osmotic pressures of organic liquid mixtures are required for their separations using organic solvent reverse osmosis and organic solvent forward osmosis. Among different thermodynamic models, cubic plus association (CPA) equation of state (EoS) has been constructed to specifically handle the systems dealing with the components with hydrogen bonds. In this study, CPA EoS was applied for the first time to extensively study the VLE of ethylenediamine (EDA)–water, EDA–methanol, EDA–ethanol, and EDA–2-propanol owing to their numerous applications. Two associations schemes (4C and 2B) were considered for EDA. However, water and studied alcohols were modeled by 4C and 2B schemes, respectively. Moreover, the capability of two combining rules (Elliot and CR-1) was also investigated.
The EDA–water binary mixture has an azeotrope point at atmospheric and sub-atmospheric pressures. From the separation point of view specially distillation, the study of atmospheric pressure is extremely important; the azeotrope point was properly described by CPA EoS applying different schemes and combining rules. However, the BIPs of 4C scheme have lower absolute values which is superior from a thermodynamic viewpoint. Concerning the capability of applied combining rules, although both combining rules show the practically similar performance, CR-1 has lower absolute BIPs values for both schemes of EDA. EDA–heptane binary mixture was also studied in terms of infinite dilution activity coefficient where in this situation 4C scheme showed a relative advantage. However, in case of binary mixtures of EDA and studied alcohols, the performance of different schemes and combining rules were almost the same.
In the end, it can be said that CPA EoS with the aid of presented information in this study (proposed schemes along with the calculated constants and BIPs) is capable of describing thermodynamic behavior of studied systems and consequently determining their thermophysical properties for the practical purposes.
Conflicts of interest
There are no conflicts to declare.
Nomenclature
List of symbols
| a | Temperature dependent attractive term parameter (Pa m6 mol−2) |
| b | Co-volume independent-temperature parameter (m3 mol−1) |
| f | Fugacity of a pure compound |
| fi | Fugacity of component i in the mixture |
| H | Henry's law constant (Pa) |
| kij | Binary interaction parameter |
| ni | The moles number of component i |
| P | Pressure (Pa) |
| R | Universal gas constant (J mol−1 K−1) |
| T | Temperature (K) |
| Tc | Critical temperature (K) |
| Pc | Critical pressure (Pa) |
| v | Molar volume (m3 mol−1) |
| XAi | Mole fraction of the molecule i which does not form bonds at site A |
| xi | Mole fraction of component i in the liquid mixture |
| yi | Mole fraction of component i in the vapor mixture |
Abbreviations
| BIP | Binary interaction parameter |
| CPA: | Cubic plus association |
| EoS | Equation of state |
| Np | Number of points |
| SRK | Soave–Redlich–Kwong |
| VLE | Vapor–liquid equilibrium |
Superscripts
| cal | Calculated |
| exp | Experimental |
| l | Liquid |
| v | Vapor |
Subscripts
Greek letters
| β | Association energy |
| ε | Association volume (Pa m3 mol−1) |
| Δ | Association strength |
| ρ | Density (kg m−3) |
| φ | Fugacity coefficient |
| γ | Activity coefficient |
Acknowledgements
This work was partially supported by Kobe University Strategic International Collaborative Research Grant (Type B Fostering Joint Research). Hossein Jalaei Salmani was also partially supported by a grant from Ferdowsi University of Mashhad (No. FUM-14002794075).
References
- G. I. Egorov and D. M. Makarov, J. Mol. Liq., 2017, 239, 68–73 CrossRef CAS.
- G. I. Egorov, D. M. Makarov and A. M. Kolker, Thermochim. Acta, 2016, 639, 148–159 CrossRef CAS.
- A. Phuruangrat, T. Thongtem and S. Thongtem, Mater. Lett., 2009, 63, 1538–1541 CrossRef CAS.
- S. K. Panda, S. Gorai and S. Chaudhuri, J. Mater. Sci. Eng. B, 2006, 129, 265–269 CrossRef CAS.
- Y. Niu, C. Li, J. Shen and X. Wei, J. Cleaner Prod., 2018, 171, 506–511 CrossRef CAS.
- S. Kadiwala, A. V. Rayer and A. Henni, Chem. Eng. J., 2012, 179, 262–271 CrossRef CAS.
- M. Ferchichi, L. Hegely and P. Lang, Energy, 2022, 239, 122608 CrossRef CAS.
- H. Yu, Q. Ye, H. Xu, X. Dai, X. Suo and R. Li, Chem. Eng. Process., 2015, 97, 84–105 CrossRef CAS.
- G. Modla and P. Lang, Chem. Eng. Sci., 2008, 63, 2856–2874 CrossRef CAS.
- I. Rodriguez-Donis, V. Gerbaud and X. Joulia, Ind. Eng. Chem. Res., 2011, 51, 4643–4660 CrossRef.
- D. S. Abrams and J. M. Prausnitz, AIChE J., 1975, 21, 116–128 CrossRef CAS.
- Å. U. Burman and K. H. Ström, J. Chem. Eng. Data, 2013, 58, 257–263 CrossRef.
- N. C.-B. Ahmed, L. Negadi, I. Mokbel and J. Jose, J. Chem. Thermodyn., 2011, 43, 719–724 CrossRef CAS.
- M. Kato and H. Tanaka, J. Chem. Eng. Data, 1989, 34, 203–206 CrossRef CAS.
- G. M. Wilson, J. Am. Chem. Soc., 1964, 86, 127–130 CrossRef CAS.
- K. Lakzian, S. Hosseiniallahchal, H. Jalaei Salmani and A. Sanjarifard, Thermochim. Acta, 2020, 691, 178719 CrossRef CAS.
- H. Jalaei Salmani, M. N. Lotfollahi and S. H. Mazloumi, Process Saf. Environ. Prot., 2018, 119, 191–197 CrossRef CAS.
- H. Jalaei Salmani, M. N. Lotfollahi and S. H. Mazloumi, J. Mol. Liq., 2020, 310, 113067 CrossRef CAS.
- K. Lakzian and H. Jalaei Salmani, J. Mol. Liq., 2021, 324, 114681 CrossRef CAS.
- E. Mansouri, H. Jalaei Salmani, A. Davoodabadi and A. Hernández, J. Mol. Liq., 2022, 357, 119016 CrossRef CAS.
- A. Pourabadeh, A. Sanjari Fard and H. Jalaei Salmani, J. Mol. Liq., 2020, 307, 112980 CrossRef CAS.
- H. Jalaei Salmani, H. Karkhanechi, S. Jeon and H. Matsuyama, J. Ind. Eng. Chem., 2022, 109, 137–146 CrossRef CAS.
- G. Soave, Chem. Eng. Sci., 1972, 27, 1197–1203 CrossRef CAS.
- G. M. Kontogeorgis and G. K. Folas, Thermodynamic Models for Industrial Applications: From Classical and Advanced Mixing Rules to Association Theories, John Wiley & Sons, 2009 Search PubMed.
- H. Jalaei Salmani, M. N. Lotfollahi and S. H. Mazloumi, J. Mol. Liq., 2020, 297, 111879 CrossRef CAS.
- G. M. Kontogeorgis and G. K. Folas, Thermodynamic Models for Industrial Applications: From Classical and Advanced Mixing Rules to Association Theories, John Wiley & Sons, Chichester, United Kingdom, 1st edn, 2010 Search PubMed.
- Å. U. Burman and K. H. Ström, J. Chem. Eng. Data, 2008, 53, 2307–2310 CrossRef.
- M. Hirata, S. Suda, T. Hakuta and K. Nagahama, J. Chem. Eng. Jpn., 1969, 2, 143–149 CrossRef CAS.
- C. Yaws, The Yaws Handbook of Vapor Pressure: Antoine Coefficients, Gulf Professional Publishing, 2015 Search PubMed.
- A. Danesh, PVT and Phase Behaviour of Petroleum Reservoir Fluids, Elsevier, 1998 Search PubMed.
- A. S. Avlund, D. K. Eriksen, G. M. Kontogeorgis and M. L. Michelsen, Fluid Phase Equilib., 2011, 306, 31–37 CrossRef CAS.
- K. A. Pividal and S. I. Sandler, J. Chem. Eng. Data, 2002, 35, 53–60 CrossRef.
- T.-B. Nguyen, J.-C. De Hemptinne, B. Creton and G. M. Kontogeorgis, Ind. Eng. Chem. Res., 2013, 52, 7014–7029 CrossRef CAS.
- C. S. Schacht, L. Zubeir, T. W. de Loos and J. Gross, Ind. Eng. Chem. Res., 2010, 49, 7646–7653 CrossRef CAS.
|
| This journal is © The Royal Society of Chemistry 2022 |
Click here to see how this site uses Cookies. View our privacy policy here.  Open Access Article
 a,
Hamed Karkhanechi
 *a,
Mohammad Reza Moradi
 b and
Hideto Matsuyama
 c
c


 are done only over the sites. According to eqn (1)–(4), CPA EoS has five adjustable parameters for a pure associating component (a0, b, c, ε, and β), which are usually determined by fitting the experimental vapor pressure and liquid density data.


![[thin space (1/6-em)]](https://www.rsc.org/images/entities/char_2009.gif) 655
655![[thin space (1/6-em)]](https://www.rsc.org/images/entities/char_2009.gif) 591
591![[thin space (1/6-em)]](https://www.rsc.org/images/entities/char_2009.gif) 532
532![[thin space (1/6-em)]](https://www.rsc.org/images/entities/char_2009.gif) 000
000
![[thin space (1/6-em)]](https://www.rsc.org/images/entities/char_2009.gif)

![[thin space (1/6-em)]](https://www.rsc.org/images/entities/char_2009.gif)


