 Open Access Article
Determination of heavy metals in water using an FTO electrode modified with CeO2/rGO nanoribbons prepared by an electrochemical method
Nan Zhao a,
Lu Renb,
Guangyi Dua,
Jing Liua and
Xueqiu You*a
aSchool of Ocean Information Engineering, Jimei University, Xiamen, 361021, China. E-mail: youxueqiuqqq@126.com
bNorthwest Engineering Corporation Limited, PowerChina, Xi'an, 710065, China
First published on 8th August 2022
Abstract
The rGO/CeO2/FTO nanocomposite modified electrode was prepared by an electrochemical method. A simple and highly sensitive electrochemical sensing platform for electrochemical rGO and modified CeO2 nanoribbons directly on FTO electrodes was developed. Simultaneous determination of Pb2+ and Cd2+ used the differential pulse anodic stripping voltammetry (DPASV) method. The method was simple to operate, and CeO2 nanobelts could be obtained simultaneously by electrodeposition and reduction of GO without further processing. This is an environmentally friendly electrochemical method to obtain modified electrodes under mild conditions. The experimental results showed that the linear calibration curves of Pb2+ and Cd2+ are 1–300 and 0.2–500 μg L−1, respectively. At the same time, no interference from other coexisting metal ions was found during the detection process, which proved that the modified electrode had good stability and repeatability.
Introduction
The continuous development of science and technology and their increasingly far-reaching impact on daily life are everywhere, from simple food, clothing, housing, and transportation to complex energy development and utilization and environmental protection. The application of nano-semiconductor materials has penetrated all life aspects,1,2 such as in wastewater treatment, air purification, antibacterial, and anti-fog agents.Because nanometal oxide has unique physical, chemical, and magnetic properties, it has received extensive attention. Such oxides are suitable for many field applications,3 including catalysis, gas sensing and separation, power storage and generation, and biology and medicine.4,5 Researchers have applied the functional properties of nanometal oxide films in different fields,6–8 such as photovoltaic cells,9 gas sensors,10 and biosensors.11 Due to nanofilm's excellent structural properties, such as highly ordered structure, high surface area, pore structure, moderate pore size range, and pore distribution, researchers have conducted several investigations to synthesize, characterize, and apply these uniform porous materials to catalysis, adsorption, and sensing in the past decade.12,13
Graphene is a carbon nanomaterial with a two-dimensional structure composed of two-dimensional single-layer sp2 hybridized carbon atoms. Its large specific surface area,14 high electrical conductivity,15 excellent electrocatalytic activity,16 good mechanical flexibility,17 and low cost18 make it the best candidate material for modified electrodes for electrochemical sensors. However, graphene is prone to aggregation, which reduces its available surface area and adsorption capacity. Therefore, combining graphene with other materials is necessary to improve its electrochemical performance.
CeO2 is one of the most important rare earth materials. Due to its nontoxicity, low cost, strong ability to store, release, and transport oxygen, and electrocatalytic performance, it has been widely used in fuel cells, sensors, supercapacitors, and other fields.19,20 These CeO2 characteristics are mainly related to the relationship between its two valence states, Ce3+ and Ce4+, and their structure and morphology.21 Therefore, if graphene and nanostructured CeO2 are used in electrochemical sensors, the presence of metal ions is expected to improve the detection performance of electrochemical sensors.
Based on this, we prepared a CeO2/GO/FTO composite nanomaterial-modified electrode to detect heavy metal ions Pb2+. This work aims to improve the analytical performance and create a sensitive and environmentally friendly electrochemical platform. We first electrochemically reduced graphene oxide (GO) directly to reduced graphene oxide (rGO), simultaneously fabricated CeO2 nanoribbons and reduced graphene oxide using cathodic electrodeposition to form nanocomposites. Cd2+ and Pb2+ were measured using DPASV. This method can control the thickness of CeO2/GO nanocomposites. The modified composite electrode has a larger active surface area and higher conductivity. The experimental results show that the composite electrode has a good volt-ampere response to Pb2+ and Cd2+. This novel, fast, and sensitive electrochemical sensor can be used to detect Pb2+ and Cd2+ in actual water samples.
Experimental
Reagent
The chemicals used in the experiment are all analytical reagent grade and were used without further purification. Metal ions Pb2+ and Cd2+, sodium acetate trihydrate, glacial acetic acid (99.5%), disodium hydrogen phosphate dodecahydrate, and sodium dihydrogen phosphate dihydrate were all purchased from Sinopharm Chemical Reagent Co. Ltd (China). Cerium(III) nitrate hexahydrate (Ce(NO3)3·6H2O) (99% purity) was purchased from Aladdin. GO was purchased from Xianfeng Nanomaterials Co. Ltd A phosphate buffer solution (10 mM, pH = 7, PBS) was obtained by mixing appropriate amounts of disodium hydrogen and sodium dihydrogen phosphates. Prepare an acetate buffer solution (0.1 M, pH = 5, ABS) by mixing an appropriate amount of 0.1 M sodium acetate and 0.1 M acetic acid. All solutions were prepared with ultrapure water (millipore, 18 MΩ cm−1).Instrument
The electrochemical test is carried out on a CHI 660E using a three-electrode system. FTO conductive glass (10 mm × 25 mm, SuZhou ShangYang Solar Technology Co. Ltd) was used as the working electrode. Ag/AgCl and platinum wire were used as the reference and counter electrodes, respectively. A field emission scanning electron microscope (FEI Apero S) was used to examine the morphology and structure of rGO and rGO/CeO2 composites. The crystal characteristics of the sample are characterized by X-ray powder diffraction (XRD; SmartLab-SE).Preparation of modified electrodes
The graphite oxide powder was peeled off into an aqueous solution by ultrasonic treatment to obtain 0.5 mg mL−1 GO suspension. The suspension was dropped onto a clean FTO conductive glass. Before using, the FTO was ultrasonically cleaned with double distilled water, acetone, and ethanol and dried with nitrogen. Under magnetic stirring, cyclic voltammetry (CV) at a rate of 100 mV s−1 between −1.8 to −0.6 V was used to electrochemically reduce GO on the GO/FTO electrode surface to obtain rGO. Simultaneously, CeO2 nanoribbons were deposited on the surface. After electrochemical reduction, the working electrode was washed with double distilled water and dried under an infrared heating lamp for 5 min for subsequent experiments.DPASV analysis program
Heavy metal ions were analyzed using DPASV in a 0.1 M acetate buffer solution. rGO/CeO2/FTO, Ag/AgCl, and Pt wire electrodes were immersed in an electrochemical cell containing 0.1 M acetate buffer (pH 4.5), and the target metal ions were added. A voltage of −0.7 V under stirring was used as the preconcentration voltage, and the target metal was reduced on the working electrode surface by pretreating for 150 s.After 10 s of equilibration, the DPASV potential was scanned from −1.0 to 0 V. Then, a voltage of 0.3 V was used to perform a 60 s cleaning step before the next cycle in a fresh supporting electrolyte while stirring to remove the target metal. (All potentials relative to the Ag/AgCl electrode are given.)
Results and discussion
Preparation of CeO2/rGO/FTO nanocomposite-modified electrode
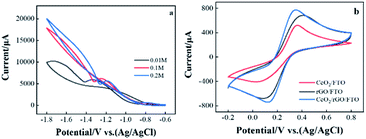
The electrochemical deposition of CeO2 porous membrane adopts CV using different working electrodes immersed in fresh cerium nitrate solution with increasing concentration (0.01, 0.1, and 0.2 M), and the potential range was from −1.8 to −0.6 V vs. Ag/AgCl/KClsat. As shown in Fig. 1(a), the hysteresis of the reverse scan indicates that the metal oxide film was deposited on the FTO surface. In addition, as the concentration of the cerium nitrate solution increases, the hysteresis and current density increase by.22Used CV to study the catalytic reaction performance of the electrode surface, using different electrodes in a solution containing 5 mM [Fe(CN)6]3−/4− with 0.1 M KCl to compare the electrical properties of each electrode. The chemical properties were shown in Fig. 1(b). The picture indicates a pair of prominent redox peaks in the CV diagram of CeO2/rGO/FTO electrode. The oxidation and reduction peaks were 0.35 and 0.13 V, respectively, corresponding to the Fe2+/Fe3+ redox ion pair. Compared with CeO2/rGO/FTO, the current responses of rGO/FTO and CeO2/FTO were significantly reduced, indicating that CeO2-modified electrode owned a particular obstructive effect on the electron transportability. This result shows that attaching CeO2 to the FTO surface hinders the electron transfer speed on the electrode surface. The electrode current increases after CeO2/rGO/FTO hybrid nanocomposite was modified.
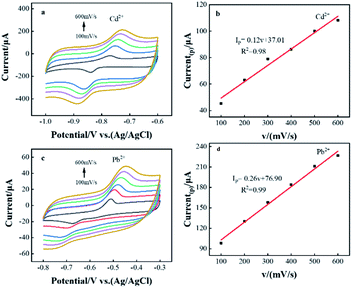
The effects of different scan rates on the redox reactions of Pb2+ and Cd2+ in CeO2/rGO/FTO nanocomposite modified electrodes were investigated by cyclic voltammetry. As shown in Fig. 2(a) and (c), the oxidation peak currents of Pb2+ and Cd2+ both increased with the increase of scan rate. Through the CVs curve, the oxidation peak current was linearly fitted to the scan rate, as shown in Fig. 2(b) and (d). When the scan rate increased from 100 to 600 mV s−1, there was a good linear relationship between the oxidation peak current and the scan rate, and the linear equations were Ipa(Cd2+) = 0.12(v) + 37.01 (R2 = 0.98) and Ipa(Pb2+)=0.26(v) + 76.90, (R2 = 0.99). This indicated that the kinetic behavior of the CeO2/rGO/FTO modified electrode in this electrochemical reaction was an adsorption process.23
Characterization of CeO2/rGO/FTO
The structure and morphology of CeO2/rGO/FTO nanocomposites were investigated using field emission scanning electron microscopy. Fig. 3(a) shows the bare FTO with a relatively smooth surface. From Fig. 3(b), the rGO on FTO was in the form of a thin film with some large wrinkled protrusions on the surface. Fig. 3(c) shows the electrochemical preparation of CeO2 nanoribbons on the FTO surface. It can be seen that the CeO2 nanoribbons are helically intertwined on the FTO surface. Fig. 3(d) shows the surface of the electrode modified by the CeO2/rGO/FTO nanocomposite material. The nanoribbons and wrinkle structure can be observed. After the composite material was superimposed, the specific surface area increases, showed a three-dimensional porous structure, which was expected to increase electroactive sites, making the sensor more favorable for electron transportation. To further characterize the elemental distribution on the CeO2/rGO/FTO nanocomposite-modified electrode surface, an energy dispersive X-ray spectroscopy analysis was performed. Fig. 3(e) was the element content distribution map of the Energy Dispersive Spectrometer (EDS) surface scan of CeO2/rGO/FTO. The strong signal peaks of C, O, and Ce can be seen.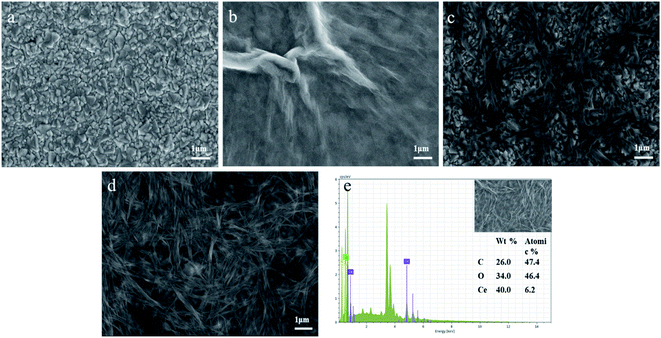 | ||
| Fig. 3 SEM images of (a) FTO, (b) rGO/FTO, (c) CeO2/FTO, and (d) rGO/CeO2/FTO; (e) EDS spectra of selected area of SEM image. | ||
The XRD patterns of CeO2/rGO/FTO nanocomposites are shown in Fig. 4(a) The XRD pattern results revealed that the CeO2 nanostructures owned diffraction peaks of (111), (200), (220), (311), (222), (400), (331), and (420) planes, which point to the CeO2 cubic fluorescence. The stone structure, intensities, and positions of the peaks are consistent with those of the standard card (JCPDS card no. 43-1002). CeO2/rGO/FTO composites were successfully prepared based on the above characterizations. The surface elements of CeO2/rGO/FTO composite films were further analyzed by X-ray photoelectron spectroscopy (XPS). Nine distinct main characteristic peaks of Ce3d orbital in CeO2 can be observed in Fig. 4(b), located at 916.5, 907.3, 903.5, 900.7, 899.1, 898.1, 885.3, 882.2 and 880.6 eV (spin–orbit splitting peaks), respectively. The characteristic peaks compared with the standard card were all attributed to Ce4+, so the main valence state of Ce in this composite material was +4.
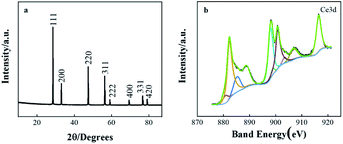 | ||
| Fig. 4 (a) XRD patterns for cerium oxide deposited film on FTO surface; (b) X-ray photoelectron spectra of Ce3d. | ||
Optimization of experimental parameters
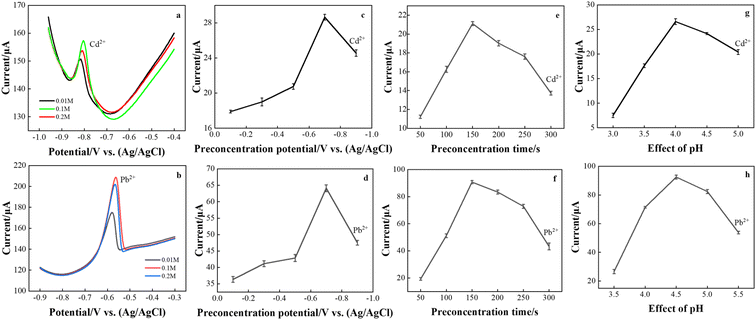
The target metal ions were determined by the DPASV method. Considering the sensitivity and peak shape, different experimental conditions such as Ce(NO3)3·6H2O concentration, deposition potential, deposition time, and pH value were optimized to use the best test conditions. These experiments were performed in a 0.1 M acetate buffer containing 80 μg L−1 Cd2+ and 50 μg L−1 Pb2+.The concentration of Ce(NO3)3·6H2O controls the bonding degree of CeO2 nanoribbons, which in turn affects the electrochemical response of the rGO/CeO2 composite electrode. The effect of Ce(NO3)3·6H2O concentration on the stripping signal of Cd2+ and Pb2+ was studied (Fig. 5(a) and (b)). The test shows that the largest peak current is obtained in the nanomodified electrode deposited by 0.1 M Ce(NO3)3·6H2O, which is consistent with the above results. Therefore, subsequent experiments use this condition to prepare modified electrodes.
The effect of the preconcentration potential on the anode dissolution peak current was studied in the potential range of −0.1 to −0.9 V, and the observation results are shown in Fig. 5(c) and (d). Stripping voltammetry is one of the basic experimental parameters that need to be optimized before testing the analyte. Cd2+ and Pb2+ reached their maximum values at a reduction potential of −0.7 V, after which the peak current decreased. This is because a high negative potential causes the background of hydrogen to precipitate, interfering with the analyte signal.24 At the same time, the potential is too low, resulting in the reduction of tin oxide on the electrode.25 Therefore, the deposition potential needs to be optimized to ensure that hydrogen evolution does not occur while ensuring that a reasonable amount of analyte is deposited on the working electrode before stripping. Therefore, an enrichment potential of −0.7 V was used for all further studies.
As shown in Fig. 5(e) and (f), the effect of the deposition time was studied. The preconcentration was performed in a 0.1 M acetate buffer solution at an enrichment potential of −0.7 V in a time of 50–300 s. It is believed that a lower detection limit can be reached with a longer deposition time.26 However, too long a deposition time will cause fouling on the electrode surface, which will affect its analytical performance. Therefore, a deposition time of 150 s is the best choice.
Changes in the oxidation peak currents of lead and cadmium ions at pH values between 3.5 and 5.5 (Fig. 5(g) and (h)) were investigated in a 0.1 M acetate buffer solution. CeO2/rGO/FTO had a great influence on the oxidation peak current of Cd2+ and Pb2+ in buffer solutions with different pH values. The best signals for Cd2+ and Pb2+ were observed at a weakly acidic pH of 4.5. To obtain the best sensitivity to target metal ions, a pH of 4.5 was used as the optimal pH for subsequent experiments. The decrease in peak current at lower pH can be attributed to graphene protonation. At higher pH, the decrease in peak current may be due to the formation of metal hydroxide complexes.27
Performance analysis
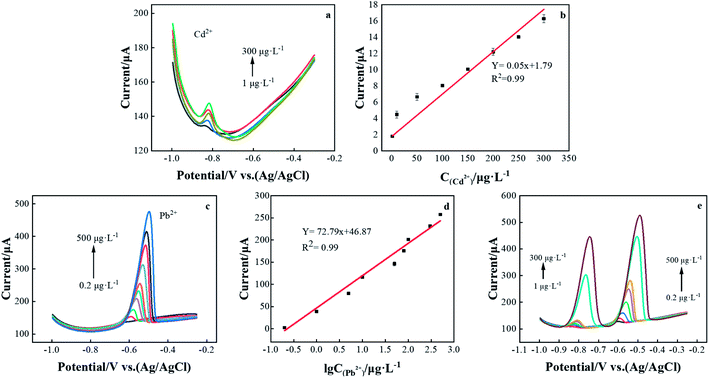
Under the best experimental conditions, the DPASV was used to simultaneously measure Cd2+ and Pb2+ on the rGO/CeO2/FTO nanocomposite-modified electrode. As shown in Fig. 6, for Cd2+ and Pb2+, the DPASV response and the resulting calibration graph are linear in the range of 1–300 and 0.2–500 μg L−1. The DPASV peak current is obtained by correcting the baseline, and then the calibration chart is evaluated based on the peak current. The corresponding calibration curves are y = −0.05x − 1.79 and y = −72.79x − 46.87, and their correlation coefficients, R2 are 0.986 and 0.984, respectively, (x: concentration (μg L−1) and current (μA)). The limit of detection (LOD) were estimated to be 0.35 and 0.04 μg L−1, based on three times the background noise (S/N = 3). The theoretical LOD was calculated from 3SD/S, where SD was the measurements. Therefore, the rGO/CeO2/FTO nanocomposite electrode can be used as a good platform for determining heavy metal ions.The detection performance of the rGO/CeO2/FTO composite nanomaterial-modified electrochemical sensor for lead and cadmium ions is compared with other reported cerium-based modified electrodes (Table 1). The results show that rGO/CeO2/FTO has an excellent performance in determining cadmium and lead ions, and the modified electrodes are cost effective and easy to fabricate.
| S. No. | Electrodes | Linear range | Detection limit | Ref. | ||
|---|---|---|---|---|---|---|
| Cd2+ | Pb2+ | Cd2+ | Pb2+ | |||
| 1 | Zeolite-modified carbon paste (Ce–ZCPME) | 5–500 μg L−1 | 50–500 μg L−1 | 0.46 μg L−1 | 0.07 μg L−1 | 29 |
| 2 | CeO2–CNFs | 0.02–2.5 μM | 0.01–2.5 μM | — | — | 30 |
| 3 | Terephthalic acid capped Fe2O3 NPs | 0.06–1.1 μM | 0.04–2 μM | 0.05 μM | 0.01 μM | 31 |
| 4 | Multiwalled CNTs | — | — | 8.4 μg L−1 | 6.6 μg L−1 | 32 |
| 5 | Bismuth modified(3-mercaptopropyl) trimethoxy silane (MPTMS) | 0.56–11.24 μg L−1 | 1.04–20.72 μg L−1 | 0.37 μg L−1 | 1.3 μg L−1 | 33 |
| 6 | rGO | 20–200 μg L−1 | 20–200 μg L−1 | 0.6 μg L−1 | 0.2 μg L−1 | 34 |
| 7 | CuZrO3 nanocomposites | 1–100 μg L−1 | 0.5–80 μg L−1 | 0.5 μg L−1 | 0.1 μg L−1 | 35 |
| 8 | rGO/CeO2/FTO nanoribbons | 1–300 μg L−1 | 0.2–500 μg L−1 | 0.35 μg L−1 | 0.04 μg L−1 | This work |
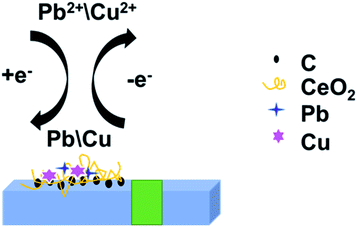
The electrochemical detection process of Cd2+ and Pb2+ was the overall process of redox reaction on the modified electrode surface. The electrochemical analysis process of Cd2+ and Pb2+ by DPASV was shown in Fig. 7. Fig. 7 revealed the redox reaction of Cd2+ and Pb2+: under the condition of applying a constant voltage, the adsorption of the electrode material, the interaction between the measured ion and the active site of the modified material makes the Cd2+ and Pb2+ in the solution in the modified electrode surface enrichment. When the applied electrode potential exceeds the precipitation potential of Cd2+ and Pb2+, the ions in the solution were reduced to Cd and Pb. After a period of time, the voltage of the working electrode was swept from negative to positive by adjusting the parameters of the experimental instrument.
The enriched Cd and Pb on the electrode were re-oxidized into Cd2+ and Pb2+ and released by dissolution. The dissolution peak current–voltage curves of Cd2+ and Pb2+ were obtained by the above procedure.28
Stability and reproducibility of CeO2/rGO/FTO electrode
Stability and reproducibility are also essential key factors in the study of electrochemical sensor performance. The CeO2/GO/FTO composite nanomodified electrode was prepared under optimized experimental conditions, and 80 μg L−1 Cd2+ and 50 μg L−1 Pb2+ were tested 10 times by the DPASV in a 0.1 M acetate buffer solution to evaluate the sensor repeatability, as shown in Fig. 8(a) and (b). During the test, the peak current value was recorded each time, and the relative standard deviation (RSD) was calculated to be 3.89%, indicating that the sensor has good repeatability. Next, the stability of the electrode was tested as shown in Fig. 8(c) and (d). The modified electrode was stored at 4 °C and tested once a day for 7 consecutive days under the same test conditions. Record each time The peak current value of Cd2+ and Pb2+ can still reach 96.4% of the original peak current value on the 7th day, indicating that the sensor has good stability. Ten different FTOs were used for parallel stripping measurements under the same experimental conditions to evaluate the sensor reproducibility. The peak current values obtained were close, and the calculated RSD was about 5.42%, indicating that the sensor has good reproducibility (Fig. 8(e) and (f)).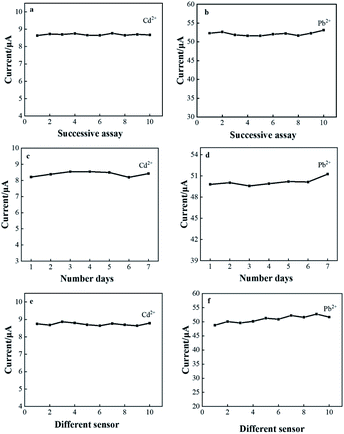 | ||
| Fig. 8 CeO2/rGO/FTO detects Cd2+ and Pb2+ (a) and (b) repeatability; (c) and (d) stability; (e) and (f) reproducibility. | ||
Sample analysis
For the purpose of practical application, the practicability and accuracy of the rGO/CeO2/FTO composite-modified electrode were tested. The modified electrode was used to detect Cd2+ and Pb2+ on tap water samples collected from the local area by adding standard methods. Tap water was spiked with standard solutions of Cd2+ and Pb2+ at different concentrations, and each sample was analyzed three times. The average sensor recovery (% ± RSD) calculated are summarized in Table 2. It shows that the rGO/CeO2/FTO composite-modified electrode has a good application prospect in analyzing lead ions in actual samples.| Sample | Added (μg L−1) | Founded (μg L−1) | RSD (%) | Recovery (%) | ||||
|---|---|---|---|---|---|---|---|---|
| Cd2+ | Pb2+ | Cd2+ | Pb2+ | Cd2+ | Pb2+ | Cd2+ | Pb2+ | |
| Tap water 1 | 0.00 | 0.00 | 0.00 | 0.00 | 0.00 | 0.00 | 0.00 | 0.00 |
| 10.00 | 1.00 | 9.39 | 0.90 | 4.85% | 4.61% | 93.93% | 90.33% | |
| 30.00 | 3.00 | 30.14 | 2.95 | 4.26% | 2.96% | 100.47% | 98.33% | |
| 50.00 | 5.00 | 49.58 | 4.96 | 1.59% | 2.10% | 99.17% | 99.20% | |
| Tap water 2 | 0.00 | 0.00 | 0.00 | 0.00 | 0.00 | 0.00 | 0.00 | 0.00 |
| 10.00 | 1.00 | 10.81 | 1.12 | 5.61% | 4.57% | 108.07% | 112.33% | |
| 30.00 | 3.00 | 30.22 | 3.14 | 3.69% | 3.32% | 100.73% | 104.67% | |
| 50.00 | 5.00 | 50.37 | 5.16 | 2.00% | 1.80% | 100.74% | 103.27% | |
Interference research
Anti-interference studies were performed by adding a variety of potentially interfering metal cations, including Zn2+, Cu2+, Co2+, Ni2+, and Fe3+, by a factor of 50 over the target. Under the optimal experimental conditions obtained by the above optimization, standard solutions of 80 μg L−1 Cd2+ and 50 μg L−1 Pb2+ were added for testing. The current ratios of target ions to interfering ions in the absence (I0) and presence (I) of interfering metal ions are shown in Fig. 9 Most substances have almost no interference with the signals of 80 μg L−1 Cd2+ and 50 μg L−1 Pb2+. The absolute value of the relative signal change varies from 2.98% to 6.02%, indicating that the modified electrode has satisfactory selectivity for determining Pb2+ and Cd2+(Fig. 9).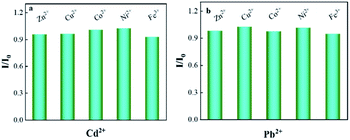 | ||
| Fig. 9 I/I0 (in the presence of Cd2+ and Pb2+ (I) and in the absence of Cd2+ and Pb2+ (I0)) with selected ions) to Bi/CeO2/rGO/FTO sensing platform in 0.1 M of ABS. | ||
Conclusions
Reduced rGO and CeO2 nanoribbons were directly prepared by cathodic electrodeposition, and a novel reduced graphene oxide/cerium oxide nanoribbon modified electrode (CeO2/rGO/FTO) was prepared. Using CeO2/rGO/FTO modified electrode as the electrochemical sensing platform, DPASV was used to simultaneously and selectively detect Cd2+ and Pb2+. During the experiment, experimental variables, including deposition potential, deposition time, buffer solution pH, and cerium-based concentration, were optimized to determine the best experimental conditions. The experimental results show that the linear calibration curve ranges of Cd2+ and Pb2+ are 1–300 and 0.2–500 μg L−1, respectively, and the detection limits are 0.35 and 0.04 μg L−1 In addition, CeO2/rGO/FTO nanoribbons modified electrodes have been successfully applied to detect and analyze Cd2+ and Pb2+ in real water samples, and satisfactory results have been obtained.Conflicts of interest
There are no conflicts to declare.Acknowledgements
The current study was supported by National Natural Science Foundation of China (61801411), Science and Technology Program of Fujian Province (2021Y01010295)to proceed with this research work.References
- M. Batool, M. Faizan, A. Awan, M. Bilal and M. N. Zafar, Nano-Structures & Nano-Objects Bismuth-based heterojunction nanocomposites for photocatalysis and heavy metal detection applications, Nano-Struct. Nano-Objects, 2021, 27, 100762 CrossRef CAS.
- A. K. Yedluri and H. Kim, Wearable super-high specific performance supercapacitors using a honeycomb with folded silk-like composite of NiCo2O4 nanoplates decorated with NiMoO4 honeycombs on nickel foam, Dalton Trans., 2018 Search PubMed.
- J. Najeeb, Surfactant stabilized gold nanomaterials for environmental sensing applications – A review, Environ. Res., 2022, 208, 112644 CrossRef CAS PubMed.
- A. Uzunoglu, A. D. Scherbarth and L. A. Stanciu, Bimetallic PdCu/SPCE non-enzymatic hydrogen peroxide sensors, Sens. Actuators, B, 2015, 220, 968–976 CrossRef CAS.
- J. Wang, Electrochemical biosensing based on noble metal nanoparticles, Microchim. Acta, 2012, 177, 245–270 CrossRef CAS.
- Y. A. Kumar, et al., Boosting the energy density of highly efficient flexible hybrid supercapacitors via selective integration of hierarchical nanostructured energy materials, Electrochim. Acta, 2020, 364, 137318 CrossRef.
- Y. A. Kumar, K. D. Kumar and H. Kim, Reagents assisted ZnCo2O4 nanomaterial for supercapacitor application, Electrochimica Acta, 2019, 330, 135261 CrossRef.
- Y. A. Kumar, K. D. Kumar and H. Kim, Electrochemical Acta Reagents assisted ZnCo2O4 nanomaterial for supercapacitor application, Electrochim. Acta, 2019, 330, 135261 CrossRef.
- J. Jang, et al., Three dimensional a-Si : H thin- film solar cells with silver nano -rod back electrodes, Curr. Appl. Phys., 2014, 14, 637–640 CrossRef.
- T. Dittrich, et al., Temperature- and oxygen partial pressure-dependent electrical conductivity in nanoporous rutile and anatase Temperature- and oxygen partial pressure-dependent electrical conductivity in nanoporous rutile and anatase, p. 3980, ( 2013) Search PubMed.
- B. D. Boyan, T. W. Hummert, D. D. Dean and Z. Schwartz, Role of material surfaces in regulating bone and cartilage cell response, Biomaterials, 1996, 17, 137–146 CrossRef CAS PubMed.
- L. Song, Challenges in Fabrication of Mesoporous Carbon Films with Ordered Cylindrical Pores via Phenolic Oligomer Self-Assembly with Triblock Copolymers, ACS Nano, 2010, 4(1), 189–198 CrossRef CAS PubMed.
- H. Ko, S. Chang and V. V. Tsukruk, Porous Substrates for Label-Free Molecular Level Detection of Nonresonant Organic Molecules, ACS Nano, 2009, 3, 181–188 CrossRef CAS PubMed.
- M. D. Stoller, S. Park, Y. Zhu, J. An and R. S. Ruoff Graphene-Based Ultracapacitors. 6–10 ( 2008).
- T. J. Echtermeyer, et al., Graphene field-effect devices, Eur. Phys. J. Spec. Top., 2007, 148, 19–26 CrossRef.
- H. He and C. Gao, Graphene nanosheets decorated with Pd, Pt, Au, and Ag nanoparticles: Synthesis, characterization, and catalysis applications, Sci. China Chem., 2011, 54, 397–404 CrossRef CAS.
- X. Zhao, et al., Sensitive determination of thymol based on CeO2 nanoparticle-decorated graphene hybrid film, New J. Chem., 2013, 37, 4045–4051 RSC.
- A. Fasolino and M. I. Katsnelson, Intrinsic ripples in graphene, Letters, 2007, 6, 6–9 Search PubMed.
- P. S. Adarakatti, V. Gangaiah and A. Siddaramanna, Mesoporous CeO2 nanoparticles modified Glassy carbon electrode for individual and simultaneous determination of Cu(II) and Hg(II): Application to environmental samples, Mater. Sci. Semicond. Process., 2018, 84, 157–166 CrossRef CAS.
- F. Meng, et al., The synthesis of carbon/cerium oxide composites clusters with the assistance of the glucaminium-based surfactant and their electrochemical performance in the glucose monitoring, J. Alloys Compd., 2017, 713, 125–131 CrossRef CAS.
- F. Meng, et al., The synthesis of carbon/cerium oxide composites clusters with the assistance of the glucaminium-based surfactant and their electrochemical performance in the glucose monitoring, J. Alloys Compd., 2017, 713, 125–131 CrossRef CAS.
- A. K. Yagati, T. Lee, J. Min and J. W. Choi, An enzymatic biosensor for hydrogen peroxide based on CeO2 nanostructure electrodeposited on ITO surface, Biosens. Bioelectron., 2013, 47, 385–390 CrossRef CAS PubMed.
- A. Murali, Y. P. Lan, P. K. Sarswat and M. L. Free, Synthesis of CeO2/reduced graphene oxide nanocomposite for electrochemical determination of ascorbic acid and dopamine and for photocatalytic applications, Mater. Today Chem., 2019, 12, 222–232 CrossRef CAS.
- G. Roa Morales, T. Ramírez Silva and L. Galicia, Carbon paste electrodes electrochemically modified with cyclodextrins, J. Solid State Electrochem., 2003, 7, 355–360 CrossRef CAS.
- C. Kokkinos, A. Economou, I. Raptis and C. E. Efstathiou, Lithographically fabricated disposable bismuth-film electrodes for the trace determination of Pb(II) and Cd(II) by anodic stripping voltammetry, Electrochim. Acta, 2008, 53, 5294–5299 CrossRef CAS.
- D. A. C. Brownson and C. E. Banks, Graphene electrochemistry: An overview of potential applications, Analyst, 2010, 135, 2768–2778 RSC.
- G. K. Raghu, S. Sampath and M. Pandurangappa, Chemically functionalized glassy carbon spheres: A new covalent bulk modified composite electrode for the simultaneous determination of lead and cadmium, J. Solid State Electrochem., 2012, 16, 1953–1963 CrossRef CAS.
- Y. F. Sun, J. J. Li, F. Xie, Y. Wei and M. Yang, Ruthenium-loaded cerium dioxide nanocomposites with rich oxygen vacancies promoted the highly sensitive electrochemical detection of Hg(II), Sens. Actuators, B, 2020, 320, 128355 CrossRef CAS.
- A. Kawde, A. Ismail, A. R. Al-Betar and O. Muraza, Novel Ce-incorporated zeolite modified-carbon paste electrode for simultaneous trace electroanalysis of lead and cadmium, Microporous Mesoporous Mater., 2017, 243, 1–8 CrossRef CAS.
- Y. L. Xie, et al., Graphene/CeO2 hybrid materials for the simultaneous electrochemical detection of cadmium(II), lead(II), copper(II), and mercury(II), J. Electroanal. Chem., 2015, 757, 235–242 CrossRef CAS.
- S. Deshmukh, et al., Terephthalic acid capped iron oxide nanoparticles for sensitive electrochemical detection of heavy metal ions in water, J. Electroanal. Chem., 2017, 788, 91–98 CrossRef CAS.
- C. R. T. Tarley, V. S. Santos, B. E. L. Baêta, A. C. Pereira and L. T. Kubota, Simultaneous determination of zinc, cadmium and lead in environmental water samples by potentiometric stripping analysis (PSA) using multiwalled carbon nanotube electrode, J. Hazard. Mater., 2009, 169, 256–262 CrossRef CAS PubMed.
- P. A. Dimovasilis and M. I. Prodromidis, Bismuth-dispersed xerogel-based composite films for trace Pb(II) and Cd(II) voltammetric determination, Anal. Chim. Acta, 2013, 769, 49–55 CrossRef CAS PubMed.
- X. Xuan and J. Y. Park, A miniaturized and flexible cadmium and lead ion detection sensor based on micro-patterned reduced graphene oxide/carbon nanotube/bismuth composite electrodes, Sens. Actuators, B, 2018, 255, 1220–1227 CrossRef CAS.
- Y. Lu, X. Liang, J. Xu, Z. Zhao and G. Tian, Synthesis of CuZrO3 nanocomposites/graphene and their application in modified electrodes for the co-detection of trace Pb(II) and Cd(II), Sens. Actuators, B, 2018, 273, 1146–1155 CrossRef CAS.
| This journal is © The Royal Society of Chemistry 2022 |

