 Open Access Article
Radical reaction extrusion copolymerization mechanism of MMA and N-phenylmaleimide and properties of products
Han Shi ,
Qixin Zhuang
 ,
Anna Zheng*,
Yong Guan
 *,
Dafu Wei and
Xiang Xu
Key Laboratory for Ultrafine Materials of Ministry of Education, School of Materials Science and Engineering, East China University of Science and Technology, Shanghai 200237, China
First published on 14th September 2022
Abstract
Using the method of bulk reactive extrusion radical copolymerization, N-phenyl maleimide (N-PMI) and styrene (St) and methyl methacrylate (MMA) were copolymerized. Through multi-detection gel permeation chromatography, bulk copolymerization kinetic analysis, UV-Vis spectroscopy, elemental analysis, and 1H NMR and 13C NMR analysis, it was found that, contrary to the classical free radical copolymerization theory, N-PMI and MMA could not only achieve copolymerization, but could even reach the level of azeotropic copolymerization. The factor that caused this change turned out to be the viscosity of the system. Secondly, through DSC, TG and GC-MS analysis, it was found that N-PMI units were randomly inserted into the molecular chain of PMMA, which greatly improved the stiffness of its molecular segments and the Tg of the copolymer; at the same time, the insertion of N-PMI units also very effectively blocked the zipper-style de-end group degradation that often occurs in PMMA. When the mass content of the N-PMI copolymer reached 10%, the Tg, initial degradation temperature and semi-degradation temperature of the copolymer increased by 19 °C, 58 °C and 47 °C, respectively. In addition, St, N-PMI can also significantly improve the processing fluidity of the PMMA copolymer, and after St participates were introduced in the copolymerization, the melt flow rate can be increased by 3.5 times. Furthermore, the copolymer not only had good mechanical properties and transparency, but also had excellent antibacterial properties against E. coli and S. aureus with only the effect of trace residual N-PMI in the copolymer. This provides an excellent reference for the preparation of antibacterial PMMA with high heat resistance, good mechanical properties and high transparency.
1 Introduction
Poly(methyl methacrylate) (PMMA) has been widely used in aviation, automotive, construction, medical and other fields due to its excellent optical properties, biocompatibility, weather resistance and stable mechanical properties.1 However, PMMA has insufficient heat resistance and poor toughness, and no ability to resist bacteria and fungi contamination, which limits the application of PMMA in many fields.2The research on the modification aiming at different defects of PMMA has been going on for decades, and the heat-resistant modification began in the 1980s. Compared with other methods like adding additives,3 the method of changing the molecule chain structure and introducing rigid groups can more effectively limit the movement of the polymer segment and can better improve the heat resistance of PMMA. Specifically, it can be achieved by increasing the intermolecular force,4 introducing large steric hindrance or rigid groups on the side chains,5 or introducing a rigid cyclic structures on the main chain.6,7 In our previous works, MMA was copolymerized with maleic anhydride,8,9 N-substituted maleimide and other cyclic structure monomers,10–13 due to the introduction of a rigid five-membered ring in the PMMA main chain, thereby significantly improving its heat resistance.
However, under industrial conditions, the free radical bulk copolymerization of MMA and maleic anhydride (MAH) or N-substituted maleimide (N-PMI) is still difficult to achieve.14–16 First of all, free radical polymerization takes a long time. Increasing the reaction rate usually results in a decrease in molecular weight. It is difficult to solve this problem even with traditional polymerization techniques such as using kettles, pipes or casting mould. Secondly, the gap between the reactivity ratio of the copolymerization of MMA and functional monomer is too large (rMMA![[thin space (1/6-em)]](https://www.rsc.org/images/entities/char_2009.gif) :
:![[thin space (1/6-em)]](https://www.rsc.org/images/entities/char_2009.gif) rMAH = 6.36
rMAH = 6.36![[thin space (1/6-em)]](https://www.rsc.org/images/entities/char_2009.gif) :
:![[thin space (1/6-em)]](https://www.rsc.org/images/entities/char_2009.gif) 0.019), which means that the content of MMA in the copolymer is always higher than the ratio of raw materials. This not only brings complicated post-processing, but also some functions monomers such as MAH can hardly even participate in the copolymerization. Therefore, this type of copolymerization reaction is difficult to achieve.
0.019), which means that the content of MMA in the copolymer is always higher than the ratio of raw materials. This not only brings complicated post-processing, but also some functions monomers such as MAH can hardly even participate in the copolymerization. Therefore, this type of copolymerization reaction is difficult to achieve.
In our previous work, through in-depth research on reactive extrusion polymerization, we found that this technology was beneficial to the bulk polymerization of MMA.17–20 This technology uses a twin-screw extruder as a reactor, so that even in a high-viscosity melt system, it can transfer heat and mass well. Through reactive extrusion polymerization, the radical bulk copolymerization of MMA and MAH is realized within a short residence time. Moreover, the content ratio of MMA to MAH in the copolymer is similar to the mass ratio of the raw materials.19 This means that under the conditions of high temperature, high pressure and high viscosity of the extruder, the copolymerization of MMA and MAH is close to the azeotropic copolymerization. This is difficult to explain with the classic copolymerization reactivity ratio of MMA and MAH.
Therefore, in this article, it is planned to copolymerize MMA and N-PMI through reactive extrusion polymerization technology to implement heat-resistant modification of PMMA. However, in view of the copolymer reactivity ratio of MMA and N-PMI measured by the predecessors in the solution polymerization method: rMMA![[thin space (1/6-em)]](https://www.rsc.org/images/entities/char_2009.gif) :
:![[thin space (1/6-em)]](https://www.rsc.org/images/entities/char_2009.gif) rN-PMI = 1.9090
rN-PMI = 1.9090![[thin space (1/6-em)]](https://www.rsc.org/images/entities/char_2009.gif) :
:![[thin space (1/6-em)]](https://www.rsc.org/images/entities/char_2009.gif) 0.1556, it can be seen that the composition of the prepared copolymer should be very different from the feed ratio.6 In view of this, styrene (St) was introduced as the third monomer to change this situation. Because the ratio of the copolymerization reactivity ratio of MMA and St is: rMMA
0.1556, it can be seen that the composition of the prepared copolymer should be very different from the feed ratio.6 In view of this, styrene (St) was introduced as the third monomer to change this situation. Because the ratio of the copolymerization reactivity ratio of MMA and St is: rMMA![[thin space (1/6-em)]](https://www.rsc.org/images/entities/char_2009.gif) :
:![[thin space (1/6-em)]](https://www.rsc.org/images/entities/char_2009.gif) rSt = 0.46
rSt = 0.46![[thin space (1/6-em)]](https://www.rsc.org/images/entities/char_2009.gif) :
:![[thin space (1/6-em)]](https://www.rsc.org/images/entities/char_2009.gif) 0.57, which is in line with the azeotropic copolymerization combination; on the other hand, the ratio of the copolymerization reactivity ratio of N-PMI and St is: rN-PMI
0.57, which is in line with the azeotropic copolymerization combination; on the other hand, the ratio of the copolymerization reactivity ratio of N-PMI and St is: rN-PMI![[thin space (1/6-em)]](https://www.rsc.org/images/entities/char_2009.gif) :
:![[thin space (1/6-em)]](https://www.rsc.org/images/entities/char_2009.gif) rSt = 5.1667 × 10⁻²
rSt = 5.1667 × 10⁻²![[thin space (1/6-em)]](https://www.rsc.org/images/entities/char_2009.gif) :
:![[thin space (1/6-em)]](https://www.rsc.org/images/entities/char_2009.gif) 7.0982 × 10⁻³, which is in line with the alternating copolymerization combination.1 Therefore, it is obvious that the addition of St should help to adjust the distribution of copolymer components. At the same time, based on previous studies and our own work,21–23 it is shown that viscosity has a significant effect on radical polymerization and is an important basis for the occurrence of the Trommsdorff effect. Therefore, the bulk copolymerization was carried out under different viscosity conditions to verify the effect of viscosity on the copolymerization.
7.0982 × 10⁻³, which is in line with the alternating copolymerization combination.1 Therefore, it is obvious that the addition of St should help to adjust the distribution of copolymer components. At the same time, based on previous studies and our own work,21–23 it is shown that viscosity has a significant effect on radical polymerization and is an important basis for the occurrence of the Trommsdorff effect. Therefore, the bulk copolymerization was carried out under different viscosity conditions to verify the effect of viscosity on the copolymerization.
It is worth pointing out that as a functional monomer, N-PMI has antibacterial, antitumor and anti-inflammatory activities.24,25 Due to the long-term existence of the COVID-19 epidemic, its inhibitory effect on microorganisms and inflammation will also cause widespread concern. Therefore, the antibacterial properties of the copolymer of MMA and N-PMI are also tested in this article. It is found that the copolymer not only has good thermal stability, but also has certain antibacterial activity. This indicates that the heat-resistant and anti-bacterial modification of PMMA through reactive extrusion in one step should have broad application prospects.
2 Experimental
2.1 Materials and chemicals
Methyl methacrylate (MMA) and styrene (St), analytical reagent, was provided by China's Oil Sunup Group Co., Ltd (China) and obtained after reduced pressure distillation. N-phenyl maleimide (N-PMI), analytical reagent, was provided by Shanghai Titan Co. Ltd (Shanghai, China). AIBN, analytical reagent, was provided by Shanghai Ling Feng Chemical Reagent Co. Ltd (Shanghai, China), and obtained after recrystallization in hot ethanol. Homo-polymethylmethacrylate (PMMA, VH001, Mn = 4.26 × 10⁴, MWD = 1.61) was purchased from Mitsubishi Rayon Polymer Co., Ltd (Nantong, China). High molecular weight PMMA (HM-PMMA, Mn = 1.23 × 10⁵, MWD = 1.2) was purchased from Taixing Donchamp Acrylic Co., Ltd (Taixing, China). All reagents were used as received.2.2 Preparation of co-polymers
The copolymerization was carried out in a two-stage extruder system, as shown in Fig. 1 and the different ratios of monomers and initiator (AIBN, 0.4 wt%) were mixed in tank A. The first-stage extruder was a TDE-40 co-rotating twin screw extruder (diameter = 41.3 mm, L/D = 68), the second-stage extruder is a TDY-40 reverse-rotating tight-meshing twin-screw extruder (diameter = 41 mm, L/D = 60). Both extruders were produced by USEON Extrusion Machinery Co., Ltd (Nanjing, China), and two twin-screw extruders were connected in series. The mixture in tank A was injected into the first barrel of the first-stage extruder through a metering pump. The metering pump can accurately measure the feeding speed and help the monomer solution forward. The monomer remaining in the polymerization system was removed by a vacuum device installed at the 10th barrel of the second-stage extruder near the die.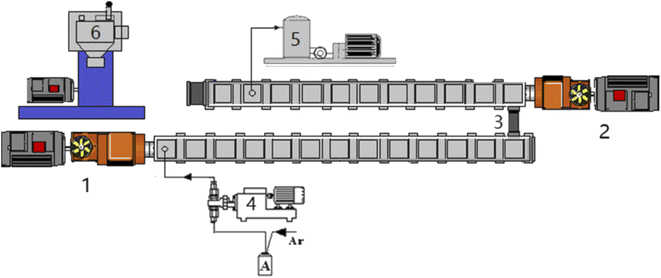 | ||
| Fig. 1 Experimental setup for reactive extrusion of copolymers. (1) TDE-40 extruder. (2) TDY-40 extruder. (3) Connector. (4) Metering pumps. (5) Vacuum pump. (6) Granulator. | ||
Before polymerization, the extruder was heated to 220 °C, and the impurities in the extruder were cleaned with dry argon. Then turn on the cooling water pump to cool it down. When the temperature dropped to the set temperature, the main engine oil pump and the screw were turned on. Then the monomer solution was pumped into the extruder, the screw speed was start to increase to a predetermined value. About 40 minutes later, the noodle-like copolymer started extruding out from the die. After being stabilized, the polymer strands were pelletized and the product was obtained. Residual monomer in the polymer is removed by vacuum devolatilizer on the second-stage extruder.
The temperature of the extruder was set at 90–200 °C, and the initial stage of polymerization was 90–160 °C. The screw speed could be adjusted from 0–85 rpm according to the operating status. The melt pressure of the first extruder was about 0, and the melt pressure of the second extruder was 1.2–3.0 MPa, with reference to our previous study.19
2.3 Bulk free radical copolymerization in test tube and flask
10% N-PMI and 90% MMA were added into a beaker and mixed. And 0.7% AIBN for total weight of the previous two monomers was also added in. Compared with the control group, the test group added 6 wt% of HM-PMMA. The mixture was mixed thoroughly in the beaker and poured into a test tube, and then copolymerized in a water bath at 40 °C. After each period of time, a small amount of polymer solution as a sample was taken out using a pipette from the bottom of the test tube. Until the solution was too viscous to be extracted, the test tube was broken open and the viscous solution at the bottom was taken out.Using ultraviolet-visible spectroscopy with ethanol as the solvent, the characteristic curve of N-PMI was measured and a standard curve was made also. The sample obtained above was diluted and precipitated in ethanol. The copolymer was separated from the solution by filtration. Then the concentration of the residual N-PMI in the solution was analyzed by ultraviolet-visible spectroscopy, and the copolymerization conversion rate of N-PMI in the copolymer was calculated from this. In addition, a Bruker DRX-400 spectrometer was used to perform 1H-NMR spectrum analysis on the purified sample.
The bulk free radical copolymerization was then conducted in three-necked flask. The materials and the composition were the same as the copolymerization in the test tube, including the experiment and control groups, in a water bath at 40 °C. During the polymerization, the systems was kept in inert atmosphere and the samples was extracted by pipette in set interval time. And the products were characterized just the same as the results of experiment in test tube.
2.4 Characterization of co-polymers
The Waters515 gel permeation chromatograph and Wyatt technologies DAW NEOS small-angle light scattering detector were used together to characterize the molecular mass and distribution (MGPC). THF was the solvent, the sample content was 5 mg ml−1, and the test temperature was 25 °C.The refined sample was obtained by precipitating the polymerized PMMA in THF solution with twice the volume of methanol, and then drying it in a vacuum oven at 80 °C for 24 hours. Because methanol is a good solvent for N-PMI, but a precipitant for PMMA. In addition, the elemental analyzer (EA) (SARTORIUS GmbH, Germany) was used to determine the carbon, nitrogen, and hydrogen content of the refined sample twice to obtain the average value.
The 13C-NMR spectrum analysis of the refined copolymer was performed with a Bruker Ascend-600 nuclear magnetic resonance instrument, using TMS as the internal standard and deuterated chloroform (CDCl3) as the solvent of the sample.
The Tg of the sample was measured by Diamond DSC (Perkin-Elmer, America), the temperature scanning range was 25–180 °C, the rate of temperature increase was 5 K min−1, and the air atmosphere. The thermal history was removed from all specimens during DSC testing.
NETZSCH STA 449F3 thermogravimetric analysis (TGA) (NETZSCH, Germany) was used to analyze the thermal stability of the copolymer under N2 atmosphere (20 ml min−1). 10 mg analysis sample, the temperature is from room temperature to 600 °C, and the heating rate is 10 °C min−1.
Multi-shot cracker (Frontier, py2020d, Koriyama, Japan) and Agilent 7890 A gas chromatograph (Santa Clara, CA) were connected to Agilent 75975C mass spectrometer detector. Py-GC/MS was used to qualitatively and quantitatively analyze the cracked products. The polymer sample is 200 ± 20 μg, the pyrolysis temperature is 300 °C, and the residence time is 30 s. Ultra-high purity helium (99.9995%) was used as the pyrolysis inert gas and GC/MS carrier gas, and the column flow rate was 1.2 ml min−1. The temperature of the GC/MS interface and ion source was maintained at 200 °C. The mass spectra of the pyrolysis products were compared with the NIST library, and the relative area% under the peak (only > 2%) was used to express the content of the pyrolysis products.
The resin sheets of samples were prepared in a compression press (Guangdong Bolon Precision Testing Machines, China) at 190 °C, 10 MPa for 5 min. The Lambda 950 UV-visible spectrophotometer (Perkin-Elmer, America) was used to investigate the light transmittance of the circular sample sheets (diameter = 5 cm, thickness = 0.4 ± 0.05 mm) of the copolymers over wavenumber from 200 nm to 800 nm.
The melt flow rates (MFR) were measured by ZRZ1452 Melt Indexer according to the standard GB/T 3682-2000 (China). The copolymers were molded by injection machine according to the standards GB/T 11![[thin space (1/6-em)]](https://www.rsc.org/images/entities/char_2009.gif) 997-2008 (China) and GB/T 15
997-2008 (China) and GB/T 15![[thin space (1/6-em)]](https://www.rsc.org/images/entities/char_2009.gif) 597.2-2010 (China). The tensile and flexural strengths were measured through a CMT4204 microcomputer control electronic universal material testing machine at the speed of 5 mm min−1 and 2 mm min−1, respectively. The impact strengths were measured by CEAST 9050 cantilever beam impact tester.
597.2-2010 (China). The tensile and flexural strengths were measured through a CMT4204 microcomputer control electronic universal material testing machine at the speed of 5 mm min−1 and 2 mm min−1, respectively. The impact strengths were measured by CEAST 9050 cantilever beam impact tester.
The antimicrobial activities of the samples were investigated by the shaking flask method. The procedure was as follows: 0.10 g different sample powders (before water washing, after water washing and purified) and 10 ml bacterial culture (105 CFU ml−1) were mixed, and shook in incubator for 24 h at 37 °C. After shaking, various dilutions were prepared successively, and then 0.1 ml of this culture was seeded on agar in a Petri dish. The dishes were incubated for 24 h at 37 °C and the number of colonies was counted. The inhibition efficiency of cell growth was estimated from eqn (1):
| Growth inhibition rate = (A − B)/A × 100% | (1) |
3 Results and discussion
3.1 Characterization of copolymers
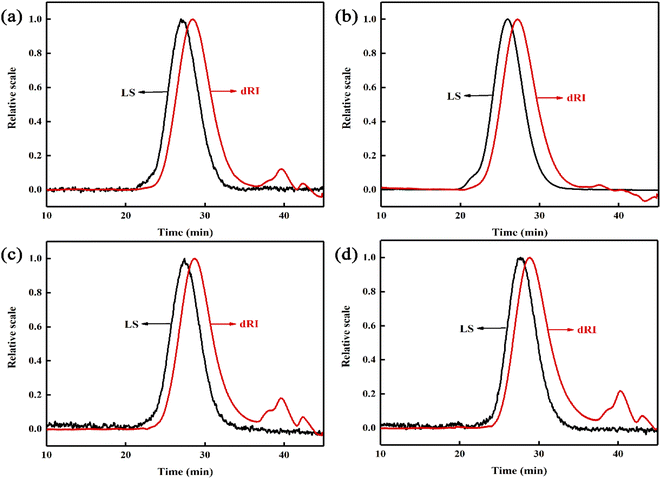
The polymerization conversion rate, monomer residual rate, molecular weight and molecular weight distribution (MWD) of the copolymer are shown in Table 1. It can be seen that the single conversion rate of the copolymer prepared by the reactive extrusion polymerization is not less than 98.5%, and the monomer residue rate is not more than 0.1%. The copolymer has a relatively high molecular weight (Mn > 4.8 × 10⁴) and a narrow molecular weight distribution (MWD < 1.9). However, the PMMA prepared by the bulk casting method has no shear flow, so there are some ultra-high molecular weight components, so it cannot be processed further. In addition, compared with commercially available PMMA microspheres (such as VH001 prepared by bulk polymerization), the molecular weight of the reactive extrusion copolymer is larger and the molecular weight distribution is narrower. The product MGPC curve is shown in Fig. 1. The LS detection curve of small-angle laser scattering in the figure is sensitive to high molecular weight components, and the refractive index dRI detection curve is sensitive to low molecular weight components. It can be seen that the LS curves of the products all showed an obvious unimodal distribution, and there was no shoulder peak in the high molecular weight part. At the same time, the dRI curve shows that the product contains less low molecular weight components. This shows that in the late stage of the polymerization when the system viscosity is high, the residual monomers are already less, making it difficult for free radicals to contact the monomers to carry out chain propagation reactions, thereby avoiding the appearance of some low molecular weight molecules. At the same time, due to the shearing effect of the screw, the Trommsdorff effect is effectively suppressed, thus avoiding the formation of ultra-high molecular weight, and obtaining a higher molecular weight PMMA copolymer, and the molecular weight distribution is relatively narrow.| Samples | Monomer ratio (wt%) | Compositionb (wt%) | Conversion (%) | Monomer residue (%) | Mn ×10−4 | MWD | Tg (°C) | Tonset (°C) | T50 (°C) | ||||
|---|---|---|---|---|---|---|---|---|---|---|---|---|---|
| MMA | N-PMI | St | MMA | N-PMI | St | ||||||||
| a Commercial PMMA with high transparency (PMMA, VH001).b Calculated and analyzed by the results of 1H NMR and EA. | |||||||||||||
| PMMAa | 100 | 0 | 0 | 100 | 0 | 0 | — | — | 4.26 | 1.61 | 113.59 | 240 | 335 |
| MPM-5 | 95 | 5 | 0 | 95.35 | 4.65 | 0 | 98.6 | 0.04 | 6.82 | 1.56 | 128.15 | 290 | 376 |
| MPMS-55 | 90 | 5 | 5 | 90.07 | 4.94 | 4.99 | 98.6 | 0.05 | 5.59 | 1.58 | 127.85 | 288 | 368 |
| MPM-10 | 90 | 10 | 0 | 89.62 | 10.38 | 0 | 98.8 | 0.04 | 5.78 | 1.68 | 132.20 | 298 | 382 |
| MPMS-1010 | 80 | 10 | 10 | 79.86 | 10.26 | 9.88 | 98.5 | 0.07 | 4.89 | 1.86 | 132.08 | 295 | 379 |
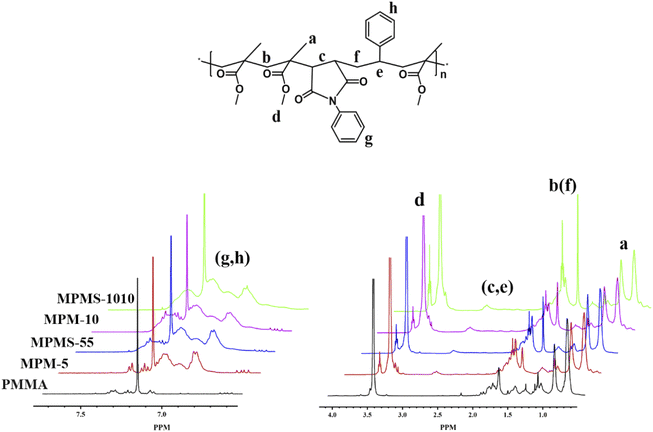
In all samples, peaks at δ 0.65–1.45 (a, –CH3), δ 1.65–2.07 (b, f, –CH2–), and δ 3.42–3.87 (d, –OCH3) appeared. For copolymers, the new chemical shift appears at δ 2.6–3.1 (c, –CH–CH– in N-PMI and e, –CH– in St) and at δ 6.82–7.24 (g, h, the benzene ring in N-PMI and St). Then the composition is quantitatively analyzed based on the intensity of the characteristic peak (shown in Table 1). However, since the chemical shifts of N-PMI and St overlap each other in the benzene ring and methine regions, it is difficult to determine the composition of N-PMI and St in the copolymer by 1H NMR alone. However, since the N element basically comes from N-PMI (the initiator contains only a very small amount of N element, which can be ignored), elemental analysis (EA) can be used to obtain the N element content in the copolymer, thereby obtaining the N-PMI ratio. The results showed that the nitrogen content of MPM-5 and MPMS-55 samples were 0.37 wt% and 0.40 wt%, respectively, while the nitrogen content of MPM-10 and MPMS-1010 samples were 0.83 wt% and 0.82 wt%, respectively (as shown in Table 1). After calculation, the proportions of N-PMI in MPM-5, MPMS-55, MPM-10 and MPMS-1010 are 4.57 wt%, 4.94 wt%, 10.38 wt% and 10.26 wt%, respectively, which are close to their respective feeds ratios. At the same time, combined with the results of 1H NMR spectrum, it can be calculated that the St content of MPMS-55 and MPMS-1010 are 4.99 wt% and 9.88 wt%, which are almost the same as their respective feed ratios (Fig. 2).
However, the monomer reactivity ratios are: rMMA![[thin space (1/6-em)]](https://www.rsc.org/images/entities/char_2009.gif) :
:![[thin space (1/6-em)]](https://www.rsc.org/images/entities/char_2009.gif) rN-PMI = 1.9090
rN-PMI = 1.9090![[thin space (1/6-em)]](https://www.rsc.org/images/entities/char_2009.gif) :
:![[thin space (1/6-em)]](https://www.rsc.org/images/entities/char_2009.gif) 0.1556, rMMA
0.1556, rMMA![[thin space (1/6-em)]](https://www.rsc.org/images/entities/char_2009.gif) :
:![[thin space (1/6-em)]](https://www.rsc.org/images/entities/char_2009.gif) rSt = 0.4600
rSt = 0.4600![[thin space (1/6-em)]](https://www.rsc.org/images/entities/char_2009.gif) :
:![[thin space (1/6-em)]](https://www.rsc.org/images/entities/char_2009.gif) 0.5700, rN-PMI
0.5700, rN-PMI![[thin space (1/6-em)]](https://www.rsc.org/images/entities/char_2009.gif) :
:![[thin space (1/6-em)]](https://www.rsc.org/images/entities/char_2009.gif) rSt = 5.1667 × 10⁻²
rSt = 5.1667 × 10⁻²![[thin space (1/6-em)]](https://www.rsc.org/images/entities/char_2009.gif) :
:![[thin space (1/6-em)]](https://www.rsc.org/images/entities/char_2009.gif) 7.0982 × 10⁻³. Therefore, according to the classic free radical copolymerization theory, MMA and N-PMI can hardly be copolymerized, but MMA and St tend to copolymerize randomly. However, N-PMI and St tend to copolymerize alternately, so the mediation of St facilitates the copolymerization of MMA and N-PMI. However, through reactive extrusion polymerization, whether MMA and N-PMI are binary copolymerization or ternary copolymerization with St, the content of N-PMI and St in the copolymer is almost equal to the feed ratio of each monomer raw material. The same, and there is no significant change due to the addition of St. This can only show that under the conditions of high temperature, high pressure, high shear rate and high viscosity in the extruder, the reactivity ratio of each monomer tends to 1 in the process of free radical copolymerization. In order to explore the reason, it is planned to verify the bulk free radical copolymerization in the test tube (Fig. 3).
7.0982 × 10⁻³. Therefore, according to the classic free radical copolymerization theory, MMA and N-PMI can hardly be copolymerized, but MMA and St tend to copolymerize randomly. However, N-PMI and St tend to copolymerize alternately, so the mediation of St facilitates the copolymerization of MMA and N-PMI. However, through reactive extrusion polymerization, whether MMA and N-PMI are binary copolymerization or ternary copolymerization with St, the content of N-PMI and St in the copolymer is almost equal to the feed ratio of each monomer raw material. The same, and there is no significant change due to the addition of St. This can only show that under the conditions of high temperature, high pressure, high shear rate and high viscosity in the extruder, the reactivity ratio of each monomer tends to 1 in the process of free radical copolymerization. In order to explore the reason, it is planned to verify the bulk free radical copolymerization in the test tube (Fig. 3).
The free radical copolymerization reaction in the test tube reached the time when the sample cannot be sampled, it was about 400 minutes for the control sample, which was related to the starting point of the Trommsdorff effect. During this period, samples were taken every 140 minutes to measure the conversion rate, residual N-PMI content, and copolymer composition. Compared with the control sample, the time for pre-dissolved 6% HM-PMMA high-viscosity mixed monomer to copolymerize to the Trommsdorff effect area was shortened to about 280 minutes. Due to the accelerated reaction, the sample was taken every 100 minutes. This indicates that the high-viscosity system will promote the Trommsdorff effect, which also provides further evidence for the effect of viscosity on the N-PMI copolymerization.
Before the determination of the ethanol precipitation solution, the standard curve of different concentrations of N-PMI in ethanol was obtained by ultraviolet-visible spectroscopy, as shown in Fig. 4. Since N-PMI has a certain solubility in ethanol, and MMA-N-PMI copolymer or PMMA is insoluble in ethanol, the residual N-PMI will dissolve in ethanol during the precipitation of MMA-N-PMI copolymer in ethanol. The characteristic peak of N-PMI appears at 310 nm in the ultraviolet-visible spectrum of the N-PMI ethanol solution (Fig. 4a). The linear fitting curve of the peak absorbance (A310 nm) and mass concentration is: A310 nm = 0.00766 + 1.9398 CN-PMI (Fig. 4b). According to the A310 nm of the ethanol precipitation solution, the concentration of residual N-PMI can be obtained. Then 1H NMR was used to determine the composition of the copolymer to further obtain the efficiency of the N-PMI copolymerization (see Table 2).
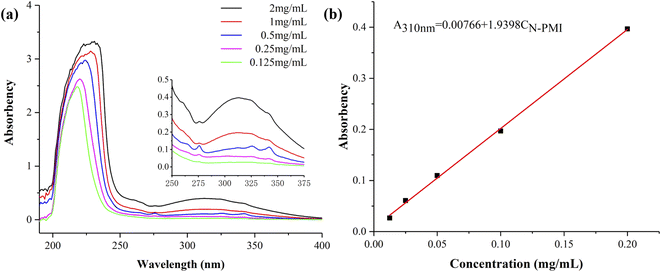 | ||
| Fig. 4 (a) UV-vis spectra of N-PMI ethanol solutions with different concentrations, (b) standard curve of N-PMI ethanol solutions. | ||
| Reaction time (min) | Copolymerization conversion ratea (%) | Mass of N-PMI in precipitation solutionb (mg mL−1) | UV absorption intensity | N-PMI percent in precipitation solution (%) | Composition of N-PMI in copolymersc | |
|---|---|---|---|---|---|---|
| a The conversion rate of the experimental group from which the pre-dissolved HM-PMMA had been deducted.b The mass of N-PMI in precipitation solution had been diluted by ethanol and then determined by UV-vis spectroscopy.c The content of N-PMI component in the obtained copolymer was detected and calculated by 1H NMR, and the influence of pre-dissolved HM-PMMA was deducted from it. | ||||||
| Experiment groups | 0 | — | 0.5571 | 1.0884 | 100 | — |
| 100 | 11.45 | 0.1568 | 0.3119 | 73.1 | — | |
| 200 | 15.37 | 0.1077 | 0.2166 | 49.5 | 5.88% | |
| 300 | 21.64 | 0.0564 | 0.1170 | 34.6 | 7.80% | |
| Controls | 0 | — | 2.4000 | 0.4707 | 100 | — |
| 140 | 11.44 | 0.7140 | 0.2576 | 86.8 | — | |
| 280 | 16.84 | 0.5820 | 0.1327 | 78.5 | 4.90% | |
| 420 | 19.32 | 1.1820 | 0.2394 | 70.2 | 5.74% | |
| 560 | 31.54 | 1.5380 | 0.1226 | 54.7 | 7.03% | |
From the results, although the conversion rates of the control group and the experimental group are close, the concentration of free N-PMI in the precipitation solution of the pre-dissolved polymer experimental group is lower. On the contrary, the N-PMI content in the copolymer composition of the experimental group is higher. It seems that the pre-melted polymer increases the viscosity of the system not only to increase the rate of copolymerization, but also to enhance the ability of monomers with low reactivity ratio to participate in the copolymerization. In addition, regardless of the control group and the experimental group, the ability of monomers with low reactivity ratio to participate in copolymerization increased with the increase of conversion rate and viscosity, which further verified the positive effect of viscosity on reactivity ratio. Moreover, in the copolymerization of N-PMI and MMA, the ratio of N-PMI with a very low reactivity ratio in the copolymer can reach the feed ratio of the raw materials, which is similar to the azeotropic copolymer. It can be seen that, in the process of reactive extrusion copolymerization, high viscosity is a key factor in changing the reactivity ratio compared to the effects of high temperature, high pressure and high shear rate. It seems that the viscosity obscures the reactivity ratio of different monomers.
3.2 13C NMR chemical shifts of samples
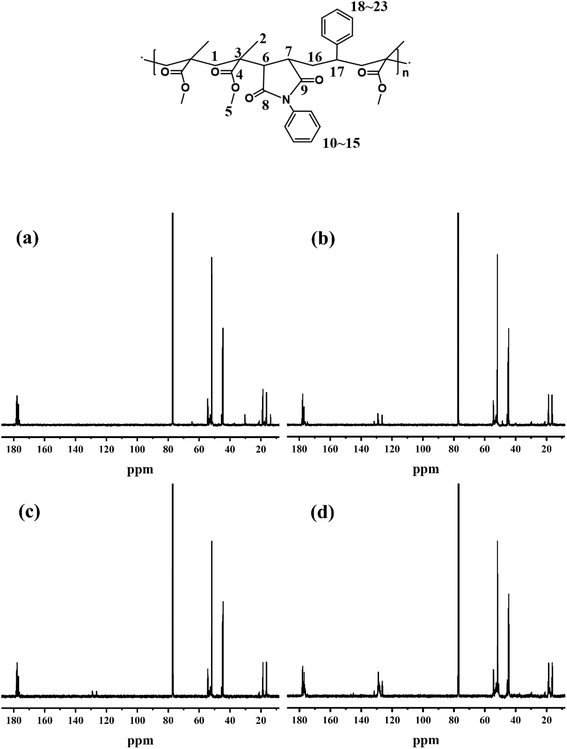
PMMA: δ 16.39, 18.70, 18.86, 21.05(C1), δ 44.51, 44.86(C2), δ 45.50(C3), 176.17, 176.31, 176.95, 177.14, 177.84, 178.10, 178.40(C4), δ 51.81, 52.71, 53.43, 54.23, 54.43(C5);MPM-5: δ 16.44, 18.70, 18.91, 21.06(C1), δ 44.51, 44.86(C2), δ 45.50(C3), δ 48.53(C6, C7), δ 176.17, 176.31, 177.01, 177.14, 177.84, 178.13, 178.41(C4, C8, C9), δ 51.81, 52.07, 52.63, 54.23, 53.43, 54.43(C5), δ 126.40, 128.70, 129.15, 131.60(C10–15);
MPM-10: δ 16.36, 18.70, 18.86, 21.06(C1), δ 44.53, 44.86(C2), δ 45.50(C3), δ 48.53(C6, C7), δ 176.17, 176.34, 176.95, 177.14, 177.84, 178.10, 178.40(C4, C8, C9), δ 51.84, 52.07, 52.63, 54.23, 53.43, 54.43(C5), δ 126.44, 128.70, 129.15, 131.60(C10–15);
MPMS-1010: δ 16.36, 18.70, 18.96, 21.02(C1), δ 44.50, 44.86(C2), δ 45.53(C3), δ 48.53(C6, C7), δ 176.15, 176.35, 176.94, 177.14, 177.84, 178.11, 178.40(C4, C8, C9), δ 51.80, 52.19, 52.75, 53.42, 54.42(C5), δ 126.37, 127.68, 128.03, 128.53, 128.99, 131.59(C10–15, C18–23);
In order to verify the validity of the above conclusions, we carried out the free radical bulk copolymerization reaction with shearing effect in the flask through a stirring bar, and the copolymerization results in the lower conversion and viscosity regions were shown in Table 3. It can be seen that, comparing the control group under a certain shear rate with the control group without shear, the polymerization rate is not faster, but slower. It is shown that, as long as the monomer diffusion rate is satisfied, the polymerization rate of the system without shear and without stirring is faster than that with shear. Secondly, consistent with the above results of the copolymerization in the test tube without shearing, even under shearing, the content of N-PMI involved in the copolymerization in the pre-added HM-PMMA experimental group with higher viscosity is still higher than that of the control group with lower viscosity group. It is just that the gap between the two is a bit narrower than the gap between the two in the no-shear test tube. It is further confirmed that increasing the viscosity of the polymerization system can not only accelerate the polymerization reaction, but also make it easier for monomers with low reactivity ratios to participate in the copolymerization. If the shear effect is viewed as equivalent to a decrease in viscosity, the results of the polymerization reaction under increasing shear are predictable.
| Reaction time (min) | Copolymerization conversion ratea (%) | Mass of N-PMI in precipitation solutionb (mg mL−1) | UV absorption intensity | N-PMI percent in precipitation solution (%) | Composition of N-PMI in copolymersc | |
|---|---|---|---|---|---|---|
| a The conversion rate of the experimental group from which the pre-dissolved HM-PMMA had been deducted.b The mass of N-PMI in precipitation solution had been diluted by ethanol and then determined by UV-vis spectroscopy.c The content of N-PMI component in the obtained copolymer was detected and calculated by 1H NMR, and the influence of pre-dissolved HM-PMMA was deducted from it. | ||||||
| Experiment groups | 0 | — | 0.5571 | 1.0884 | 100 | — |
| 150 | 9.32 | 0.2539 | 0.1017 | 88.3 | 3.44% | |
| 300 | 18.37 | 0.6727 | 1.3381 | 75.5 | 4.67% | |
| 400 | 24.99 | 0.2674 | 0.3405 | 68.8 | 5.80% | |
| Controls | 0 | — | 1.3400 | 0.2628 | 100 | — |
| 180 | 8.86 | 0.6350 | 0.2278 | 90.6 | — | |
| 360 | 12.67 | 0.8440 | 0.3045 | 85.5 | 2.80% | |
| 460 | 19.65 | 0.7720 | 0.1760 | 79.2 | 3.74% | |
| 560 | 27.78 | 1.2340 | 0.1921 | 72.3 | 5.03% | |
Classical physical chemistry tells that the rate of a chemical reaction is determined by the probability of effective collisions between molecules, so it is generally believed that the higher the temperature, the greater the relative motion of the molecules, and the higher the reaction rate. This is well reflected in the termination reaction of free radical polymerization. This can be seen in our previous research,21 in which the rate of chain termination is increased with increasing shear rate. However, for the polymerization reaction of extending the molecular chain, the bond formation reaction between the free radical reactive species and the monomer may require a longer transition period. The higher viscosity provides sufficient assurance for this transition period, thereby increasing the rate of radical polymerization. Secondly, the classical Q-e theory of free-radical copolymerization is based on thermodynamics and is supported by the experimental results of a large number of dilute solutions and low conversion conditions. Therefore, it is limited to an ideal state to a considerable extent, and the influence of dynamic factors is almost completely excluded, so the real situation has not attracted public attention. Therefore, although the Q-e theory determines the affinity and reaction probability between the free radical reactive species and the monomer, it ignores the effect of the transition period, which is a kinetic factor of the reaction. On the contrary, as long as there is a long enough transition period, even if there is the influence of the thermodynamic factors of affinity and reaction probability, on the premise that the kinetic factors are fully guaranteed, it becomes unimportant. This might be a possible interpretation of Table 2 and 3.
To further conform the above results, the sequence distribution of PMMA, MPM-5, MPM-10, and MPMS-1010 were analyzed by 600 MHz 13C-NMR and the results were shown in Fig. 5. In PMMA, except for C3 δ 45.50, which is unimodal, the other carbon atoms show multimodal distribution characteristics. Several characteristic peaks of carbon atoms on the benzene ring in the copolymer are distributed between δ 126.01–131.99 due to different chemical environments in the copolymer. For example, the chemical shift of MPMS-1010 is slightly lower than that of MPM-10. Secondly, the introduction of N-PMI not only resulted in the formation of peaks δ 48.53 corresponding to C6 and C7 on the main chain, but also affected the absorption peak δ 52.07 related to the geometric conformation of the side-chain methyl ester group (MPM-5, MPM-10), and a weak absorption peak appeared at δ 52.19 (MPMS-1010). Finally, the methylene carbons (C1), methyl carbons (C2), and carbonyl carbons (C4, C8, C9) (δ 176.15–178.40) on the backbone all exhibit absorption peaks at nearly constant chemical shifts.
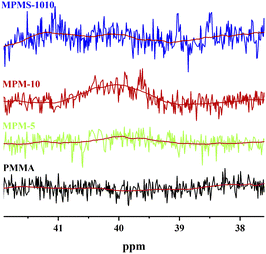
According to the literature,12 there is no absorption spectrum below 40.98 in the 13C NMR spectrum of N-PMI homo-polymer, while on the other hand, there is absorption spectrum below 44.51 in the carbon spectrum of PMMA homopolymer. Therefore, the new absorption peak appearing between these two bands in 13C NMR spectrum of the copolymer should be the absorption peak of the new triunit formed after the copolymerization. The stronger the intensity of the absorption peak, the more N-PMI units are embedded in the PMMA molecular chain. The spectrum of this region is amplified and simply fitted, and the results are shown in Fig. 6. It can be seen that MPM-5 has a very weak peak around δ 40, indicating that N-PMI is randomly distributed in the molecular chain of PMMA, and there is basically no N-PMI block. However, MPM-10 has an obvious absorption peak near δ 40, indicating that with the increase of N-PMI, some N-PMI blocks and repeating units appear. However, the absorption peak around δ 40 could not be observed in 13C-NMR of MPMS-1010. This is because St and N-PMI are prone to alternate copolymerization, so that St is embedded in the N-PMI repeating unit, and the absorption peak near δ 40 disappears. The random distribution of N-PMI in the PMMA molecular chain should be able to effectively restrict the free movement of the PMMA chain segment, thereby improving its heat resistance. However, when the content of N-PMI continued to increase to 10 wt%, some blocks or repeating units of N-PMI would appear, which weakened the tendency for PMMA to improve heat resistance.
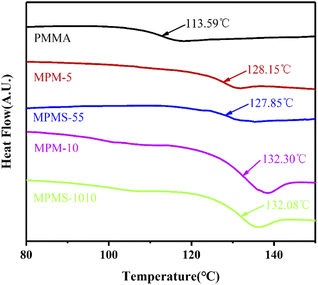
The glass transition temperatures (Tg) of these copolymers were determined by DSC and the results were shown in Fig. 7. It can be seen that there is only one stair-stepping glass transition in all DSC curves, indicating that all systems are in a single-phase state, thus indicating that the copolymerization belongs to random copolymerization. However, the Tg of PMMA is only 113.59 °C, while the Tgs of MPM-5, MPMS-55, MPM-10 and MPMS-1010 reach 128.15 °C, 127.85 °C, 132.20 °C and 132.08 °C, respectively. Comparing the results of PMMA, MPM-5 and MPM-10, it can be seen that the Tg of the copolymer gradually increases with the increase of N-PMI content. This is because after the N-PMI unit with a rigid five-membered ring was introduced into the main chain of the PMMA molecule, the bulky side group greatly restricted the movement of the PMMA segment, resulting in an increase in Tg. The introduction of only 5 wt% N-PMI can increase the Tg by 15 °C. This also proves from the other aspect that N-PMI is evenly distributed in each segments of the PMMA main chain, thus effectively restricting the movement of the segments. On the other hand, however, the Tg of MPM-10 was only about 4 °C higher than that of MPM-5. This again suggests that with the introduction of more N-PMI, some blocks or repeating units of N-PMI may appear, thereby reducing the effect of N-PMI, which is consistent with the results of 13C-NMR. However, the participation of St in the copolymerization of PMMA has little effect on the Tg of the copolymer, indicating that the introduction of St has no effect on restricting the movement of the PMMA segment, nor does it contribute significantly to promoting the participation of N-PMI in the copolymerization of MMA.
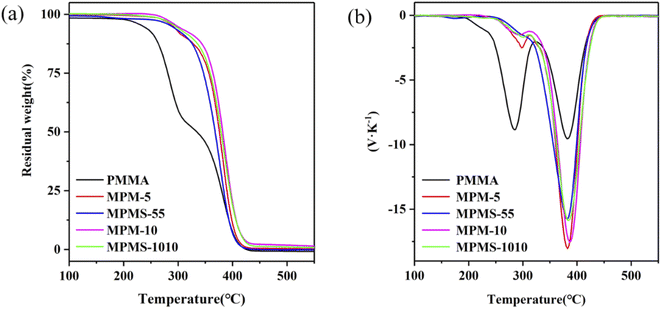
The thermal degradation properties of the copolymers were analyzed by TGA and DTG curves, and the initial decomposition temperature and 50% weight loss temperature of the copolymers were obtained, marked as Tonset and T50, as shown in Table 1. Among them, the Tonset and T50 of pure PMMA are 240 °C and 335 °C, respectively. The Tonset and T50 of MPM-5 and MPM-10 are 290 °C, 376 °C and 298 °C, 382 °C respectively, which are much higher than that of PMMA. It shows that with the increase of N-PMI content, the Tonset and T50 values of the copolymer also increase greatly, that is, the introduction of N-PMI can significantly improve the thermal stability of the copolymer. It can be seen from the DTG curve that there are two peaks around 297 °C and 382 °C on the weight loss of the copolymer (labeled as TMAX1 and TMAX2, respectively). It can be seen that with the introduction of N-PMI, the thermal degradation process of TMAX1 has been significantly weakened. On the contrary, the thermal degradation process of TMAX2 has been strengthened. It seems that the thermal degradation process of TMAX1 is all concentrated in the thermal degradation process of TMAX2. It is well known that the polymerization of MMA is mainly terminated by disproportionation, resulting in the electron-withdrawing carbonyl group at the end group. Once free radicals are generated at high temperature, the carbonyl group can easily become the starting point of depolymerization. It can be seen that below 300 °C, the thermal degradation of PMMA is mainly caused by the depolymerization of end groups; while the thermal degradation process above 300 °C should be caused by the random chain scission of the main chain.26–28 Since the introduction of N-PMI into the main chain can effectively block the thermal degradation process of removing end groups, the initial degradation process corresponding to TMAX1 is weakened. Moreover, the comparison of the thermal degradation resistance of MPM-5 and MPM-10 is completely corresponding to the results of DSC. By comparing the thermal degradation resistance of MPM-5 and MPMS-55, MPM-10 and MPMS-1010, the introduction of St is more effective than N-PMI in both the thermal degradation process of TMAX1 and the thermal degradation process of TMAX2. The former should be attributed to the better dispersion of St in the PMMA molecular chain, while the latter may be due to the introduction of the pendant benzene ring, which is more conducive to the formation of carbonization (Fig. 8).
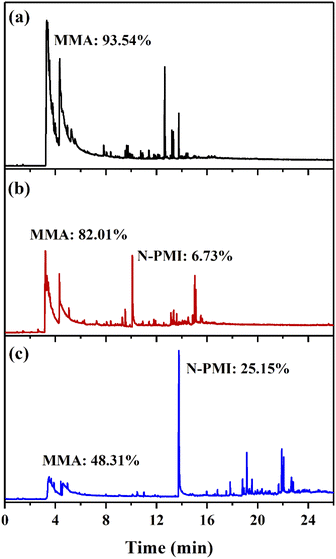
In order to determine the mechanism of the heat-resistant modification of N-PMI, the analysis was performed by py-GC/MS at 300 °C (near TMAX1) under an inert atmosphere. The ion current spectrum of each sample is shown in Fig. 9, and the type of the product is qualitatively obtained by comparing with the NIST counting library. It can be seen from the spectrum of pure PMMA that multiple peaks in the range of 3.2–6 min correspond to MMA, that is, the main product of pyrolysis is MMA. However, the peak shapes of several peaks are obviously broadened, indicating that MMA is gradually depolymerized and released during the pyrolysis process. This is consistent with the mechanism of PMMA degradation from end groups. In the copolymer samples, except for MMA, the main peak positions corresponding to N-PMI are located at 10.1 min and 13.8 min in sample MPM-5 and sample MPM-10, respectively. Compared with the peak area of pure PMMA samples, the introduction of N-PMI greatly reduces the amount of degraded MMA from the end groups, thereby improving the thermal resistance of the copolymers. From the ratio of peak areas, the ratios of the mass of MMA to N-PMI in the degradation products of MPM-5 and MPM-10 are 82.01%![[thin space (1/6-em)]](https://www.rsc.org/images/entities/char_2009.gif) :
:![[thin space (1/6-em)]](https://www.rsc.org/images/entities/char_2009.gif) 6.73% and 48.31%
6.73% and 48.31%![[thin space (1/6-em)]](https://www.rsc.org/images/entities/char_2009.gif) :
:![[thin space (1/6-em)]](https://www.rsc.org/images/entities/char_2009.gif) 25.15%, respectively, which are 1.68 and 4.5 times of the ratio of the two monomers in the copolymer composition. This indicates that the introduction of N-PMI blocks the zipper-lick thermal degradation of MMA from the end groups, so that the proportion of N-PMI in the thermal degradation product is higher than that in the copolymer composition, which is consistent with the previous analysis. In summary, the introduced N-PMI improves the Tonset and T50 of the copolymer, that is, its thermal stability by blocking the thermal degradation process of zipper-like removal of MMA from the end group.
25.15%, respectively, which are 1.68 and 4.5 times of the ratio of the two monomers in the copolymer composition. This indicates that the introduction of N-PMI blocks the zipper-lick thermal degradation of MMA from the end groups, so that the proportion of N-PMI in the thermal degradation product is higher than that in the copolymer composition, which is consistent with the previous analysis. In summary, the introduced N-PMI improves the Tonset and T50 of the copolymer, that is, its thermal stability by blocking the thermal degradation process of zipper-like removal of MMA from the end group.
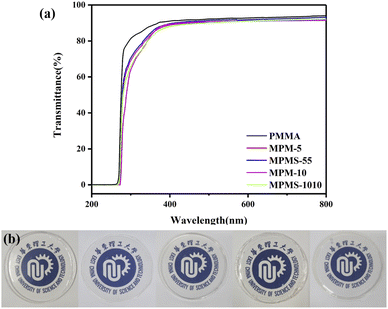
The light transmittance of the sample flakes (diameter = 5 cm, thickness = 0.4 ± 0.05 mm) was tested by UV-Vis spectrophotometry, and the results are shown in Fig. 10. The visible light transmittance of PMMA is 91%. With the increase of N-PMI content, the transparency of the samples decreased and the yellowness index increased, but this phenomenon was only obvious in the ultraviolet region. Compared with MPM-5 and MPM-10, the light transmittance of the copolymers MPMS-55 and MPMS-1010 after the introduction of St was slightly improved, and the reason remains to be further studied. Overall, it can be seen from both the light transmittance and the actual photo comparison that the copolymer still maintains high transparency, and its visible light transmittance is not less than 87%.
In addition, PMMA is limited in molding processing and secondary processing due to the disadvantages of high melt viscosity. To determine the effect of N-PMI and St on the processing flow properties of PMMA, the melt flow rate (MFR) of the melt was tested and the results were shown in Table 4. It can be seen from the results that both N-PMI and St can improve the MFR of PMMA to a certain extent, but the effect of St is more significant, which is very beneficial for improving the processing performance of PMMA. The mechanical properties of the samples were also shown in Table 4. It can be seen that except the tensile strength and impact strength of MPM-5 are slightly higher than those of PMMA, the tensile strength and impact strength of other copolymers decreased with the increase of N-PMI and St content. On the contrary, the flexural strength and flexural modulus increased with the increase of N-PMI and St content. This may be because the introduction of N-PMI reduces the packing density between molecular chains, but increases the rigidity of the molecular chains (see the increase of Tg), which is the combined effect of these two effects.
| Samples | MFR (g 10 min−1) | Tensile strength (MPa) | Flexural strength (MPa) | Flexural modulus (MPa) | Impact strength (KJ m−2) |
|---|---|---|---|---|---|
| PMMA | 2.1 ± 0.2 | 75.0 ± 1.8 | 118.7 ± 3.0 | 3861.0 ± 105.2 | 20.4 ± 0.7 |
| MPM-5 | 3.0 ± 0.1 | 77.2 ± 2.0 | 120.5 ± 2.6 | 3915.4 ± 98.8 | 22.3 ± 0.4 |
| MPMS-55 | 4.5 ± 0.3 | 72.5 ± 1.7 | 126.1 ± 1.5 | 4016 ± 110.3 | 18.2 ± 1.0 |
| MPM-10 | 5.0 ± 0.2 | 70.2 ± 2.1 | 128.6 ± 4.2 | 4204 ± 78.8 | 16.9 ± 0.6 |
| MPMS-1010 | 7.8 ± 0.1 | 68.8 ± 1.3 | 133.8 ± 2.8 | 4335 ± 108.2 | 15.7 ± 1.2 |
Finally, in order to judge whether the copolymer of N-PMI and MMA has antibacterial properties, the samples were tested by shaking method before and after washing, and the results were shown in Fig. 11. First, the pure PMMA sample did not have antibacterial effect on E. coli and S. aureus, and its antibacterial rate was 0, and a large number of colonies appeared on the agar plate. However, after the bacteria contacting and shaking with any one kind of the copolymer sample, there were almost no colonies on the agar plate, and the bacteriostatic rates against E. coli and S. aureus were all over 99%, indicating that the copolymer has good broad-spectrum antibacterial properties. After washing by water, the antibacterial effect is basically not reduced, and the antibacterial rate can be maintained at about 99%. However, after the copolymerized sample was extracted with methanol, all free N-PMI monomers that could not have participated in the copolymerization were basically removed, and the antibacterial rate of the sample was greatly reduced immediately, and a large number of colonies appeared on the agar plate, and the antibacterial performance basically disappeared. Therefore, it can be known that the residual free N-PMI monomer plays a key role in the antibacterial performance of these copolymers.
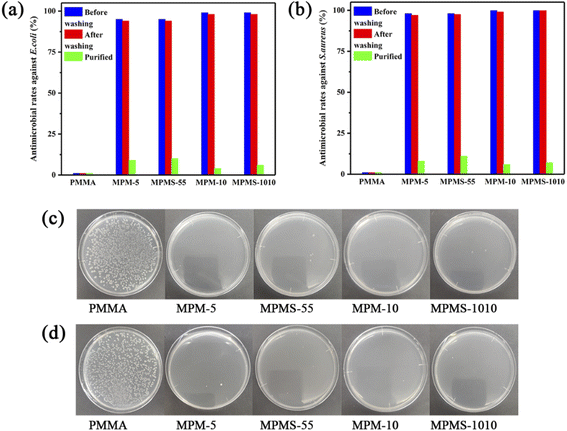 | ||
| Fig. 11 Antimicrobial rates of copolymers against E. coli (a) and S. aureus (b), antimicrobial photographs (104 CFU ml−1) against E. coli (c) and S. aureus (d). | ||
Compared with other method that used to prepare antibacterial PMMA, most of them have to mix other antibacterial agents into PMMA through reprocessing, which destroys the transparency and mechanical properties of PMMA almost without exception. It can be seen that using the method of reactive extrusion copolymerization to make N-PMI participate in the copolymerization of MMA is the best choice for preparing antibacterial PMMA with high heat resistance, high mechanical properties and high transparency.
4 Conclusion
By adopting the method of bulk reactive extrusion copolymerization, N-PMI and St and MMA were copolymerized. Although it is extremely difficult for N-PMI to participate in the copolymerization with MMA according to the classical free radical copolymerization theory, N-PMI and MMA could not only achieve copolymerization, but even reached the level of azeotropic copolymerization. The bulk copolymerization kinetics and composition analysis showed that the factor that changed the classical free radical copolymerization theory was the viscosity of the system. Secondly, the insertion of the N-PMI unit into the molecular chain of PMMA greatly improved the stiffness of its molecular chain and its Tg; at the same time, the insertion of the N-PMI unit also effectively blocked the zipper-type removed degradation from the end group that often occurred in PMMA. When the mass content of N-PMI copolymer reached 10%, the Tg, Tonset and T50 of the copolymer increased by 19 °C, 58 °C and 47 °C, respectively. In addition, St, N-PMI can also significantly improved the processing fluidity of PMMA copolymer, and after St participates in the copolymerization, the MFR could be increased by 3.5 times. Furthermore, the copolymer not only has good mechanical properties and transparency, but also has good antibacterial properties against E. coli and S. aureus, which is the effect of trace residual N-PMI. This provides an excellent reference for the preparation of antibacterial PMMA with high heat resistance, high mechanical properties and high transparency.Author contributions
H. S. carried out the kinetic tests and reactive extrusion, performed the characterization, and prepared the manuscript; Q. X. Z., A. N. Z., Y. G., D. F. and X. X. W helped design and supervise the experiments and revised the manuscript.Conflicts of interest
There are no conflicts to declare.Acknowledgements
The authors are grateful for the financial support from the National Natural Science Foundation of China (No. 50573020).References
- U. Ali, K. J. B. A. Karim and N. A. Buang, Polym. Rev., 2015, 55, 678–705 CrossRef CAS.
- Y. Shu-Ling, Z. Chao-Yuan and K. Shiao-Wei, Polymers, 2015, 7, 1379–1388 CrossRef.
- Y. Zhang, Y. Y. Chen, L. Huang, Z. G. Chai, L. J. Shen and Y. H. Xiao, Sci. Rep., 2017, 7, 1547 CrossRef PubMed.
- P. P. Wu, D. M. Zhao, L. X. Li, H. S. Wang and G. D. Liu, Polym. Eng. Sci., 2013, 53, 2370–2377 CrossRef CAS.
- C. Chin-Wei, L. Yung-Chih, W. Lei, H. Chiharu, S. Yoshinori and T. Hayakawa, Polymers, 2014, 6, 926–948 CrossRef.
- S. Thamizharasi and B. S. R. Reddy, J. Appl. Polym. Sci., 2001, 1870–1879 CrossRef CAS.
- A. Omayu and A. Matsumoto, Polym. J., 2008, 40, 736–742 CrossRef CAS.
- D. Becker, E. Hage and L. A. Pessan, J. Appl. Polym. Sci., 2007, 106, 3248–3252 CrossRef CAS.
- X. Linghan, L. Zhenguang, D. Jinglong, S. Lei, Z. Xiuping and Z. Huixuan, Colloid Polym. Sci., 2015, 2807–2813 Search PubMed.
- L. Lou, Y. Koike and Y. Okamoto, Polymer, 2011, 52, 3560–3564 CrossRef CAS.
- L. Lou, A. Tagaya, Y. Ide, Y. Koike and Y. Okamoto, J. Polym. Sci., Part A: Polym. Chem., 2012, 50, 3530–3536 CrossRef CAS.
- G. R. Shan, Z. X. Weng, Z. M. Huang and Z. R. Pan, J. Appl. Polym. Sci., 2015, 77, 2581–2587 CrossRef.
- P. K. Singh and A. S. Brar, J. Appl. Polym. Sci., 2006, 100, 2667–2676 CrossRef CAS.
- J. A. Wallach and S. J. Huang, Biomacromolecules, 2000, 1, 174–179 CrossRef CAS PubMed.
- K. J. Ganzeveld and L. P. B. M. Janssen, Can. J. Chem. Eng., 2010, 71, 411–418 CrossRef.
- I. Popa, Eur. Polym. J., 1997, 33, 1511–1514 CrossRef CAS.
- X. Yuan, Y. Guan, S. Li and A. Zheng, J. Appl. Polym. Sci., 2014, 131, 39429 CrossRef.
- X. Yuan, J. Wang, D. Shan and A. Zheng, Polym. Eng. Sci., 2015, 55, 1163–1169 CrossRef CAS.
- P. Zhan, J. Chen, A. Zheng, T. Huang, H. Shi, D. Wei, X. Xu and Y. Guan, Mater. Res. Express, 2019, 6, 025315 CrossRef.
- P. Zhan, J. Chen, A. Zheng, H. Shi, T. Wu, D. Wei, X. Xu and Y. Guan, Mater. Res. Express, 2020, 7, 095305 CrossRef CAS.
- P. Zhan, J. Chen, A. Zheng, H. Shi, F. Chen, D. Wei, X. Xu and Y. Guan, Eur. Polym. J., 2020, 122, 109272 CrossRef CAS.
- P. R. Dvornić and M. S. Jaćović, Polym. Eng. Sci., 1981, 21, 792–796 CrossRef.
- J. S. T. Bogunjoko and B. W. Brooks, Makromol. Chem., 1983, 184, 1603–1621 CrossRef CAS.
- N. Salewska, J. Boros-Majewska, I. Lacka, K. Chylinska, M. Sabisz, S. Milewski and M. J. Milewska, J. Enzyme Inhib. Med. Chem., 2012, 27, 117–124 CrossRef CAS.
- J. Echeverría, Cryst. Growth Des., 2017, 18, 506–512 CrossRef.
- B. J. Holland and J. N. Hay, Polym. Degrad. Stab., 2002, 77, 435–439 CrossRef CAS.
- T. Kashiwagi, T. Hirata and J. E. Brown, Macromolecules, 1985, 131–138 CrossRef CAS.
- T. Kashiwagi, A. Inaba, J. E. Brown, K. Hatada and E. Masuda, Macromolecules, 1986, 19, 2160–2168 CrossRef CAS.
| This journal is © The Royal Society of Chemistry 2022 |

