 Open Access Article
Enhanced stability of nitrogen doped porous carbon fiber on cathode materials for high performance lithium–sulfur batteries†
Xi Wu a,
Xiaohua Jiea,
Xinghua Liang*bd,
Suo Lib,
Lingxiao Lanbd,
Dan Xiee and
Yusi Liu
 *c
*c
aSchool of Materials and Energy, Guangdong University of Technology, Guangzhou 510006, China
bGuangxi Key Laboratory of Automobile Components and Vehicle Technology, Guangxi University of Science & Technology, Liuzhou 545006, P. R. China. E-mail: 309602373@qq.com
cCollege of Smart Energy, Shanghai Jiao Tong University, Shanghai 200240, P. R. China. E-mail: Yusiliu@sjtu.edu.cn
dNational Engineering Laboratory for Modern Materials Surface Engineering Technology, Guangdong Institute of New Materials, Guangdong Academy of Science, Guangzhou 510650, P. R. China
eDongfeng Xiaokang Moto Co., Ltd, Shiyan 442000, P. R. China
First published on 16th August 2022
Abstract
Lithium–sulfur (Li–S) batteries are considered to be one of the candidates for high-energy density storage systems due to their ultra-high theoretical specific capacity of 1675 mA h g−1. However, problems of rapid capacity decay, sharp expansion in volume of the active material, and the shuttle effect have severely restricted their subsequent development and utilization. Herein, we design a nitrogen-doped porous carbon nanofiber (NPCNF) network as a sulfur host by the template method. The NPCNF shows a feather-like structure. After loading sulfur, the NPCNF/S composite can maintain a hierarchically porous structure. A high discharge capacity of 1301 mA h g−1 is delivered for the NPCNT/S composite at 0.1C. The reversible charge/discharge capacity at 2C is 576 mA h g−1, and 700 mA h g−1 is maintained after 500 cycles at 0.5C. The high electrochemical performance of this NPCNT/S composite is attributed to the synergy effects of abundant N active sites and high electrical conductivity of the material.
1. Introduction
With the popularization of mobile electronic devices, the market has put forward higher requirements for the energy density of energy storage systems. However, traditional lithium-ion batteries can no longer meet the needs of fast-developing applications. It is highly desirable to develop next-generation energy storage devices with high energy densities. With their high theoretical specific capacity of 1675 mA h g−1 and low cost, lithium–sulfur batteries have attracted much attention in the materials of energy storage systems.In lithium–sulfur batteries, lithium metal is usually used as the negative electrode, and sulfur (S8) as the positive electrode. The final discharge product is Li2S.1 Pure sulfur first dissolve in the electrolyte and form long-chain lithium polysulfide.2–4 The rapid dissolution of soluble polysulfides reduces the active material of the electrode while also causing a sharp decrease in capacity during charging and discharging.5 In addition, poor conductivity of the final discharge material (mainly Li2S) and volume expansion of polysulfides limit the wide application of Li–S batteries.6,7 The former leads to the increase of internal resistance and affects the performance of the battery. The latter destroys the structure of the electrode, resulting in serious capacity attenuation.8 The shuttle of polysulfides is a key factor affecting the performance of Li–S batteries, which can be obviously suppressed by the increase in electrode conductivity.9,10
Carbon materials are ideal host material for sulfur by virtue of its excellent electrical conductivity, light weight and controllable structure.11–13 According to their spatial dimensions, carbon nanomaterials can be divided into three types: 0-dimensional nanomaterials (fullerenes),14 1-dimensional nanomaterials (carbon nanotube, carbon nanofiber)15 and 2-dimensional nanomaterials (graphene).16 For example, one-dimensional (1D) CNTs and 2D graphene doped/co-doped by various heteroatoms exhibit high catalytic activities through intermolecular charge transfer.17–20 Due to their unique electronic, optical, thermal, mechanical, and chemical properties, fullerenes (0D), carbon nanotubes (1D), and graphene (2D) carbon nanomaterials have provided researchers the opportunity to significant advances in fundamental and applied science.21 Among them, carbon nanofiber as one of the species in the form of one dimension exhibits the superior performance in the transportation of electrons and the outstanding strength of mechanics, which favor the construction of electron-ion transfer network. Developing the structural property of the materials with different dimensionality, improving the loading amount of sulfur, and enhancing the conductivity of the electrodes are of great significance for Li–S battery with high performance. Besides, doping of nitrogen can not only remarkably advance the conductivity of the carbon materials, but also introduce the active sites on the surface.22 Nitrogen-doped porous carbon as a sulfur host material was prepared by direct pyrolysis in an N2 atmosphere.23 The unique porous structure of the main material can effectively inhibit the dissolution of polysulfides in the process of charge and discharge, but the cycling performance of this material needs to be improved. Huang et al.24 design the hierarchically porous titanium dioxide to construct the sulfur host materials. The strong affinity of metal oxides and the physical interception of mesoporous structures can play a crucial role in the shuttle effect. However, the discharge specific capacity of this composite is slightly lower, about 1184 mA h g−1. Therefore, nitrogen-doped carbon materials are expected to be developed as the main body of sulfur in the direction of high electron conduction and strong physical and chemical adsorption of active materials.
In this paper, a nitrogen-doped porous carbon nanofiber (NPCNF) was prepared by template method as host material for Li–S batteries. The NPCNF with a feather-like morphology and shows high surface area of 1240 m2 g−1, with both mesopores and micropores, which increase the sulfur loading ability of the host. In the NPCNF material, the nitrogen content is 4.56 wt%, which help to improve conductivity of the material, and accelerate the reactivity of the electrodes. The NPCNF/S electrode shows excellent property with 70% sulfur content. DFT calculation of sulfur and NPCNF/S composite indicating that NPCNF nano 3D porous network channel is helpful to reduce the Li+ migration energy barrier. This innovative and simple template synthesis strategy aims to improve the cycle stability of working lithium batteries and provide a reference for the development of high-performance lithium sulfur batteries.
2. Experiment section
2.1. Preparation of the NPCNF
Based on our previous work,25 typical synthesis procedure, 1 g PEO-PPO-PEO (P123) was first dissolved in 6 mL C8H2OO4Si under stirring. Then 32 mL ethanol and 0.583 mL concentrated hydrochloric acid (HCl, 37%) were added in the solution. After adding 4 mL deionized water, 2.8 g of dicyandiamide (DCDA) was added the as-formed dispersion as a carbon source and nitrogen source. The white powder was dried at 80 °C overnight and then calcined in a tube furnace at 1000 °C for 120 min with N2. The ramping rate applied is 3 °C min−1. After cooling to room temperature, the sintered powder was removed into HF solution to wash the templates. After the etching process, the sample was dried at 60 °C for 12 h to obtain the final product NPCNF.2.2. Preparation of the NPCNF/S composite
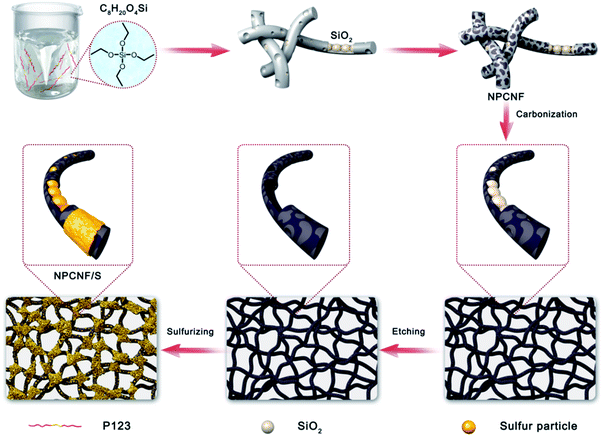
NPCNF sample was mixed with 70% and 80% pure sulfur by melt diffusion method. The sample was ground in a mortar for 40 minutes to ensure that NPCNF and sulfur were evenly mixed. The mixed sample was put into a crucible and sintered at a rate of 5 °C min−1 under 155 °C for 12 h in a nitrogen atmosphere to make the molten sulfur fully penetrate the carbon fiber. After cooling to room temperature, the samples were taken out and named NPCNF with different sulfur content as NPCNF/S-A (70% sulfur added, 1.5 mg cm−2) and NPCNF/S-B (80% sulfur added, 1.7 mg cm−2). The synthesis process of NPCNF/S preparation is shown in Fig. 1.2.3. Material characterizations
X-ray diffraction (XRD, D8-advance, Bruker) was used to analyze the phase of the sample, and thermogravimetric analysis (TGA) was used to determine the mass change with temperature in sulfur, NPCNF and NPCNF/S composites under the temperature condition of 10 °C min−1 in air atmosphere. Raman spectra (XploRA PLUS, HORIBA) was tested under a Raman microscope with a wavelength of 523 nm, and the composition and valence of the elements could be determined by X-ray photoelectron spectroscopy (XPS, K-Alpha, Thermo) under 5 kV. The Brunauer–Emmett–Teller (BET) equation was used to calculate the specific surface area. The microscopic morphology of the sample was characterized by scanning electron microscope (SEM, Sigma04-55, ZEISS) and transmission electron microscope (TEM, Titan Themis 200, FEI).2.4. Electrochemical measurements
NPCNF/S composite electrode, conductive carbon black and polyvinylidene fluoride (PVDF) binder were dissolved in the solvent N-methylpyrrolidone (NMP) at a mass ratio of 7![[thin space (1/6-em)]](https://www.rsc.org/images/entities/char_2009.gif) :
:![[thin space (1/6-em)]](https://www.rsc.org/images/entities/char_2009.gif) 2
2![[thin space (1/6-em)]](https://www.rsc.org/images/entities/char_2009.gif) :
:![[thin space (1/6-em)]](https://www.rsc.org/images/entities/char_2009.gif) 1 to prepare a uniform slurry. The slurry was coated on aluminum foil and then dried in a vacuum drying oven for 12 h. The diaphragm, anode and cathode were celgard2400 polypropylene membrane, lithium sheet and NPCNF/S respectively. The electrolyte was 1.0 mol LiTFSI in DOL
1 to prepare a uniform slurry. The slurry was coated on aluminum foil and then dried in a vacuum drying oven for 12 h. The diaphragm, anode and cathode were celgard2400 polypropylene membrane, lithium sheet and NPCNF/S respectively. The electrolyte was 1.0 mol LiTFSI in DOL![[thin space (1/6-em)]](https://www.rsc.org/images/entities/char_2009.gif) :
:![[thin space (1/6-em)]](https://www.rsc.org/images/entities/char_2009.gif) DME = 1
DME = 1![[thin space (1/6-em)]](https://www.rsc.org/images/entities/char_2009.gif) :
:![[thin space (1/6-em)]](https://www.rsc.org/images/entities/char_2009.gif) 1 vol% with 1.0 wt% LiNO3, about 20 μL.26 Assemble CR2032 button batteries in a vacuum glove box. The cycling tests of galvanostatic charge/discharge were conducted between 1.7–2.8 V by cell test system (CT-400, Neware). Subsequently, an electrochemical workstation (DH-7000, Donghua) was used to perform a cyclic voltammetry (CV) test at 1.6–3 V with 0.2 mV s−1, and conduct electrochemical impedance spectroscopy (EIS) test at 105 to 10−2 Hz.
1 vol% with 1.0 wt% LiNO3, about 20 μL.26 Assemble CR2032 button batteries in a vacuum glove box. The cycling tests of galvanostatic charge/discharge were conducted between 1.7–2.8 V by cell test system (CT-400, Neware). Subsequently, an electrochemical workstation (DH-7000, Donghua) was used to perform a cyclic voltammetry (CV) test at 1.6–3 V with 0.2 mV s−1, and conduct electrochemical impedance spectroscopy (EIS) test at 105 to 10−2 Hz.
3. Result and discussion
3.1. Structural and morphological characterization
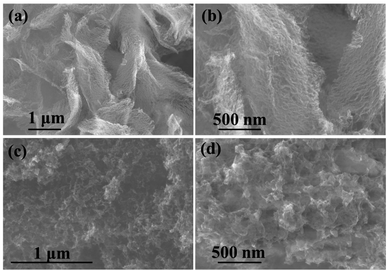
The XRD of NPCNF and NPCNF/S-A are shown in Fig. 2a. The XRD of NPCNF/S-B is shown in Fig. S1.† The two diffraction peaks of NPCNF at 26.4° and 42.2° correspond to the (002) and (100) planes of graphitic carbon (JCPDS No. 41-1487), respectively, indicating that a certain amount of graphitized amorphous carbon has formed in the material. The successful loading of sulfur in NPCNF to form the coating pattern in Fig. 1 caused a large amount of sulfur outside the carbon fibers to penetrate into the fibers. Therefore, the diffraction peak intensities of NPCNF/S-A and NPCNF/S-B in the XRD image are greatly reduced compared to elemental sulfur,27 and the corresponding morphology can be observed in the SEM image Fig. 3c, d and S2a, b.† Fig. 2b exhibits the Raman spectrum of NPCNF and NPCNF/S-A. Correspondingly, the Raman spectrum of NPCNF/S–B is shown in Fig. S1a.† In the spectrum, the peaks located at 1350 cm−1 and 1579 cm−1 are the D band and G band in the carbon material. The ID/IG values in the materials are all greater than 1, indicating that the nitrogen-doped carbon materials have a higher degree of graphitization. The higher the degree of graphitization of the base frame, the better the charge transfer between the cathode and the anode.28Fig. 3a and b can be seen that the NPCNF after etching is bent and interwoven to form a multilayer irregular, curved and wrinkled network structure. This is because the SiO2 nanoparticles produced by the hydrolysis of C8H2OO4Si serve as a template and structure directing agent during the preparation process. After being washed away by HF, the final sample formed a unique “feather-like” structure with the pore diameter mostly about 0.1–4 nm and the micropores were conducive to the loading of sulfur and sulfide in the electrode. And the average diameter of nitrogen-doped carbon nanofibers is about 15–25 nm. In addition, the large number of microporous structures on the carbon fiber can absorb polysulfides through physical action, which is conducive to the transmission of electrons and ions. After loading sulfur on the original carbon fiber framework, the diameter of the fiber becomes obviously thicker due to the accumulation and coating of sulfur outside the framework, but the original loose porous structure is still maintained (Fig. 3c, d and S2a, b†). This unique porous network structure provides NPCNF/S electrode with a larger reaction specific surface area, electron transport channel and larger porosity, which relieves the “shuttle effect” of Li–S batteries to a certain extent, and enhances the material conductivity and cycle stability are shown in Fig. 8d and 9.29
From the data in Fig. 4a, it can be concluded that the specific surface area of NPCNF is 1240 m2 g−1, and the curve is type IV adsorption and desorption isotherm. The pore size of NPCNF is concentrated in the range of 0.8–4 nm, indicating the coexistence of micropore and mesopore in NPCNF. Therefore, because NPCNF has a higher specific surface area and hierarchical porosity, it can load a larger amount of sulfur while also limiting the dissolution of polysulfides during the charge/discharge process. Different sulfur content in NPCNF/S is quantitatively detected by carrying out TGA in our work. It can be seen from Fig. 4b that the quality of the NPCNF composite material is almost unchanged between 200 °C and 300 °C, so the part of the NPCNF/S composite material lost in this temperature range is elemental sulfur. The corresponding weight loss rates of NPCNF/S-A and NPCNF/S-B are 60.4 wt% and 70.2 wt% (Fig. S3†).
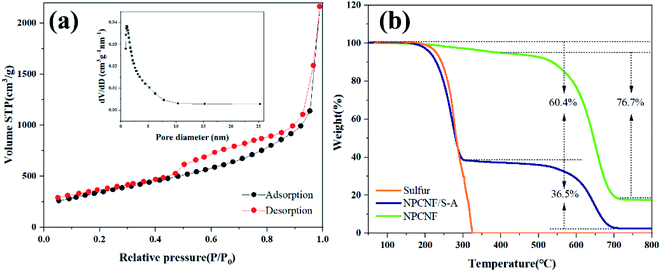 | ||
| Fig. 4 (a) N2 adsorption/desorption isotherms and pore diameter distribution of NPCNF. (b)TGA curves of S, NPCNF and NPCNF/S-A at 10 °C min−1 in air atmosphere. | ||
The microstructure of NPCNF/S-A was further observed through transmission electron microscopy (TEM) images (Fig. 5a and b). The structure of NPCNF/S-A observed in TEM image is verified in the SEM observation results, nitrogen doped carbon nanofibers intertwined with sulfur nanoparticles attached on the surface. The average diameter sulfur nanoparticles are 10–15 nm. On the basis of the area 1 in Fig. 5b, the high-resolution TEM study of the edge of the material is shown in Fig. 5c. It presents that the deepest part of the region is the (221) plane of sulfur, and part sulfur generating at the edge position. Elemental sulfur is loaded in the network and the edge zone, which is based on carbon–nitrogen complex as shown in Fig. 1. Fig. 5d is the spot diffraction patterns of area 1 in NPCNF/S-A, showing the (221) crystal plane of sulfur. And Fig. S4† show the spot diffraction patterns of area 2 in NPCNF/S-A with the amorphous diffraction rings are the (100) and (002) crystal planes of the carbon material. The presence of the amorphous diffraction ring confirmed the presence of amorphous graphitic carbon in the material, and the amorphous carbon conductive network was directionally grown according to the distribution of the carbon fiber skeleton (Fig. 3a and b).
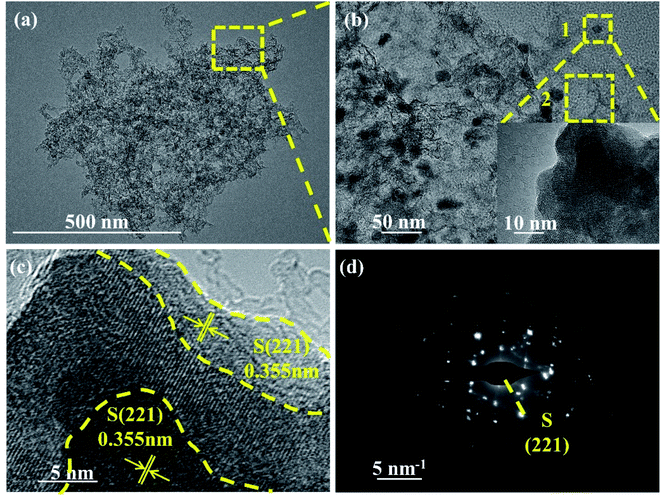 | ||
| Fig. 5 (a) Low and (b) high-TEM images of NPCNF/S-A. (c) HRTEM images of area 1 in (b). (d) The SAED pattern of area 1 in (b). | ||
The EDS of the composite material NPCNF/S-A is performed on the designated area shown in Fig. 6a, and the corresponding element mapping images are shown in Fig. 6c and d. It can be seen that the C, N and S elements are uniformly distributed in the composite material. Among them, the content of nitrogen is 4.56 wt%.
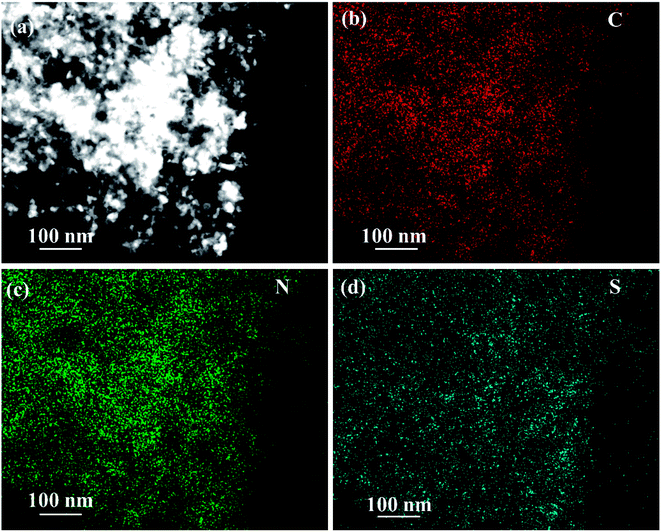 | ||
| Fig. 6 (a) STEM image of NPCNF/S-A and corresponding STEM EDS elemental mapping of (b) C, (c) N and (d) S. | ||
In order to further confirm the chemical state and nitrogen doping of the NPCNF/S-A composite material, the XPS analysis of NPCNF/S-A is shown in Fig. 7. As shown in Fig. 7a, four characteristic peaks near 167.1, 284.2, 400.1 and 532.4 eV are observed in the XPS survey spectrum, which are related to S 2p, C 1s, N 1s and O 1s, respectively. Fig. 7b–d shows the high-resolution C 1s, N 1s and S 2p spectra of NPCNF/S-A. As shown in Fig. 7b, the C 1s spectra can be divided into four peaks located at 284.6, 285.3, 286.4 and 289.6 eV, which are related to the chemical bonds of C–C/C![[double bond, length as m-dash]](https://www.rsc.org/images/entities/char_e001.gif) C, C–O/C–N, C
C, C–O/C–N, C![[double bond, length as m-dash]](https://www.rsc.org/images/entities/char_e001.gif) O and O–C
O and O–C![[double bond, length as m-dash]](https://www.rsc.org/images/entities/char_e001.gif) O, respectively.30 In Fig. 7c, the high-resolution N 1s has 3 typical peaks, 397.5, 399.5 and 400.5 eV, these three peaks are related to pyridine nitrogen, pyrrole nitrogen and graphitic nitrogen, which further proves that there is abundant nitrogen doping in the NPCNF lattice.31,32 Graphite nitrogen can provide electrons between the layers of the material, which can effectively improve the conductivity.22 Pyridine and pyrrole nitrogen can form Li–N chemical bonds during the battery cycles to capture polysulfides and reduce the polysulfides in the electrolyte dissolve.33 For the spectrum of S 2p in Fig. 7d, the three peaks located at 163.6, 164.8 and 168.2 eV correspond to S 2p3/2, S 2p1/2 and S–O, respectively, confirming the strong interaction between sulfur and NPCNF.26
O, respectively.30 In Fig. 7c, the high-resolution N 1s has 3 typical peaks, 397.5, 399.5 and 400.5 eV, these three peaks are related to pyridine nitrogen, pyrrole nitrogen and graphitic nitrogen, which further proves that there is abundant nitrogen doping in the NPCNF lattice.31,32 Graphite nitrogen can provide electrons between the layers of the material, which can effectively improve the conductivity.22 Pyridine and pyrrole nitrogen can form Li–N chemical bonds during the battery cycles to capture polysulfides and reduce the polysulfides in the electrolyte dissolve.33 For the spectrum of S 2p in Fig. 7d, the three peaks located at 163.6, 164.8 and 168.2 eV correspond to S 2p3/2, S 2p1/2 and S–O, respectively, confirming the strong interaction between sulfur and NPCNF.26
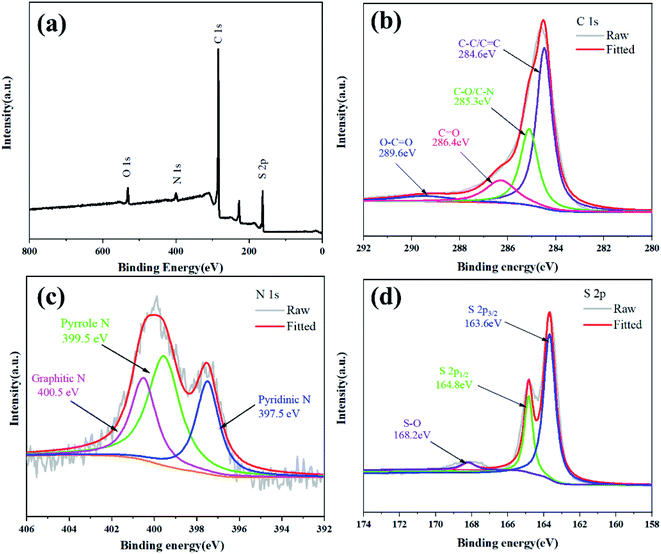 | ||
| Fig. 7 (a) XPS survey spectrum of NPCNF/S-A. The high-resolution XPS spectra of (b) C 1s, (c) N 1s, (d) S 2p electrons in NPCNF/S-A. | ||
 | ||
| Fig. 9 The cycling capacities and coulomb efficiency of sulfur, NPCNF/S-A and NPCNF-B at 0.5C over 500 cycles. | ||
3.2. Electrochemical performance
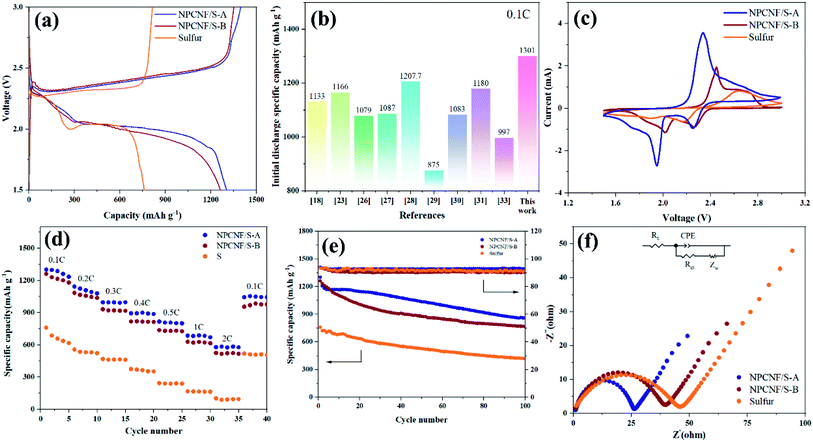
Fig. 8a shows the first charge/discharge curves of sulfur, NPCNF/S-A, and NPCNF/S-B cathodes at 0.1C. Excellent initial discharge capacities of approximately 1301 (NPCNF/S-A) and 1261 (NPCNF/S-B) mA h g−1 are achieved. Among them, the discharge specific capacity of sulfur electrode is much lower than that of NPCNF/S composite. Compared with NPCNF/S-B, NPCNF/S-A has more discharge specific capacity, and the gap between the discharge platform and the charging platform is smaller. This shows that the composite material NPCNF/S-A could reduce the polarization of the battery during charging/discharging, and the sulfur utilization rate is the best.27,34 For the same production of NPCNF, the specific discharge capacity achieved by the “template method” used in this study is higher than that of some similar studies, as shown in Fig. 8b.26,32,35–40The CV curves of sulfur, NPCNF/S-A, and NPCNF/S-B electrodes at a scanning rate of 0.2 mV s−1 are shown in Fig. 8c. Since there are two reduction peaks at 2.29 V and 2 V, attributed to the reduction of S8 to Li2Sn (4 ≤ n ≤ 8) and Li2S2/Li2S during the discharge process. The oxidation peak at 2.4 V indicates that Li2S2/Li2S was oxidized during charging.41–43 It is consistent with the phenomenon in the charge/discharge curve of Fig. 8a.
The rate performance of the NPCNF/S electrode is evaluated at various current densities ranging from 0.1C to 2C (Fig. 8d). After loading with sulfur, the rate performance of NPCNF was significantly improved. Cycled at 2C, a specific discharge capacity of 576 mA h g−1 is achieved for the NPCNF/S-A electrode, higher than that of the sulfur electrode (102 mA h g−1). This result demonstrates the important role of NPCNF network for improving the rate performance of Li–S electrodes. Specific discharge capacities of 1301 mA h g−1 (0.1C, 1st), 1141 mA h g−1 (0.2C, 10th), 996 mA h g−1 (0.3C, 15th), 893 mA h g−1 (0.4C, 20th), 815 mA h g−1 (0.5C, 25th), 684 mA h g−1 (1C, 30th) and 576 mA h g−1 (2C, 35th) are achieved for the NPCNF/S-A electrode, demonstrating its excellent rate capability. When the rate is restored to 0.1C, a specific capacity of 1044 mA h g−1 is restored, indicating the good reversibility of the NPCNF/S-A electrode. It can be seen that the discharge specific capacity of NPCNF/S-A at 2C still maintains 44.3%, while that of NPCNF/S-B is 41.5% and sulfur is only 13.2%. NPCNF improves the rate performance of the sulfur active material.
Cyclic performances of the sulfur, NPCNF/S-A and NPCNF/S-B electrodes are shown in Fig. 8e. After 100 cycles at 0.1C, dramatic decrease in the capacity is observed for the sulfur electrode and a low specific capacity of approximately 419 mA h g−1 is maintained, showing its very poor cycling performance. For the NPCNF/S-A electrode, a high specific discharge capacity approximately 857 mA h g−1 is maintained even after 100 cycles at 0.1C, the cycling performance of the electrode is improved. The overall performance of NPCNF/S composite materials in 100 cycles are higher than that of sulfur, which shows that the unique structure of NPCNF/S composite material can improve the cycles stability of Li–S materials. This is also confirmed in 500 discharge cycles (Fig. 9).
EIS of sulfur and NPCNF/S-A at 0.1C before the charge/discharge cycles (Fig. 8f) is performed. The curve consists of a mid-high frequency semicircle and a low frequency diagonal line. The semicircle in the middle and high frequency region is attributed to the charge transfer process between the electrolyte and the electrode, which is expressed as charge transfer resistance (Rct) in the equivalent circuit model. The diagonal line shown in the low frequency region is related to the dissolution rate of lithium ions in the electrode material, which is attributed to the spread resistance (Zw) of ion diffusion characteristics. The Rct of sulfur, NPCNF/S-A and NPCNF/S-B batteries are 44.95 Ω, 25.22 Ω and 38.48 Ω, respectively, indicating that the composite material NPCNF/S-A has good conductivity. At the same time, it can be concluded that the Rct of NPCNF/S-A is the smallest, indicating that it has a higher sulfur utilization rate and excellent electrochemical performance.
Fig. 9 shows the discharge performance and coulomb efficiency of sulfur and NPCNF/S-A at 0.5C for 500 cycles. The NPCNF/S-A electrode has a high initial capacity of 1123 mA h g−1. It can be seen from the figure that after 500 cycles, the specific discharge capacity of NPCNF/S-A is maintained at 700 mA h g−1, which is higher than that of NPCNF/S-B (247 mA h g−1) and sulfur (211 mA h g−1). It shows that the utilization rate of sulfur in NPCNF/S-A is higher and the cycle performance is better. The difference of sulfur content also affects the performance of composite materials.44,45 The high-efficiency conductive frame in the NPCNF/S composite material can provide embedding channels for the polysulfides formed during the charge/discharge cycles and adapt to its volume changes, thereby reducing the impact of the “shuttle effect” in the charge/discharge. On the other hand, the existence of the porous network also facilitates the penetration of the electrolyte into the pole pieces, thereby accelerating the insertion and extraction of lithium ions between the cathode and anode.46 The excessively high sulfur content in NPCNF/S-B makes sulfur and Li2S/Li2S2 deposited on the surface of the conductive substrate during the long-cycle charging/discharging process, disrupting the arrangement of the original high-efficiency sulfur particles and also blocking the conduction of other polysulfides in the electrolyte. This reduces the cycle efficiency of the material, and also causes the synergistic effect of the material's mesopores and micropores to fail to fully play.29
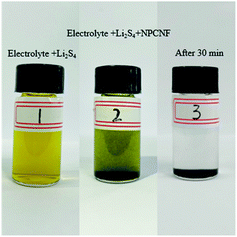
Fig. 10 shows the adsorption experiment of NPCNF for Li2S4. Add Li2S4 to the electrolyte (1.0 mol LiTFSI in DOL![[thin space (1/6-em)]](https://www.rsc.org/images/entities/char_2009.gif) :
:![[thin space (1/6-em)]](https://www.rsc.org/images/entities/char_2009.gif) DME = 1
DME = 1![[thin space (1/6-em)]](https://www.rsc.org/images/entities/char_2009.gif) :
:![[thin space (1/6-em)]](https://www.rsc.org/images/entities/char_2009.gif) 1 vol% with 1.0% LiNO3) to form a yellow solution marked as Bottle No. 1. Add 8 mg of NPCNF (Bottle No. 2) and leave for 30 minutes. Then, the solution in Bottle No. 3 changed from yellow to clear. In the adsorption test, the color of the solution in the No. 3 bottle was clear, which proved that the prepared NPCNF had a significant adsorption effect on sulfides.
1 vol% with 1.0% LiNO3) to form a yellow solution marked as Bottle No. 1. Add 8 mg of NPCNF (Bottle No. 2) and leave for 30 minutes. Then, the solution in Bottle No. 3 changed from yellow to clear. In the adsorption test, the color of the solution in the No. 3 bottle was clear, which proved that the prepared NPCNF had a significant adsorption effect on sulfides.
The performance of rechargeable batteries is determined by the difficulty of lithium ion migration in electrode materials. If lithium ion has a small energy barrier on NPCNF/S, the charge transfer rate will be fast and the battery performance will be better.47 Therefore, DFT calculation48 is used to study the lithium ion migration barrier (Fig. 11). The energy barrier of lithium ion migration in NPCNF/S-A composite is 0.333eV, and lower than that of S (0.721eV). These results explain the electrochemical behavior of the two materials, indicating that NPCNF nano 3D porous network channel is helpful to promote lithium ion migration.
 | ||
| Fig. 11 (a and b) Schematic diagram of the direction of Li+ migration channel. (c) Theoretical elucidation of Li+ migration behaviors in the sulfur and NPCNF/S-A. | ||
4. Conclusion
Here, the NPCNF is prepared by the template method as the high-efficiency conductive network and framework of the sulfur electrode active material. The following conclusions are obtained by comparing the sulfur content of different loads:(i) The NPCNF/S cathode material with a “feather” network nanostructure is successfully prepared by the template method. The doping of nitrogen and the synergistic effect of mesopores and micropores provide sufficient active sites and chemical anchors for polysulfides during charge/discharge, reducing the energy barrier of Li+ migration in the material. Improved cycle stability, rate performance and first charge/discharge specific capacity, while suppressing the phenomenon of “shuttle effect”. The first discharge specific capacity of NPCNF/S-A with loading of 60.4 wt% sulfur is 1301 mA h g−1, and the discharge capacity of 576 mA h g−1 at 2C is achieved.
(ii) The specific capacities of NPCNF/S-A are 857 mA h g−1 and 700 mA h g−1 after 100 cycles at 0.1C and 500 cycles at 0.5C, respectively, which are higher than that of sulfur material (419 mA h g−1 and 211 mA h g−1). This shows that the NPCNF material with net-like nanostructure can significantly improve the cycle stability of Li–S batteries. The Rct of sulfur and NPCNF/S-A are 44.95 Ω and 25.22 Ω, respectively, indicating that the composite material NPCNF/S-A has good conductivity. The reason for these phenomena is that the energy barrier of lithium ion migration in NPCNF/S-A (0.333 eV) is much lower than that in sulfur (0.721 eV).
(iii) The nitrogen doped porous carbon method provides a new way to reinforced performance Li–S batteries.
Conflicts of interest
There are no conflicts of interest to declare.Acknowledgements
This research was supported by the Guangxi Natural Science Foundation (No. 2020GXNSFAA297082), Guangxi Innovation Driven Development Project (No. AA18242036-2); National Natural Science Foundation of China (No. 52161033); Fund Project of the GDAS Special Project of Science and Technology Development, Guangdong Academy of Sciences Program (No. 2020GDASYL-20200104030), and the Fund Project of the Key Lab of Guangdong for Modern Surface Engineering Technology (No. 2018KFKT01).References
- Y.-S. Duh, X. Liu, X. Jiang, C.-S. Kao, L. Gong and R. Shi, J. Energy Storage, 2020, 30 Search PubMed.
- Y. Hua, X. Li, X. Zhang, L. Zhang, Y. Shu, H. Sheng, H. Fang, H. Wei and Y. Ding, ChemElectroChem, 2019, 6, 2570–2577 CrossRef CAS.
- H. Yang, X. Zhang, W. Zhu, F. Wang, Y. Li, Q. Fan, H. Xiao and F. Zhang, ChemElectroChem, 2019, 6, 1115–1121 CrossRef CAS.
- P. Zeng, H. Yu, M. Chen, W. Xiao, Y. Li, H. Liu, J. Luo, J. Peng, D. Shao, Z. Zhou, Z. Luo, Y. Wang, B. Chang and X. Wang, J. Energy Chem., 2020, 51, 21–29 CrossRef.
- A. Eftekhari, J. Power Sources, 2017, 343, 395–411 CrossRef CAS.
- M. Qi, X. Liang, F. Wang, M. Han, J. Yin and M. Chen, J. Alloys Compd., 2019, 799, 345–350 CrossRef CAS.
- Z.-Y. Wang, D.-D. Han, S. Liu, G.-R. Li, T.-Y. Yan and X.-P. Gao, Electrochim. Acta, 2020, 337 Search PubMed.
- H.-J. Kim, G.-H. Bae, S.-M. Lee, J.-H. Ahn and J.-K. Kim, Electrochim. Acta, 2019, 300, 18–25 CrossRef CAS.
- B. Nie, C. Zhou, M. Gao, D. He, Z. Yao, Y. Liu, X. Shen, X. Wang and H. Pan, J. Alloys Compd., 2019, 797, 1205–1215 CrossRef CAS.
- B. Zhao, Y. Jiang, J. Xie, X. Ling, Y. Ding, S. Huang, Z. Chen and Y. Jiang, J. Alloys Compd., 2019, 811 Search PubMed.
- X. Hong, Y. Liu, J. Fu, X. Wang, T. Zhang, S. Wang, F. Hou and J. Liang, Carbon, 2020, 170, 119–126 CrossRef CAS.
- J. Hou, X. Tu, X. Wu, M. Shen, X. Wang, C. Wang, C. Cao, H. Pang and G. Wang, Chem. Eng. J., 2020, 401 Search PubMed.
- M. Li, W. Feng and X. Wang, J. Alloys Compd., 2021, 853 Search PubMed.
- Z. X. Jintao Zhang and L. Dai, Sci. Adv., 2015, 1500564 CrossRef PubMed.
- X. Zhou, B. Liu, Y. Chen, L. Guo and G. Wei, Mater. Adv., 2020, 1, 2163–2181 RSC.
- J. Zhu, M. Metzger, M. Antonietti and T. P. Fellinger, ACS Appl. Mater. Interfaces, 2016, 8, 26041–26050 CrossRef CAS PubMed.
- S. Wang, D. Yu and L. Dai, J. Am. Chem. Soc., 2011, 133, 5182–5185 CrossRef CAS PubMed.
- D. Geng, N. Ding, T. S. A. Hor, Z. Liu, X. Sun and Y. Zong, J. Mater. Chem. A, 2015, 3, 1795–1810 RSC.
- L. Yang, S. Jiang, Y. Zhao, L. Zhu, S. Chen, X. Wang, Q. Wu, J. Ma, Y. Ma and Z. Hu, Angew. Chem., Int. Ed., 2011, 50, 7132–7135 CrossRef CAS PubMed.
- M. Zhang and L. Dai, Nano Energy, 2012, 1, 514–517 CrossRef CAS.
- N. Choudhary, S. Hwang and W. Choi, in Handbook of Nanomaterials Properties, 2014, ch. 37, pp. 709–769, DOI:10.1007/978-3-642-31107-9_37.
- L. Wang, C. Yang, S. Dou, S. Wang, J. Zhang, X. Gao, J. Ma and Y. Yu, Electrochim. Acta, 2016, 219, 592–603 CrossRef CAS.
- Y. Li, Ionics, 2022, 28, 1167–1172 CrossRef CAS.
- J. Huang and S. Dong, Ionics, 2022, 28, 2775–2779 CrossRef CAS.
- L.-N. Han, X. Wei, Q.-C. Zhu, S.-M. Xu, K.-X. Wang and J.-S. Chen, J. Mater. Chem. A, 2016, 4, 16698–16705 RSC.
- X. Yang, Z. Ran, F. Luo, Y. Li, P. Zhang and H. Mi, Appl. Surf. Sci., 2020, 509, 145270 CrossRef CAS.
- L. Gao, J. Yang, X. Lu, H. Ren, E. Sheng and J. Huang, J. Electroanal. Chem., 2020, 878 Search PubMed.
- D. Cheng, Y. Zhao, T. An, X. Wang, H. Zhou and T. Fan, Carbon, 2019, 154, 58–66 CrossRef CAS.
- Z.-L. Xu, J.-K. Kim and K. Kang, Nano Today, 2018, 19, 84–107 CrossRef CAS.
- T. Gao, Z. Yu, Z.-H. Huang and Y. Yang, ACS Appl. Energy Mater., 2018, 2, 777–787 CrossRef.
- X. Song, S. Wang, G. Chen, T. Gao, Y. Bao, L.-X. Ding and H. Wang, Chem. Eng. J., 2018, 333, 564–571 CrossRef CAS.
- S. Yao, R. Guo, F. Xie, Z. Wu, K. Gao, C. Zhang, X. Shen, T. Li and S. Qin, Electrochim. Acta, 2020, 337 Search PubMed.
- L. Sun, J. Xie, F. Cheng, R. Y. Chen, Q.-L. Zhu and J. Zhong, Chin. J. Inorg. Anal. Chem., 2022, 116 Search PubMed.
- R. Liu, F. Guo, X. Zhang, J. Yang, M. Li, W. Miaomiao, H. Liu, M. Feng and L. Zhang, ACS Appl. Energy Mater., 2019, 2, 1348–1356 CrossRef CAS.
- X. Zhang, C. Shang, E. M. Akinoglu, X. Wang and G. Zhou, Adv. Sci., 2020, 7, 2002037 CrossRef CAS PubMed.
- Y. He, S. Yao, M. Bi, H. Yu, A. Majeed and X. Shen, Electrochim. Acta, 2021, 394 Search PubMed.
- J. Liu, S. Xiao, X. Liu, R. Wu, X. Niu, Y. Xiang, J. S. Chen and C. Yang, Chem. Eng. J., 2021, 423 Search PubMed.
- S. Yao, Y. He, Y. Wang, M. Bi, Y. Liang, A. Majeed, Z. Yang and X. Shen, J. Colloid Interface Sci., 2021, 601, 209–219 CrossRef CAS PubMed.
- S.-s. Yao, Y.-p. He, M. Arslan, C.-j. Zhang, X.-q. Shen, T.-b. Li and S.-b. Qin, New Carbon Mater., 2021, 36, 606–615 CrossRef.
- T. Li, C. Ma, Y. Li, F. Tu, C. Jiao, Z. Li and S. Yao, Ionics, 2022, 28, 1701–1711 CrossRef CAS.
- R. Singhal, S.-H. Chung, A. Manthiram and V. Kalra, J. Mater. Chem. A, 2015, 3, 4530–4538 RSC.
- Y.-C. Ho and S.-H. Chung, Chem. Eng. J., 2021, 422 Search PubMed.
- S.-H. Moon, M.-C. Kim, J.-H. Choi, Y.-S. Kim, H. Kim and K.-W. Park, J. Alloys Compd., 2021, 857 Search PubMed.
- F. Sun, J. Wang, H. Chen, W. Li, W. Qiao, D. Long and L. Ling, ACS Appl. Mater. Interfaces, 2013, 5, 5630–5638 CrossRef CAS PubMed.
- S. Leng, C. Chen, J. Liu, S. Wang, J. Yang, S. Shan, F. Gong, Y. Guo and M. Wu, Appl. Surf. Sci., 2019, 487, 784–792 CrossRef CAS.
- A. Abdul Razzaq, Y. Yao, R. Shah, P. Qi, L. Miao, M. Chen, X. Zhao, Y. Peng and Z. Deng, Energy Storage Mater., 2019, 16, 194–202 CrossRef.
- P. Liang, L. Zhang, D. Wang, X. Man, H. Shu, L. Wang, H. Wan, X. Du and H. Wang, Appl. Surf. Sci., 2019, 489, 677–683 CrossRef CAS.
- L. Guo, J. Li, H. Wang, N. Zhao, C. Shi, L. Ma, C. He, F. He and E. Liu, Phys. Rev. Appl., 2018, 9, 024010 CrossRef CAS.
Footnote |
| † Electronic supplementary information (ESI) available. See https://doi.org/10.1039/d2ra03317h |
| This journal is © The Royal Society of Chemistry 2022 |

