 Open Access Article
Tailor-designed nanowire-structured iron and nickel oxides on platinum catalyst for formic acid electro-oxidation
Bilquis Ali Al-Qodamiab,
Hafsa H. Alalawy *a,
Sayed Youssef Sayed
 a,
Islam M. Al-Akraa
 c,
Nageh K. Allam
 d and
Ahmad M. Mohammad
 *a
*a
aChemistry Department, Faculty of Science, Cairo University, Cairo 12613, Egypt. E-mail: hafsa@sci.cu.edu.eg; ammohammad@cu.edu.eg
bChemistry Department, Faculty of Education and Applied Science, Hajjah University, Yemen
cDepartment of Chemical Engineering, Faculty of Engineering, The British University in Egypt, Cairo 11837, Egypt
dEnergy Materials Laboratory, School of Sciences and Engineering, The American University in Cairo, New Cairo 11835, Egypt
First published on 13th July 2022
Abstract
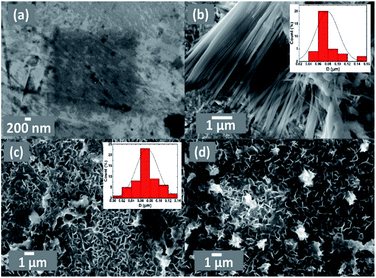
This investigation is concerned with designing efficient catalysts for direct formic acid fuel cells. A ternary catalyst containing iron (nano-FeOx) and nickel (nano-NiOx) nanowire oxides assembled sequentially onto a bare platinum (bare-Pt) substrate was recommended for the formic acid electro-oxidation reaction (FAOR). While nano-NiOx appeared as fibrillar nanowire bundles (ca. 82 nm and 4.2 μm average diameter and length, respectively), nano-FeOx was deposited as intersecting nanowires (ca. 74 nm and 400 nm average diameter and length, respectively). The electrocatalytic activity of the catalyst toward the FAOR depended on its composition and loading sequence. The FeOx/NiOx/Pt catalyst exhibited ca. 4.8 and 1.6 times increases in the catalytic activity and tolerance against CO poisoning, respectively, during the FAOR, relative to the bare-Pt catalyst. Interestingly, with a simple activation of the FeOx/NiOx/Pt catalyst at −0.5 V vs. Ag/AgCl/KCl (sat.) in 0.2 mol L−1 NaOH, a favorable Fe2+/Fe3+ transformation succeeded in mitigating the permanent CO poisoning of the Pt-based catalysts. Interestingly, this activated a-FeOx/NiOx/Pt catalyst had an activity 7 times higher than that of bare-Pt with an ca. −122 mV shift in the onset potential of the FAOR. The presence of nano-FeOx and nano-NiOx enriched the catalyst surface with extra oxygen moieties that counteracted the CO poisoning of the Pt substrate and electronically facilitated the kinetics of the FAOR, as revealed from CO stripping and impedance spectra.
1. Introduction
Society is currently confronted with a difficult task; replacing traditional fossil fuels with renewable resources. Direct liquid fuel cells (DLFCs) have sparked widespread interest in research and industry as a very promising technology for resolving the worldwide environmental and energy crises.1,2 Among the several studied fuel cells (FCs), direct formic acid fuel cells (DFAFCs) appear to be promising as alternative power sources for portable electronic applications and in transportation due to their high energy density (∼1.4 kWh kg−1), high theoretical open circuit potential (OCP ∼ 1.48 V), fast oxidation kinetics and cell efficiency.3,4 This is in addition to the utilization of a superior liquid fuel with high safety, low toxicity, low-flammability, ready availability, ambient temperature operability and low fuel crossover flux through Nafion membranes.5–9The most significant factors that influence the final output of DFAFCs are the electrocatalysts for both the anode and cathode electrodes, where Pt and Pd-based catalysts have been extensively studied due to their outstanding catalytic activity and long-term stability.7,10 Formic acid (FA) is one of the smallest organic molecules likely to be used, with only two electrons shared. Thus, it has been used as a model molecule in the study of the oxidation of other organic compounds with more intricate structures and oxidation mechanisms. Despite several efforts devoted to the research of the oxidation of these compounds, the overpotentials of the oxidation reaction are still far too high for large-scale practical application. Therefore, better electrocatalysts with lower overpotentials should be developed in order to optimize the fuel cell system’s overall energy efficiency.11 The reaction mechanism is an important piece of knowledge for the development of improved electrocatalysts. Knowing the intricacies of the reaction process will allow the development of new electrode materials able to speed up the reaction’s slowest steps, allowing the reaction bottlenecks to be overcome and higher efficiencies to be achieved.3,11 Because only two electrons are exchanged, the FA oxidation reaction (FAOR) is a comparatively simple reaction. In fact, only the cleavage of two bonds is needed for full oxidation to CO2: an O–H bond and an H–C bond. This second cleavage is possibly the most difficult stage, but pure metals (such as Pt, Pd and Ru) are active for this stage because of their excellent properties for hydrogen adsorption.11,12 However, when this reaction was examined on platinum, a poisoning species, such as CO, was found to form. The formation of CO means the existence of unexpected problems in the process of oxidation. Because adsorbed CO is oxidized at high potentials, it prevents the reaction from taking place on the metal surface. Therefore, the oxidation mechanism involves two parallel routes: the direct formation of CO2 from HCOOH at low potentials through a dehydrogenation step (desirable pathway) (HCOOH → CO2 + 2H+ + 2e−), and the indirect formation of CO via a chemical dehydration step, which will be further oxidized to CO2 at higher potentials (HCOOH → COads + H2O → CO2 + 2H+ + 2e−).13–19
Many catalysts have been reported for the FAOR in alkaline and acidic media. The noble metals are the most used electrocatalysts because of their superior activity. In fact, the FAOR on Pt and Pd electrodes has been the focus of growing interest since the 1960s.20 This is mostly owing to its importance in understanding methanol and formaldehyde oxidation, as well as the development of DFAFCs. However, difficult issues, such as limited catalytic activity on Pt at low potential, long-term instability (or deactivation) of Pd and Pt catalysts, degradation of carbon supports and the Nafion membrane, and water-CO2 management in fuel cell stacks, impede DFAFC commercialization on a wide scale. Significant efforts are being made to solve these issues through different approaches, such as developing new designs of DFAFCs and preparing high efficiency anode catalysts.20,21 Particularly, Pt is regarded as the most suitable electrocatalyst among all metals due to its excellent stability. However, CO poisoning via the dehydration pathway of the FAOR on the Pt surface degrades its catalytic activity, reducing its use. The combination of Pt-based intermetallic catalysts may improve the catalytic activity and durability for the FAOR.
In order to enhance the electrocatalytic activity, suppress poisoning by CO and increase the stability of the Pt catalyst toward the FAOR, several metals have been combined with Pt as intermetallic compounds, alloys, adatoms, or core–shell structures. The impact of other metals and/or metal oxides could be demonstrated by ensemble effects, electronic effects or a bi-functional mechanism. In this regard, Pt-based catalysts have made significant progress in direct oxidation activities by surface modification, shape engineering, and alloying with other metals such as Pd, Au, Cu, etc.6,20,22,23 Many other studies have been performed in order to use binary catalysts, such as PtM (M = Au,24,25 Bi,14 Co,26 Cu,27 Ni,28 Rh,29 Sn,30 Fe,31 Zr,32 Nb,33 etc.) and ternary catalysts such as PtM1M2 (M1M2 = RuAu,34 PdCu,35 CuFe,36 SnBi,6 AuCu![[thin space (1/6-em)]](https://www.rsc.org/images/entities/char_2009.gif) 37 and BiPd
37 and BiPd![[thin space (1/6-em)]](https://www.rsc.org/images/entities/char_2009.gif) 7). Furthermore, when modifying Pt surfaces with transition metal oxide nanostructures (MOx), such as NiOx,38,39 CoOx,40 TiOx,41 MnOx,42,43 Cu2O,44 FeOx,45,46 etc., the catalytic improvement achieved toward the FAOR was motivated by the so-called “bi-functional effect”, where the required oxygen atmosphere could easily be supplied by non-precious metal/s to facilitate the CO stripping at low overpotentials. Pt surface modification may also facilitate a change in the Pt work function in both circumstances (ensemble and bi-functional effects) to provide controlled tuning for Pt-FA and Pt–CO binding. In this study, the activity and stability of a new FeOx/NiOx/Pt catalyst for the FAOR was studied. The Pt surface was amended with peerless cheap and abundant metal oxides (FeOx and NiOx) that could effectively boost the kinetics of the FAOR and minimize the surface poisoning of Pt to allow DFAFCs to be scaled for practical use.
7). Furthermore, when modifying Pt surfaces with transition metal oxide nanostructures (MOx), such as NiOx,38,39 CoOx,40 TiOx,41 MnOx,42,43 Cu2O,44 FeOx,45,46 etc., the catalytic improvement achieved toward the FAOR was motivated by the so-called “bi-functional effect”, where the required oxygen atmosphere could easily be supplied by non-precious metal/s to facilitate the CO stripping at low overpotentials. Pt surface modification may also facilitate a change in the Pt work function in both circumstances (ensemble and bi-functional effects) to provide controlled tuning for Pt-FA and Pt–CO binding. In this study, the activity and stability of a new FeOx/NiOx/Pt catalyst for the FAOR was studied. The Pt surface was amended with peerless cheap and abundant metal oxides (FeOx and NiOx) that could effectively boost the kinetics of the FAOR and minimize the surface poisoning of Pt to allow DFAFCs to be scaled for practical use.
2. Experimental
2.1. Chemicals
All chemicals utilized in this work were of analytical grade and were used as received, with no prior purification. All solutions were prepared with double-distilled water. Nickel sulfate hexahydrate (NiSO4·6H2O), formic acid (HCOOH, FA), disodium hydrogen phosphate (Na2HPO4), hydrochloric acid (HCl), sodium hydroxide pellets (NaOH) and sulfuric acid (H2SO4) were purchased from Sigma-Aldrich, whereas iron(II) sulfate heptahydrate (FeSO4·7H2O) and sodium sulfate (Na2SO4) were purchased from Riedel-de Haën and Merck, respectively.2.2. Electrochemical measurements
Electrochemical tests, such as cyclic voltammetry (CV), chronoamperometry (CA), and electrochemical impedance spectroscopy (EIS), were performed in a constructed two-compartment three-electrode Pyrex glass cell. Polycrystalline platinum (d = 3.0 mm), platinum spiral wire and Ag/AgCl/KCl (sat.) served as the working, counter and reference electrodes, respectively. Even if not stated, all the potential readings in this study were taken in reference to the Ag/AgCl/KCl (sat.) electrode. All measurements were performed at room temperature (25 ± 1 °C) using an EG&G potentiostat (model 273) operated with E-Chem 270 software.2.3. Catalyst preparation
The polycrystalline bare “pristine” Pt (bare-Pt or poly-Pt) electrode was mechanically polished with aqueous slurries of successively finer alumina powder, and subsequently sonicated and washed with double-distilled water. Then, the poly-Pt electrode was further electrochemically cleaned in 0.5 mol L−1 H2SO4 solution by cycling the potential between −0.2 and 1.3 V at 100 mV s−1 until a characteristic CV for a clean poly-Pt electrode was obtained. The electrode modification with nickel oxide nanostructures (nano-NiOx) was achieved in three sequential steps. The first corresponded to the electrodeposition of metallic nickel (Ni) from 0.1 mol L−1 Na2SO4 solution containing 1.0 mmol L−1 NiSO4·6H2O at a constant potential of −1.0 V for 120 s.38,39 After that, the metallic nickel was passivated to nickel oxide by cycling the potential from −0.5 to 1 V at 200 mV s−1 in 0.1 mol L−1 phosphate buffer solution (PBS, pH 7, prepared from 0.1 mol L−1 Na2HPO4 and 0.1 mol L−1 HCl). Finally, the as-prepared electrode was activated by cycling the potential between −1 and 0.6 V at a scan rate of 200 mV s−1 for 25 cycles in 0.5 mol L−1 NaOH solution.Fig. 1 exhibits CVs of 10 potential cycles in PBS (pH 7) for the passivation of deposited metallic Ni on the bare-Pt electrode. For simplicity, only the first and tenth voltammograms are shown. A broad oxidative wave in the 1st CV corresponded to the active anodic dissolution and passivation of the electrodeposited metallic Ni synchronised between the various phases of nickel oxides. The following consecutive 9 CVs revealed a negligible anodic current, indicating a complete passivation of the surface layer of nickel during the first CV cycle. Interestingly, the absence of any significant reduction peaks in the cathode scan within the suitable potential domain indicated that the passive NiOx nanoparticles were stable within the potential range used and the specified pH. The electrodeposition of iron species was carried out by potential cycling (2 cycles) between −0.855 and −1.205 V at a scan rate of 100 mV s−1 in 0.02 mol L−1 FeSO4·7H2O solution. Next, the deposited iron was activated in 0.2 mol L−1 NaOH aqueous solution at −0.5 V for 10 min, where iron oxide nanorods (nano-FeOx) were formed.45,46 To easily recognize the sequencing of the different catalytic ingredients and the post-treatment of the catalyst, abbreviations related to their developments were assigned. For instance, the a-FeOx/NiOx/Pt catalyst referred to the direct deposition of nano-NiOx onto the bare-Pt substrate followed by its passivation and activation. Then, nano-FeOx was deposited later onto the NiOx/Pt catalyst. The prefix “a-” denoted the further activation of nano-FeOx as described previously.
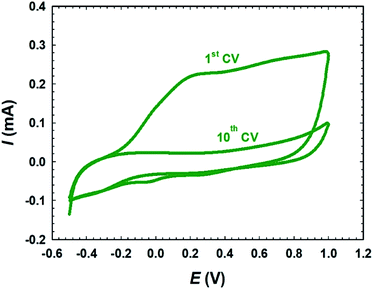 | ||
| Fig. 1 CVs of the passivation of the electrodeposited metallic Ni on the bare-Pt electrode in 0.1 mol L−1 PBS (pH 7.0). | ||
2.4. Materials characterization
The morphology and surface composition of the as-prepared Pt-based electrocatalysts were characterized by field-emission scanning electron microscopy (FE-SEM, Zeiss Ultra 60), at an acceleration voltage of 8 kV and a working distance of 2.8–3.2 mm, coupled with an energy dispersive X-ray spectrometer (EDX).3. Results and discussion
3.1. Electrochemical and materials characterization
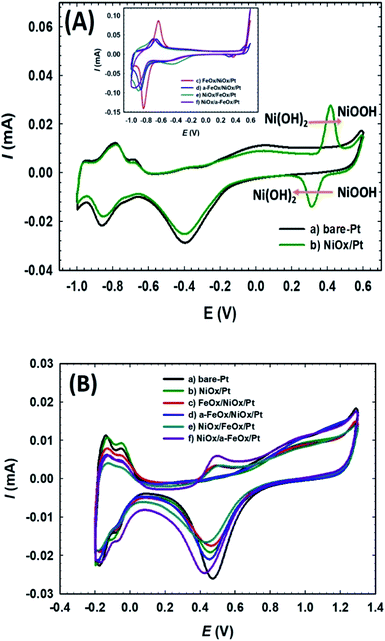
The electrochemical characterization was first used to detect the nature of the electroactive species on the various modified Pt electrodes. Fig. 2A compares CVs of the unmodified (a) bare-Pt and modified (b–f) NiOx/Pt, FeOx/NiOx/Pt, a-FeOx/NiOx/Pt, NiOx/FeOx/Pt and NiOx/a-FeOx/Pt catalysts, respectively, in 0.5 mol L−1 NaOH solution. As can be clearly seen, the CV of the Pt electrode (curve a) exhibited typical characteristics of a clean poly-Pt electrode, with two peaks for the Hads/des in the potential range from −1.0 to −0.65 V, together with another peak couple for the PtO/Pt transformation at −0.40 V. After modifying the Pt electrode with nano-NiOx, well-defined redox peaks at 0.32 and 0.42 V, corresponding to the Ni(II)/Ni(III) reversible transformation, were seen.38,39,47,48 In addition, a significant decrease was observed in the Pt surface area, which can easily be estimated from the lower peak intensities of the PtO reduction, Pt oxidation and Hads/des peaks (curve b). A further modification with nano-FeOx resulted in the emergence of the distinctive well-defined redox peaks for Fe2+ ↔ Fe3+ at ca. −0.63 V (anodic scan) and −0.83 V (cathodic scan), curve c.49 Interestingly, the existence of nano-FeOx in the catalyst, regardless of its deposition order, led to a significant boosting of the oxygen evolution reaction (OER), as seen at ca. 0.55 V. The presence of the OER peak was clearly caused by the existence of the nano-FeOx and nano-NiOx together in the catalyst, but it did not appear in the case of either the NiOx/Pt (curve b) or Pt (curve a) electrodes at, or before, ca. 0.55 V. The redox peak for the Fe2+/Fe3+ transformation was observed with the a-FeOx/NiOx/Pt (−0.5 V) catalyst, with small negative shifts in the potential (−0.66 to −0.87 V, curve d). The same behaviour was retained with the NiOx/FeOx/Pt (curve e) and NiOx/a-FeOx/Pt (curve f) catalysts, but the Fe2+/Fe3+ peaks were shifted to higher negative potentials.Fig. 2B shows the CVs for the same catalysts recorded in 0.5 mol L−1 H2SO4 aqueous solution. The Hads/des peaks, together with those of Pt → PtO oxidation and PtO → Pt reduction, were clearly seen for all catalysts. The polycrystalline nature of Pt was verified from the splitting of the Hads/des peaks. The deposition of nano-NiOx and/or nano-FeOx on the Pt electrode reduced the exposed surface of the Pt, as inferred from the intensities of the Hads/des and PtO/Pt peaks. The addition of nano-FeOx to the NiOx/Pt electrode resulted in the appearance of a well-defined redox peak couple in the region of 0.4 to 0.6 V, which might be attributed to Fe2+/Fe3+ conversions.50 This peak couple was almost absent for NiOx/Pt and a-FeOx/NiOx/Pt, but appeared for other catalysts. The absence of this peak in the case of a-FeOx/NiOx/Pt might be attributed to the detachment or phase transformation of FeOx on the Pt surface. After adding the modifiers (nano-NiOx and/or nano-FeOx) to Pt, the PtO/Pt peak shifted in the negative direction, especially in the case of the deposition of nano-FeOx underneath nano-NiOx (NiOx/FeOx/Pt and NiOx/a-FeOx/Pt electrodes), with an obvious overlapping of the PtO/Pt and Fe3+/Fe2+ reduction peaks. The Hads/des peaks with a monolayer adsorption charge of Hads/des of 210 μC cm−2 at the Pt surfaces was, for accuracy purposes, used to compute the specific surface area of the catalyst,51 instead of the PtO → Pt peak, which might be overlapping with other reduction peaks of iron oxides.
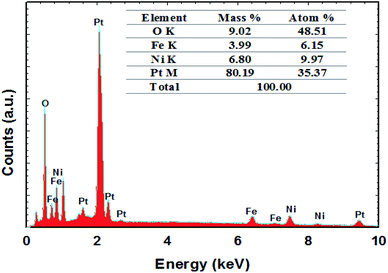
FE-SEM imaging revealed the morphological characterization of the modified Pt electrodes. Fig. 3 shows typical FE-SEM micrographs of Pt before (a) and after (b, c and d) modification. The image of the NiOx/Pt (Fig. 3b) electrode showed that nano-NiOx was electrodeposited on the Pt surface in fibrillar nanowire bundles, with an average diameter of ca. 82 nm and length of 4.2 μm. However, the nano-FeOx was electrodeposited on the NiOx/Pt electrode in intersected nanowires, with an average diameter of ca. 74 nm and length of 400 nm (Fig. 3c). Interestingly, the activation led to the emergence of many aggregates of nanowires (Fig. 3d). The elemental composition of the FeOx/NiOx/Pt electrode was identified by the EDX measurement, as shown in Fig. 4. It reflected that the catalyst contained Ni, Fe, O and Pt, with percentages of 9.97, 6.15, 48.51 and 35.37%, respectively. The presence of O at such a high level was probably due to oxide formation, whereas the high extent of Pt resulted from the bare-Pt substrate. This indicated the successful deposition of the catalyst’s ingredients.
3.2. Electrocatalysis of the FAOR
The electrocatalytic performance of the modified electrodes toward the FAOR was investigated by recording CVs in 0.3 mol L−1 FA (pH 3.5) at a scan rate of 200 mV s−1 in the potential range from −0.2 to 1.0 V, (Fig. 5). It is worth mentioning that the stability of iron and nickel oxides decreases in highly acidic solutions.39,52 Therefore, the present study was conducted in a slightly acidic medium, pH = 3.5, located within the iron and nickel oxides’ stability domains. Additionally, a large (about one-third) amount of FA is ionized at this pH to formate anions.44 As such, the ionic conductivity is expected to be improved, along with a lower solution resistance.38,39 In general, there are two mechanisms suggested for the FAOR, as follows:(1) Direct pathway mechanism:
| HCOOH → H(aq)+ + e− + HCOO* | (1) |
| HCOO* → CO2 + H(aq)+ + e− | (2) |
(2) Indirect pathway mechanism:
| HCOOH → H(aq)+ + e− + COOH* | (3) |
| COOH* → CO* + OH* | (4) |
| CO* + OH* → CO2 + H+ + e− | (5) |
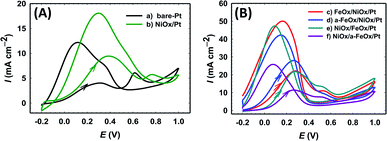 | ||
| Fig. 5 CVs of the FAOR for the (a) bare-Pt, (b) NiOx/Pt, (c) FeOx/NiOx/Pt, (d) a-FeOx/NiOx/Pt, (e) NiOx/FeOx/Pt and (f) NiOx/a-FeOx/Pt electrodes in 0.3 mol L−1 FA (pH 3.5). | ||
The direct pathway mechanism is dominant at low applied potentials (<0.25 V), resulting in CO2 formation after two steps of proton/electron transfer, through an HCOO* intermediate (eqn (1) and (2)). The indirect mechanism of the FAOR, prevalent at high applied potentials (>0.6 V), contributes to CO formation through a different intermediate, COOH* (eqn (3) and (4)), and its subsequent oxidation to CO2 (eqn (5)).53 The first (direct pathway) and second (indirect pathway) peak currents are symbolized as Idp and Iindp in the forward (positive-going) potential scan, respectively. In the backward scan, the FAOR continues on a clean Pt surface along with Pt dehydroxylation and perhaps CO2 reduction, but generally the peak current (Ib) is overall anodic. The increase in the intensity of Idp concurrent with the decrease of Iindp indicates that the direct FAOR pathway becomes more favorable. Hence, the ratio of the two oxidation peaks (Idp/Iindp) represents how favorable it is for the FAOR to occur via the direct pathway (or the improvement in the overall catalytic efficiency of the FAOR) for a particular catalyst. Fig. 5 shows the CVs depicting and comparing the specific activities for the bare-Pt, NiOx/Pt, FeOx/NiOx/Pt, a-FeOx/NiOx/Pt, NiOx/FeOx/Pt and NiOx/a-FeOx/Pt catalysts. The Idp of the catalysts followed this order: a-FeOx/NiOx/Pt (28.0 mA cm−2) > FeOx/NiOx/Pt (22.0 mA cm−2) > NiOx/FeOx/Pt (21.8 mA cm−2) > NiOx/a-FeOx/Pt (11.5 mA cm−2) > NiOx/Pt (9.0 mA cm−2) > Pt (4.5 mA cm−2). Also, the catalytic activity (assessed using the Idp/Iindp ratio) of the catalysts followed this order: a-FeOx/NiOx/Pt (16.5, which is seven fold higher than that of bare-Pt) > FeOx/NiOx/Pt (11.0) > NiOx/a-FeOx/Pt (9.6) > NiOx/FeOx/Pt (9.5) > NiOx/Pt (7.5) > bare-Pt (2.3). The a-FeOx/NiOx/Pt and FeOx/NiOx/Pt catalysts had superior catalytic activities; outperforming all the other catalysts. The introduction of nano-NiOx and nano-FeOx could greatly improve the usage of Pt at the unit area level.
In fact, Fig. 5 indicates that the FAOR on the NiOx/Pt catalyst (curve b) showed an improved activity (compare Idp) relative to that of the bare Pt catalyst. Furthermore, the catalytic activities of the FeOx/NiOx/Pt and FeOx/Pt catalysts toward the FAOR were much better than those of the NiOx/Pt and bare-Pt catalysts, respectively. That is, Idp for the FAOR on the a-FeOx/NiOx/Pt catalyst reached ca. 3.1 and 6.2 times higher than that obtained on the NiOx/Pt and bare-Pt catalysts, respectively, and the ratio (Idp/Iindp) of the FAOR increased from 2.3 (on bare-Pt) to 7.5 (on NiOx/Pt) to 11.0 (on FeOx/NiOx/Pt) and 16.5 (on a-FeOx/NiOx/Pt). The a-FeOx/NiOx/Pt and FeOx/NiOx/Pt catalysts exhibited greater FAOR current densities and lower onset potentials; indicating that nano-FeOx boosted the catalytic activity toward the direct FAOR. We believe that nano-NiOx and nano-FeOx could enhance the FAOR reaction via a bi-functional mechanism, in which the presence of nano-NiOx and/or nano-FeOx enriched the catalyst’s surface with extra oxygen moieties that facilitated the FAOR. Also, the EIS tests and CO stripping experiments (more details are provided below) further revealed that nano-FeOx enhanced the FAOR via an electronic effect, allowing a faster electron transport. Obviously, when the deposition order of the modifiers was reversed (i.e., for the NiOx/FeOx/Pt catalyst), Idp (21.8 mA cm−2), Idp/Iindp (9.5) and Idp/Ib (0.51) increased compared to those of the NiOx/Pt and bare-Pt electrodes. Yet, the catalytic enhancement (Idp/Iindp = 9.5) of the former catalyst was still lower than that obtained with the FeOx/NiOx/Pt catalyst (Idp/Iindp = 11.0), despite their Idp and CO tolerance being nearly the same. The data for the FAOR is summarized in Table 1. It is also interesting to note the competitive performance of the FeOx/NiOx/Pt catalyst, especially after activation, for the FAOR and CO tolerance when compared to the literature data for this reaction (see Table 2).41,46,56–60
| Electrode | Idp (mA cm−2) | Iindp (mA cm−2) | Ib (mA cm−2) | Idp/Iindp | Idp/Ib | Eonset (mV) |
|---|---|---|---|---|---|---|
| Bare-Pt | 4.5 | 2.0 | 14.5 | 2.3 | 0.31 | −74 |
| NiOx/Pt | 9.0 | 1.2 | 14.0 | 7.5 | 0.64 | −174 |
| FeOx/NiOx/Pt | 22.0 | 2.0 | 45.0 | 11.0 | 0.49 | −186 |
| a-FeOx/NiOx/Pt | 28.0 | 1.7 | 38.2 | 16.5 | 0.73 | −196 |
| NiOx/FeOx/Pt | 21.8 | 2.3 | 42.5 | 9.5 | 0.51 | −82 |
| NiOx/a-FeOx/Pt | 11.5 | 1.2 | 23.0 | 9.6 | 0.50 | −80 |
| Electrode | Idp/Iindp | Idp/Ib | Ref. |
|---|---|---|---|
| Commercial Pt/C | 0.16 | — | 54 |
| Pt11.1Ni88.9/C | 0.33 | — | 54 |
| Pt10.9Au0.2Ni88.9/C | 0.34 | — | 54 |
| Pt black | 0.24 | 0.11 | 55 |
| Pt/C | 0.29 | 0.20 | 55 |
| PtPd/C | 0.87 | 0.51 | 55 |
| Pt/GC | 0.60 | 0.19 | 56 |
| Pt/MWCNTs-GC | 7.5 | 0.45 | 56 |
| NiOx/Pt/GC | 3.33 | 0.40 | 57 |
| Au/Pt/GC | 3.44 | 0.54 | 58 |
| Si-TiOx/Pt/TiOx (700 °C) | 10.0 | 0.67 | 41 |
| FeOx/Pt | 9.1 | 0.58 | 45 |
| a-FeOx/Pt | 17.4 | 0.70 | 45 |
| FeOx/NiOx/Pt | 11.0 | 0.49 | This work |
| a-FeOx/NiOx/Pt | 16.5 | 0.73 | This work |
3.3. Durability of the catalysts
The durability of the investigated catalysts toward the FAOR was tested by measuring current–time (I–t) relations of the FAOR at 0.3 V (Fig. 6). The initial rapid decrease in current demonstrated the poisoning of the electrocatalysts. The current densities of all Pt-modified catalysts were higher than that of the unmodified Pt electrode over continuous electrolysis for 3 h. For all catalysts, the sharp decrease in the current intensity ended with a steady-state current density. The a-FeOx/NiOx/Pt/GC catalyst current density remained nearly constant at ca. 4.0 mA cm−2 after 3 h of continuous electrolysis, which was nearly fourfold higher than that (1.0 mA cm−2) of the bare-Pt electrode. Among all catalysts, the a-FeOx/NiOx/Pt catalyst maintained the highest current density over the time studied. This suggested that nano-FeOx enhanced the stability and poisoning tolerance of the Pt catalyst.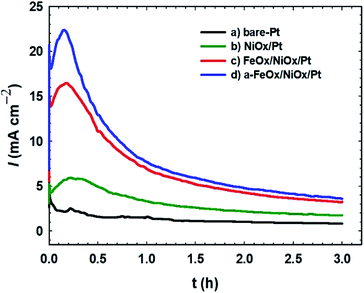 | ||
| Fig. 6 Current–time transients obtained during the FAOR for the (a) bare-Pt, (b) NiOx/Pt, (c) FeOx/NiOx/Pt and (d) a-FeOx/NiOx/Pt catalysts in 0.3 mol L−1 FA (pH 3.5) at a potential of 0.3 V. | ||
3.4. Electrochemical impedance spectroscopy (EIS)
The influence of additional modifiers (such as nano-NiOx and/or nano-FeOx) on the charge transport kinetics and the interfacial properties was further investigated using EIS, which is a valuable tool for addressing the results of the FAOR. The charge transfer resistance (Rct) of the prepared electrodes could be used to interpret the charge transfer kinetics of the FAOR. Table 3 compares the different EIS parameters: ohmic resistance (Rs), charge transfer resistance (Rct), constant phase element (CPE) and constant phase coefficient (n) of the various catalysts. The impedance parameters were estimated by fitting the measured EIS data using a Randles equivalent circuit model (inset of Fig. 7). In 0.3 mol L−1 FA (pH 3.5), Nyquist and Bode plots were obtained at open circuit potential in the frequency range from 10 mHz to 100 kHz for the bare-Pt, NiOx/Pt, FeOx/NiOx/Pt and a-FeOx/NiOx/Pt nanocatalysts (see Fig. 7). Interestingly, the diameter of the semicircle for the a-FeOx/NiOx/Pt electrode was smaller than those obtained for the other prepared catalysts in this investigation. The Rct decreased for these catalysts in the following order: bare-Pt (78.1 kΩ) > NiOx/Pt (ca. 37.0 kΩ) > FeOx/NiOx/Pt (25.8 kΩ) > a-FeOx/NiOx/Pt (15.2 kΩ). This low Rct for the FAOR on the a-FeOx/NiOx/Pt catalyst was definitely an important element in boosting the reaction kinetics. The different CPE values correlated to the different numbers of active sites at the catalysts’ surface; an increase in CPE is directly proportional to an increase in the active sites at the catalyst’s surface and, in turn, its activity.59 Alternatively, when n = 1, the CPE can be considered as an ideal capacitor.60 As expected, all catalysts exhibited a non-ideal behaviour for the double layer, perhaps due to a microscopic inhomogeneity at the electrode surface. It is clear that the a-FeOx/NiOx/Pt catalyst possessed the highest CPE and catalytic activity values.| Electrode | Rs [kΩ] | Rct [kΩ] | CPE [μFs(n−1)] | n |
|---|---|---|---|---|
| Bare-Pt | 0.354 | 78.10 | 1.189 | 0.9323 |
| NiOx/Pt | 0.319 | 36.97 | 5.177 | 0.7632 |
| FeOx/NiOx/Pt | 0.975 | 25.80 | 3.461 | 0.8207 |
| a-FeOx/NiOx/Pt | 0.238 | 15.20 | 15.880 | 0.8351 |
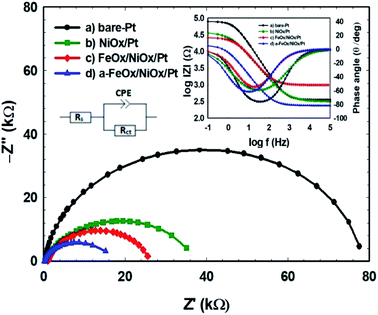 | ||
| Fig. 7 Nyquist and Bode plots of the FAOR for the (a) bare-Pt, (b) NiOx/Pt, (c) FeOx/NiOx/Pt and (d) a-FeOx/NiOx/Pt catalysts in 0.3 mol L−1 aqueous FA (pH 3.5) at open circuit potential. | ||
3.5. CO stripping
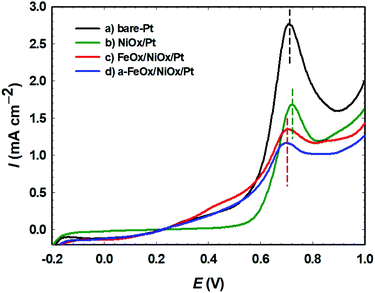
The capability for oxidation of the adsorbed CO with regard to the surface composition of the prepared catalysts was demonstrated using CO stripping analysis (Fig. 8). The desired voltage to drive the maximum COads oxidation kinetics was represented by the positions of the COads oxidation peaks in a CO stripping curve.61 In 0.5 mol L−1 FA, CO was permitted to adsorb on the surfaces of the bare-Pt, NiOx/Pt, FeOx/NiOx/Pt and a-FeOx/NiOx/Pt electrodes for 10 min at open circuit potential. The adsorbed CO layer was next stripped electrochemically (oxidatively) in 0.5 mol L−1 H2SO4 at a potential scan rate of 50 mV s−1, yielding the oxidation peaks displayed in Fig. 8. A sharp peak was detected for the bare-Pt electrode at 0.71 V, with a peak current density of 2.8 mA cm−2. Compared with that of the bare-Pt electrode, the CO stripping voltammogram of the NiOx/Pt electrode presented a CO stripping peak at almost the same potential (0.71 V), but with a different amount of CO and peak current intensity (1.7 mA cm−2). On the other hand, the FeOx/NiOx/Pt and a-FeOx/NiOx/Pt electrodes showed much lower peak intensities of 1.4 and 1.2 mA cm−2 at ∼ 0.70 and ∼ 0.69 V, respectively. This suggested higher CO tolerance of the FeOx/NiOx/Pt and a-FeOx/NiOx/Pt catalysts that was inferred, not only from the lower amounts of adsorbed CO molecules, but also from the slightly negative shift in their peak potentials. This means that nano-FeOx participated in the catalysis of the FAOR via both the bi-functional and electronic effects.4. Conclusion
A propitious ternary FeOx/NiOx/Pt catalyst was synthesized for efficient formic acid electro-oxidation. Compared with the bare-Pt electrode, the FeOx/NiOx/Pt catalyst demonstrated a better catalytic activity and tolerance against CO poisoning of ∼4.8 and 1.6 times, respectively. Activation of this catalyst at −0.5 V in 0.2 mol L−1 NaOH led to improvements in the catalytic activity (∼7.2 times) and CO tolerance (∼2.4 times) compared to the bare-Pt catalyst. Also, the existence of nano-FeOx enhanced the durability and Eonset of the catalyst for the FAOR. The role of nano-FeOx in the catalytic enhancement was interpreted by EIS and CO stripping analyses to be electronic. It also exhibited a bi-functional effect via enriching the catalyst surface with extra oxygen moieties that facilitated the FAOR, especially after activation.Conflicts of interest
There are no conflicts to declare.References
- H. Xu, K. Zhang, B. Yan, J. Wang, C. Wang, S. Li, Z. Gu, Y. Du and P. Yang, J. Power Sources, 2017, 356, 27–35 CrossRef CAS.
- S. Li, J. Lai, R. Luque and G. Xu, Energy Environ. Sci., 2016, 9, 3097–3102 RSC.
- D. Minudri, A. Y. Tesio, F. Fungo, R. E. Palacios, P. S. Cappellari, E. Pastor and G. A. Planes, J. Power Sources, 2021, 483, 229189 CrossRef CAS.
- I. M. Al-Akraa, B. A. Al-Qodami and A. M. Mohammad, Int. J. Electrochem. Sci., 2020, 15, 4005–4014 CrossRef CAS.
- H. Lee, Y. Sohn and C. K. Rhee, Langmuir, 2020, 36, 5359–5368 CrossRef CAS PubMed.
- S. Luo, W. Chen, Y. Cheng, X. Song, Q. Wu, L. Li, X. Wu, T. Wu, M. Li and Q. Yang, Adv. Mater., 2019, 31, 1903683 CrossRef CAS PubMed.
- L. Sui, W. An, C. K. Rhee and S. H. Hur, J. Electrochem. Sci. Technol., 2020, 11, 84–91 CrossRef CAS.
- Z. Liu, G. Fu, J. Li, Z. Liu, L. Xu, D. Sun and Y. Tang, Nano Res., 2018, 11, 4686–4696 CrossRef CAS.
- D. Bhalothia, T.-H. Huang, P.-H. Chou, K.-W. Wang and T.-Y. Chen, RSC Adv., 2020, 10, 17302–17310 RSC.
- P. Hong, F. Luo, S. Liao and J. Zeng, Int. J. Hydrogen Energy, 2011, 36, 8518–8524 CrossRef CAS.
- E. Herrero and J. M. Feliu, Curr. Opin. Electrochem., 2018, 9, 145–150 CrossRef CAS.
- J. M. Hermann, A. Abdelrahman, T. Jacob and L. A. Kibler, Electrochim. Acta, 2021, 385, 138279 CrossRef CAS.
- X. Jiang, Y. Liu, J. Wang, Y. Wang, Y. Xiong, Q. Liu, N. Li, J. Zhou, G. Fu and D. Sun, Nano Res., 2019, 12, 323–329 CrossRef CAS.
- M. Choi, C.-Y. Ahn, H. Lee, J. K. Kim, S.-H. Oh, W. Hwang, S. Yang, J. Kim, O.-H. Kim, I. Choi, Y.-E. Sung, Y.-H. Cho, C. K. Rhee and W. Shin, Appl. Catal., B, 2019, 253, 187–195 CrossRef CAS.
- G. H. El-Nowihy and M. S. El-Deab, Int. J. Hydrogen Energy, 2020, 45, 21297–21307 CrossRef CAS.
- P. S. Cappellari, A. M. Baena-Moncada, R. Coneo-Rodríguez, M. S. Moreno, C. A. Barbero and G. A. Planes, Int. J. Hydrogen Energy, 2019, 44, 1967–1972 CrossRef CAS.
- Y. M. Asal, A. M. Mohammad, S. S. Abd El Rehim and I. M. Al-Akraa, J. Saudi Chem. Soc., 2022, 26, 101437 CrossRef CAS.
- L. Zhang, J. V. Perales-Rondón, A. Thomère, J. Blanchard and C. M. Sánchez-Sánchez, J. Electroanal. Chem., 2021, 896, 115491 CrossRef CAS.
- T. Al Najjar, N. Ahmed and E. N. El Sawy, RSC Adv., 2021, 11, 22842–22848 RSC.
- K. Jiang, H.-X. Zhang, S. Zou and W.-B. Cai, Phys. Chem. Chem. Phys., 2014, 16, 20360–20376 RSC.
- I. M. Al-Akraa, B. A. Al-Qodami, M. S. Santosh, R. Viswanatha, A. K. Thottoli and A. M. Mohammad, Int. J. Electrochem. Sci., 2020, 15, 5597–5608 CrossRef CAS.
- S. Luo and P. K. Shen, ACS Nano, 2017, 11, 11946–11953 CrossRef CAS PubMed.
- I. M. Al-Akraa, Y. M. Asal and A. M. Mohammad, Arabian J. Chem., 2022, 15, 103965 CrossRef.
- Y. M. Asal, I. M. Al-Akraa, A. M. Mohammad and M. S. El-Deab, Int. J. Hydrogen Energy, 2019, 44, 3615–3624 CrossRef CAS.
- I. M. Al-Akraa, A. M. Mohammad, M. S. El-Deab and B. E. El-Anadouli, Int. J. Electrochem. Sci., 2012, 7, 3939–3946 CAS.
- C. Zhai, H. Zhang, J. Hu, L. Zeng, M. Xue, Y. Du and M. Zhu, J. Alloys Compd., 2019, 774, 274–281 CrossRef CAS.
- Y. Huang, T. Zhao, L. Zeng, P. Tan and J. Xu, Electrochim. Acta, 2016, 190, 956–963 CrossRef CAS.
- B. Habibi and N. Delnavaz, Int. J. Hydrogen Energy, 2011, 36, 9581–9590 CrossRef CAS.
- E. N. El Sawy and P. G. Pickup, Electrochim. Acta, 2019, 302, 234–240 CrossRef CAS.
- Q. Yi, J. Zhang, A. Chen, X. Liu, G. Xu and Z. Zhou, J. Appl. Electrochem., 2008, 38, 695–701 CrossRef CAS.
- W. Chen, J. Kim, S. Sun and S. Chen, Langmuir, 2007, 23, 11303–11310 CrossRef CAS PubMed.
- G. V. Ramesh, R. Kodiyath, T. Tanabe, M. Manikandan, T. Fujita, N. Umezawa, S. Ueda, S. Ishihara, K. Ariga and H. Abe, ACS Appl. Mater. Interfaces, 2014, 6, 16124–16130 CrossRef CAS PubMed.
- G. V. Ramesh, R. Kodiyath, T. Tanabe, M. Manikandan, T. Fujita, F. Matsumoto, S. Ishihara, S. Ueda, Y. Yamashita and K. Ariga, ChemElectroChem, 2014, 1, 728–732 CrossRef CAS.
- X. Hu, J. Zou, H. Gao and X. Kang, J. Colloid Interface Sci., 2020, 570, 72–79 CrossRef CAS PubMed.
- Y. Chen, H.-J. Niu, Y.-G. Feng, J.-H. Wu, A.-J. Wang, H. Huang and J.-J. Feng, Appl. Surf. Sci., 2020, 510, 145480 CrossRef CAS.
- Y.-X. Wang, C.-F. Liu, M.-L. Yang, X.-H. Zhao, Z.-X. Xue and Y.-Z. Xia, Chin. Chem. Lett., 2017, 28, 60–64 CrossRef CAS.
- Y. Xie and N. Dimitrov, Appl. Catal., B, 2020, 263, 118366 CrossRef CAS.
- G. A. El-Nagar, A. M. Mohammad, M. S. El-Deab and B. E. El-Anadouli, J. Electrochem. Soc., 2012, 159, F249 CrossRef CAS.
- G. A. El-Nagar, A. M. Mohammad, M. S. El-Deab and B. E. El-Anadouli, Electrochim. Acta, 2013, 94, 62–71 CrossRef CAS.
- G. A. El-Nagar, A. M. Mohammad, M. S. El-Deab and B. E. El-Anadouli, in Progress in Clean Energy, Springer, 2015, vol. 1, pp. 577–594 Search PubMed.
- I. M. Al-Akraa and A. M. Mohammad, Arabian J. Chem., 2020, 13, 4703–4711 CrossRef CAS.
- A. M. Mohammad, I. M. Al-Akraa and M. S. El-Deab, Int. J. Hydrogen Energy, 2018, 43, 139–149 CrossRef CAS.
- Y. M. Asal, I. M. Al-Akraa, A. M. Mohammad and M. S. El-Deab, J. Taiwan Inst. Chem. Eng., 2019, 96, 169–175 CrossRef CAS.
- G. A. El-Nagar, A. M. Mohammad, M. S. El-Deab and B. E. El-Anadouli, ACS Appl. Mater. Interfaces, 2017, 9, 19766–19772 CrossRef CAS PubMed.
- B. A. Al-Qodami, H. H. Farrag, S. Y. Sayed, N. K. Allam, B. E. El-Anadouli and A. M. Mohammad, J. Nanotechnol., 2018, 2018, 4657040 Search PubMed.
- B. A. Al-Qodami, H. H. Alalawy, I. M. Al-Akraa, S. Y. Sayed, N. K. Allam and A. M. Mohammad, Int. J. Hydrogen Energy, 2022, 47, 264–275 CrossRef CAS.
- G. A. El-Nagar and A. M. Mohammad, Int. J. Hydrogen Energy, 2014, 39, 11955–11962 CrossRef CAS.
- L. Chen, L. Liu, Q. Guo, Z. Wang, G. Liu, S. Chen and H. Hou, RSC Adv., 2017, 7, 19345–19352 RSC.
- M. Nagasaka, H. Yuzawa, T. Horigome, A. P. Hitchcock and N. Kosugi, J. Phys. Chem. C, 2013, 117, 16343–16348 CrossRef CAS.
- Y.-X. Chen, S.-P. Chen, Q.-S. Chen, Z.-Y. Zhou and S.-G. Sun, Electrochim. Acta, 2008, 53, 6938–6943 CrossRef CAS.
- M. G. Kim, J. H. Paik and Y. Tak, J. Nanosci. Nanotechnol., 2016, 16, 10639–10643 CrossRef CAS.
- A. Godymchuk, I. Papina, E. Karepina, D. Kuznetsov, I. Lapin and V. Svetlichnyi, J. Nanopart. Res., 2019, 21, 208 CrossRef.
- A. O. Elnabawy, J. A. Herron, J. Scaranto and M. Mavrikakis, J. Electrochem. Soc., 2018, 165, J3109 CrossRef CAS.
- A. Pei, L. Ruan, B. Liu, W. Chen, S. Lin, B. Chen, Y. Liu, L. H. Zhu and B. H. Chen, Int. J. Hydrogen Energy, 2020, 45, 22893–22905 CrossRef CAS.
- M. S. Çögenli and A. B. Yurtcan, Int. J. Hydrogen Energy, 2018, 43, 10698–10709 CrossRef.
- I. M. Al-Akraa, Y. M. Asal and S. A. Darwish, A Simple and Effective Way to Overcome Carbon Monoxide Poisoning of Platinum Surfaces in Direct Formic Acid Fuel Cells, Int. J. Electrochem. Sci., 2019, 14, 8267–8275 CrossRef CAS.
- I. M. Al-Akraa, A. E. Salama, Y. M. Asal and A. M. Mohammad, Arabian J. Chem., 2021, 14, 103383 CrossRef CAS.
- I. M. Al-Akraa, Y. M. Asal and A. M. Mohammad, J. Nanomater., 2019, 2019, 2784708 Search PubMed.
- R. K. Shervedani and M. Bagherzadeh, Electrochim. Acta, 2008, 53, 6293–6303 CrossRef CAS.
- W. Chen, J. Kim, S. Sun and S. Chen, Phys. Chem. Chem. Phys., 2006, 8, 2779–2786 RSC.
- D. Bhalothia, T.-H. Huang, P.-H. Chou, P.-C. Chen, K.-W. Wang and T.-Y. Chen, Sci. Rep., 2020, 10, 8457 CrossRef CAS PubMed.
| This journal is © The Royal Society of Chemistry 2022 |

