 Open Access Article
Photodegradation of 2,4-D (dichlorophenoxyacetic acid) with Rh/TiO2; comparative study with other noble metals (Ru, Pt, and Au)
G. A. Reguero-Márqueza,
M. A. Lunagómez-Rochaa,
A. Cervantes-Uribea,
G. del Angelb,
I. Rangelb,
J. G. Torres-Torresa,
F. Gonzálezb,
S. Godavarthic,
J. C. Arevalo-Pereza,
A. E. Espinosa de los Monterosa and
A. A. Silahua-Pavon*a
aUniversidad Juárez Autónoma de Tabasco, Laboratorio de Nanomateriales Catalíticos Aplicados al Desarrollo de Fuentes de Energía y de Remediación Ambiental, Centro de Investigación de Ciencia y Tecnología Aplicada de Tabasco (CICTAT), DACB, Km. 1 Carretera Cunduacán-Jalpa de Méndez AP. 24, C. P. 86690, Cunduacán, Tabasco, Mexico. E-mail: adib.silahua@ujat.mx; adibab45@gmail.com
bUniversidad Autónoma Metropolitana-Iztapalapa, Departamento de Química, Área de Catálisis, CBI, Av. San Rafael Atlixco No. 186, CP 09340, México DF, Mexico
cInvestigadoras e Investigadores por México-Universidad Juárez Autónoma de Tabasco, Centro de Investigación de Ciencia y Tecnología Aplicada de Tabasco (CICTAT), DACB, Laboratorio de Nanomateriales Catalíticos Aplicados al Desarrollo de Fuentes de Energía y Remediación Ambiental, Km.1 carretera Cunduacán-Jalpa de Méndez, C. P. 86690 Cunduacán, Tabasco, Mexico
First published on 9th September 2022
Abstract
In this work the effect of noble metal on the photodegradation of 2,4-dichlorophenoxyacetic acid herbicide using TiO2 as support was studied. The metals and concentration were: Rh, Ru, Pt and Au and 1, 0.98, 1.89, and 1.91 wt% respectively. Rhodium was taken as reference for this experiment. The samples were characterized by X-Ray Diffraction (XRD), UV-vis absorption spectra, N2 physisorption (BET Specific Surface Area), High Annular Angle Analysis Darkfield (HAADF) and Transmission Electron Microscopy Scanning (STEM), H2 chemisorption, optical emission spectroscopy with inductive coupling plasma analysis (ICP-OES), solid fluorescence, X-ray Photoelectron Spectroscopy (XPS) and OH quantification. The presence of the anatase crystalline phase was mostly confirmed in all samples. The band gap decreased with the presence of metal (from 3.24 to 2.92 eV). The specific area was a function of the metal particle size. The metal particle diameter showed the following sequence Pt > Ru > Au > Rh. By XPS, TiO2 does not manifest changes in oxidation states, but when impregnated with metals, only Pt shows the highest abundance of any oxidized state (Pt2+). The presence of metal reveals less electron–hole recombination compared with titanium oxide. The results of photocatalytic activity showed that Pt and Rh are the two metals with the highest mineralization (99.0 and 98.3%, respectively).
Introduction
2,4-Dichlorophenoxyacetic acid is one of the most widely used herbicides in the world due to its mobility and high persistence in soil and water, it is commonly used for the control of broadleaf weeds in gardens, pastures, wheat, rice, and citrus crops, among others.1 Due to its constant use, it has been possible to quantify and identify it in surface and groundwater due to its low absorption in the soil, high leaching, and medium solubility in water (900 mg L−1).2 This herbicide has been classified as a possible human carcinogen and is an endocrine disruptor that also affects the central and peripheral nervous system.3 Therefore, its application has been legislated in many countries to control its use, the Environmental Protection Agency established 70 μg L−1 and in Mexico the Ministry of Health established 30 μg L−1 as the maximum permissible limits of this substance in water for human consumption.4–6 Many processes have been developed to remove this pollutant from the aqueous medium, including physical methods such as adsorption;7 chemical methods such as heterogeneous photocatalysis8 and biological methods, such as biodegradation.9 Heterogeneous photocatalysis, compared to other degradation processes, is a more efficient process because it is not a selective method, it is capable of oxidizing and mineralizing persistent organic compounds at low concentrations, it is stable to changes in pH and temperature, and it has low operating costs.10 However, this process uses a semiconductor. Titanium dioxide (TiO2) is an important multifunctional semiconductor, which can be applied to energy storage, solar cells, gas sensors, and photocatalysis.11–13 Generally, TiO2 in photocatalysis is activated by the adsorption of sufficient radiant energy to overcome the semiconductor's band gap energy (3.2 eV) and generate electron–hole pairs, the latter are responsible for directly oxidizing organic compounds or generating hydroxyl radicals (OH*) in water. Meanwhile, the electrons are responsible for reducing the oxygen present in the medium. The efficient separation of these pairs induces an efficient photocatalytic process, this can be done by modifying the structure and morphology of TiO2 by adding impurities or other metal oxides on its surface.14 Recently the sol–gel method has often been used to prepare and modify the properties of titania such as surface area, crystalline phase distribution, crystal size and band gap energy, the latter when transition metal dopants are added, to increase photoactivity, generating a double effect: decreasing the band gap energy and trapping electrons to avoid electron–hole recombination.15,16 On the other hand, the incipient impregnation preparation method has become the ideal complement to deposit ions on the TiO2 surface to remove aqueous contaminants. The impregnation of TiO2 with noble metal ions such as Pt,17 Ag,18 Au (ref. 19) Ru (ref. 20) y Pd (ref. 21) in oxidized state is reported in the literature. Other catalyst synthesis methods, such as deposition–precipitation, have proven to be effective in surface insertion and dispersion of these ions in the metallic state.22 Recently, yolk–shell type nanostructured materials of TiO2 with noble metals such as Au have been generated, which demonstrate photocatalytic properties.23 Rh doping of TiO2 has emerged as a viable technique to enhance visible light absorption. Both Rh3+ and Rh4+ introduce sub bands in the TiO2 bandgap. Rh3+ contributes a donor level to the valence band, thus reducing the energy of the band and shifting the absorption of light to the visible region.24 There is little evidence of studies carried out with Rh, among these works are Rh–In2O3.25 where oxytetracycline was degraded; Rh/TiO2, synthesized by sol–gel, however, the results obtained were not better than TiO2 in the degradation of p-nitrophenol; 2.5% Rh/TiO2 (ref. 26) modified with HCP by the sol–gel method (dealuminated clinoptilolite) in the degradation of pentachlorophenol.27 Recent developments indicate that the combination of both metal and semiconductor can be an even better catalyst for harvesting the sola or UV energy compared with those individual components. These combined materials, widely known as heterostructure materials, can retain the properties of the individual entities or generate new properties when placed together within a proximity.28–30 Therefore, in this work the degradation and mineralization of 2,4-diclophenoxyacetic acid was investigated using photocatalysts of TiO2 impregnated with 1% Rh, comparing them with Au, Pt, and Ru in the metallic state, respectively, with the same molar ratio, under UV irradiation, to know the effect generated by the Rh ions in the metallic state in the photocatalytic activity with the TiO2.Results and discussion
(a) BET specific surface area
The results of the specific area for each material analysed are shown in Table 2. It is observed that when Ti is impregnated with the different metals, this parameter does not undergo significant changes, despite the concentration of platinum greater than 1% by weight, there are no significant changes in the surface area of the titania.31 However, for this case, the material with Pt manifests a drastic drop in specific area, possibly due to poor dispersion and the growth of metallic agglomerates on the TiO2 surface.| Catalyst | Oxidation states | |||||||||||||
|---|---|---|---|---|---|---|---|---|---|---|---|---|---|---|
| Ti | Rh | Ru | Pt | Au | O | |||||||||
| Ti3+ | Ti4+ | Rh° | Rh3+ | Ru° | Ru4+ | Pt° | Pt2+ | Pt4+ | Au° | OI | OII | OIII | ||
| TiO2 | 3.1 | 96.9 | — | — | — | — | — | — | — | — | 88.2 | 9.9 | 1.9 | |
| Rh/TiO2 | 5.5 | 94.5 | 54.4 | 45.6 | — | — | — | — | — | — | 87.3 | 10.6 | 2.1 | |
| Ru/TiO2 | 5.9 | 94.1 | — | — | 84.2 | 15.8 | — | — | — | — | 91.1 | 7.7 | 1.2 | |
| Pt/TiO2 | 5.3 | 94.7 | — | — | — | — | 56.5 | 24.9 | 18.7 | — | 87.1 | 10.7 | 2.2 | |
| Au/TiO2 | 5.7 | 94.3 | — | — | — | — | — | — | — | 100 | 88.8 | 9.7 | 1.5 | |
| Catalyst | Eg (eV) | Surface specific area (BET, m2 g−1) | λ (nm) | ICP (wt%) | D (%) | ![[d with combining macron]](https://www.rsc.org/images/entities/i_char_0064_0304.gif) (nm) (nm) |
SCO2 | Kapp × 102 (min−1) | t1/2 (min) |
|---|---|---|---|---|---|---|---|---|---|
| Ti | 3.24 | 68 | 382.7 | — | — | — | 74.3 | 0.38 | 182 |
| RhTi | 3.10 | 64 | 400.0 | 1.28 | 69 | 1.6 | 98.3 | 1.13 | 61 |
| RuTi | 3.31 | 62 | 424.7 | 1.22 | 63 | 3.3 | 80.6 | 0.86 | 80 |
| PtTi | 3.09 | 42 | 401.3 | 2.15 | 14 | 8.3 | 99.0 | 1.16 | 59 |
| AuTi | 3.18 | 63 | 389.9 | 2.16 | 53 | 2.2 | 98.0 | 0.94 | 73 |
(b) ICP-analysis
The loaded metal content on the TiO2 support was determined by ICP-OES measurement. For this work, the amount of metal deposited were: 1, 0.98, 1.89, and 1.91% by weight for Rh, Ru, Pt, and Au, respectively, on the TiO2 surface. The ICP-OES results (Table 2) suggest that the amount of metal deposited is close to the expected theoretical values.(c) X-ray diffraction
In Fig. 1, the X-ray diffraction patterns of all the materials are observed, the signals corresponding to the crystalline phases anatase (25.3, 37.1, 48.2, 53.1 55.1, 62.2 and 67.61°) and rutile (27.2°) on the 2θ scale for TiO2 are indicated. The crystal structures were identified by means of the Joint Committee on Powder Diffraction Standards (JCPDS) library, for both phases (anatase 21-1272 and rutile 88-1175). On the other hand, the signals, characteristic of the metals impregnated in the titania were identified: 38.2, 44.4° (Au); 39.8, 46.2° (Pt); 41.1, 69.9° (Ru) and 38.4, 42.2° (Rh) on the same scale.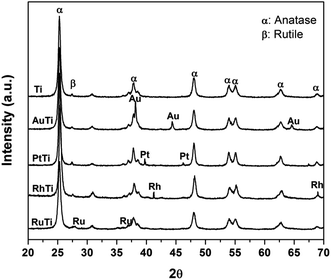 | ||
| Fig. 1 X-ray diffraction patterns for Ti, AuTi, PtTi, RhTi photocatalysts, and where α = anatase and β = rutile. | ||
(d) UV-vis spectroscopy
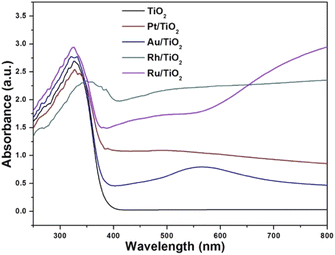
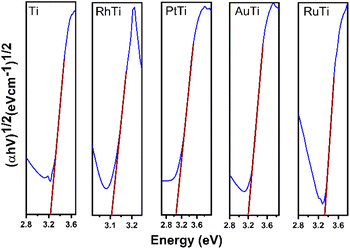
The diffuse reflectance spectra of the samples analysed are presented in Fig. 2. Titanium oxide presented the typical spectrum, absorption in the ultraviolet region (412 cm−1). The absorption capacity is modified by the presence of gold particles (422 nm) compared to titanium oxide. Platinum also modifies the absorption capacity with respect to gold (470 nm). The sample impregnated with ruthenium showed a much higher absorption capacity (539 cm−1) compared to AuTi and PtTi. The sample with rhodium shows a much higher absorption capacity compared to the other noble metals, absorbing in the visible region.32 As for the localized surface plasmon resonance (LSPR), metallic gold is in the visible region (440–600 nm), an effect induced by nanoparticles on the surface of titanium oxide.33 In the platinum sample the SPR is slightly detectable, this is due to the particle size present on the surface. The size of the metal particle is inversely proportional to the absorption of the surface plasmon resonance.34 An absorption near 450 nm was observed in the sample, a signal assigned to localized surface absorption of the ruthenium plasmon.35 In this sample, a broad absorption is observed in the 600–800 nm region, associated with the electromagnetic field-induced collective oscillation of free conduction electrons filling the states near the Fermi level in the conduction band.36 Concerning the rhodium sample, theoretical studies indicate that Rh NPs have a very strong UV plasmonic response and show a local surface plasmon resonance near 330 nm.37,38 It is well known that LSPRs depend on the size and shape of nanoparticles.38 The results suggested that noble metal-loaded titanium can enhance the photocatalytic activity under visible light irradiation.Fig. 3 shows the Tauc plot to determine the band gap energy (Eg) of the photocatalysts in this work. TiO2 showed an energy of 3.24 eV. This result agrees with the literature of 3.2 eV. In the case of metal catalysts, it was 3.09, 3.10, 3.18 and 3.31 eV for PtTi, RhTi, AuTi and RuTi, respectively (Table 2). This decrease in bandgap energy is due to surface structural changes between TiO2 and the metal. The modification in the Fermi level near the CB of the semiconductor helps to improve the useful life of the photogenerated electrons, which causes the decrease in the recombination of charge carriers, benefiting the photocatalysis process that occurs on the surface.39,40 This effect is observed in the PL spectra (Fig. 4). Because a metal–semiconductor Schottky junction is formed, facilitating charge separation and transfer.41
(e) Solid fluorescence
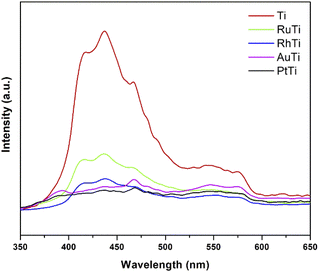
To investigate the fate of photogenerated electrons as a function of noble metals as well as holes in semiconducting nanoparticles, photoluminescence analysis was employed. PL emission is the direct result of the recombination of free carriers.42–45 The lower PL intensity is indicative of the lower recombination rate of photogenerated charge carriers Fig. 4 shows the results of irradiation at 310 nm and in a wavelength range of 300–700 nm. The peak associated with the band gap transition emission appears at 398 nm.46 Emission signals at 420 and 440 nm should be attributed to indirect band gap and surface recombination.47 Other emission peaks at about 480 and 520 nm are caused by O2 vacancies and surface defects of the samples. Because the Fermi levels of metals (Rh, Ru, Pt and Au) are lower than the conduction band of titanium oxide, the photoexcited electrons can be transferred from the semiconductor to the metal nanoparticles deposited on the TiO2 surface. According to the photoluminescence results, metals reduce the possibility of electron hole recombination. The signal intensity of titanium oxide is higher due to the higher rate of electron hole recomposition under irradiation. The maximum intensity of noble metals modified TiO2 increased in the following order RuTi < RhTi < AuTi < PtTi.(f) X-ray photoelectron spectroscopy (XPS)
Fig. 5 shows the XPS deconvoluted spectra of the metal species (Rh, Ru, Pt, Au) of the photocatalysts supported on TiO2, synthesized by the impregnation method. Where the oxidation states of each of the photocatalysts are studied. According to the literature, rhodium presents a doublet due to the spin–orbital splitting in the 3d3/2 and 3d5/2 regions between the binding energy of 315–305 eV.48 Rhodium can present two oxidation states Rh° (ref. 49) y Rh3+ between 306.8–307.1 and 307.7–308.5 eV respectively. In case of RhTi two oxidation states are observed at 306.7 and 307.8 eV for Rh° and Rh3+ respectively. According to Y. V. Larichev et al. mentions that titanium has surface properties that benefit the reduction to Rhodium metal using RhCl3 precursor. Table 1 shows the percentage of abundance of the oxidation states where Rh° presents 54.4% and Rh3+ 45.6%, which means that there is a Rh°/Rh3+ ratio of 1.19. In the Ru 3d spectrum for RuTi, deconvolution was performed knowing that there is an overlap with the C 1s according to Lan Jiang et al. and Jingjing Tan et al.50,51 where C 1s and C![[double bond, length as m-dash]](https://www.rsc.org/images/entities/char_e001.gif) O species were found between the binding energies 284.8 and 288.9 eV respectively. On the other hand, in the 3d5/2 region, two signals at approximately 280.2 and 281.6 eV are observed. The position at 280.2 is attributed to the metallic state of Ru° (ref. 32) and the one at 281.6 is attributed to the oxidized state of Ru4+.52 According to Table 2 shows a % species abundance 84.2 for the metallic state and 15.8% for the 4+ state. Weiyi Ouyang et al.53 report that ruthenium can provide interesting activity due to the existence of plasmon resonances directly attributed by the Ru4+ oxidation state. Fig. 5 shows the binding energies for the Au 4f levels in the case of gold, the energies for the metallic state are at 84 eV and the oxidized Au+ species between 85.6–87.7 eV approximately according to the literature.54 However, a peak at 83.3 eV was found at the 4f7/2 level, this result shows that there is a shift of Δ = 1.3 eV with respect to the Au° characteristic signal. Different authors mention that this shift is caused by a strong metal–support interaction in this case the Au°–TiO2 interaction.
O species were found between the binding energies 284.8 and 288.9 eV respectively. On the other hand, in the 3d5/2 region, two signals at approximately 280.2 and 281.6 eV are observed. The position at 280.2 is attributed to the metallic state of Ru° (ref. 32) and the one at 281.6 is attributed to the oxidized state of Ru4+.52 According to Table 2 shows a % species abundance 84.2 for the metallic state and 15.8% for the 4+ state. Weiyi Ouyang et al.53 report that ruthenium can provide interesting activity due to the existence of plasmon resonances directly attributed by the Ru4+ oxidation state. Fig. 5 shows the binding energies for the Au 4f levels in the case of gold, the energies for the metallic state are at 84 eV and the oxidized Au+ species between 85.6–87.7 eV approximately according to the literature.54 However, a peak at 83.3 eV was found at the 4f7/2 level, this result shows that there is a shift of Δ = 1.3 eV with respect to the Au° characteristic signal. Different authors mention that this shift is caused by a strong metal–support interaction in this case the Au°–TiO2 interaction.
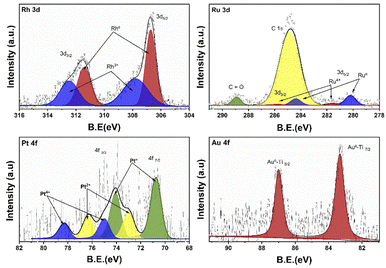 | ||
| Fig. 5 XPS spectra of the Rh 3d, Ru 3d, Pt 4f and Au 4f regions of the RhTi, RuTi, PtTi and AuTi photocatalysts. | ||
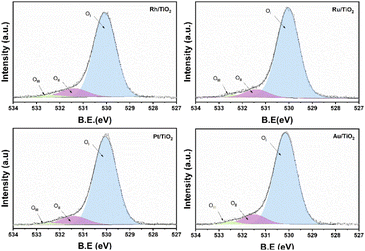
On the other hand, no signal characteristic of Au+ was found. In the case of Pt deconvolution, it was carried out in the 4f7/2 region, where different platinum oxidation states were found: 70.74 eV (Pt°),55 73.0 eV (Pt2+)56 y 75.0 eV (Pt4+)57 with an abundance of 56.5, 24.9 years 18.7% respectively (Table 1). For the Ti 2p region in all the catalysts, two oxidation states Ti3+ and Ti4+ were found, where the deconvolution was carried out in the Ti 2p3/2 region (figure not shown) at 458.7 and 457.2 eV approximately. TiO2 showed the lowest percentage of abundance of the Ti3+ species (Table 1) with 3.1%, on the other hand, the catalysts Rh, Ru and Pt showed an increase in percentage with respect to TiO2, this increase is probably related to a strong metal–support interaction.58 Fig. 6 shows the deconvolution of the O 1s spectra of the photocatalysts, where the superposition of three components was found at approximately 530.2, 531.5 and 532.5 eV. for OI, OII and OIII, respectively. The OI peak is characteristic to the O2− ions found in the surface lattice of TiO2.59 On the other hand, the OII peak is attributed to oxygen defects in the TiO2 matrix related to oxygen vacancies.60 The anionic vacancies change the net electron charge density; this non-lattice oxygen peak has been attributed to the surface O− ions with lower electron density.61 The peak at 532.5 (OIII) is related to hydroxyl groups, in this case, to Ti–OH groups. According to Table 1, the abundances related to OI are between 88 and 91% approximately. In the case of oxygen defects (OII) on the TiO2 surface, the RhTi and PtTi photocatalysts showed the highest percentage of abundance with 10.6 and 10.7% approximately. Likewise, the catalysts with Rh and PT showed the highest abundance attributed with the formation of Ti–OH groups. These results could be related to a better activity in the degradation of 2,4-D.
(g) HAADF-STEM
Fig. 7 shows typical TEM-HAADF images showing metallic particles of RhTi, AuTi, RuTi and PtTi reduced at 500 °C. Table 2 shows the average sizes of the metallic particles calculated from the histograms, see Fig. 7. In HAADF mode, the image intensity is approximately proportional to the square of the atomic number of element (Z2),62 and due to the differences between Rh (45), Au (79), Ru (45), Pt (78) and Ti (22) values, Au and Pt particles provide higher contrast in TEM-HAADF images. Therefore, the highly contrasted particles can be attributed to metallic particles, with the AuTi and PtTi samples having larger size in the metallic particle (Fig. 7e and g). The metals with the lowest metal dispersion were Pt and Ru which according to the literature, the synthesis precursor directly influences the particle size of Ru.63 While the Pt dispersion, due to its high content, presents large particle sizes in comparison with Rh, Ru and Au. According to the literature, concentrations higher than 1% of platinum generate particles larger than 5 nm.64 In contrast, higher dispersion is present in Rh and Au metals. One of the characteristics of Rh metal is its ease of dispersion.65 Despite the high Au content, it has been reported that using HAuCl4 it is possible to obtain small metallic particles.66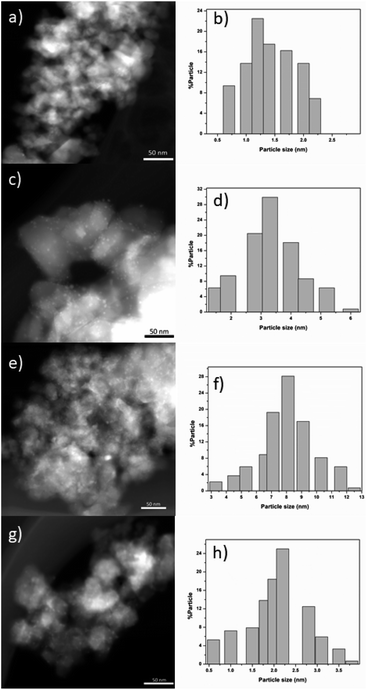 | ||
| Fig. 7 HAADF images of RhTi (a), RuTi (c), PtTi (e) and AuTi (g). Histograms of the metal particle size of RhTi (b), RuTi (d), PtTi (f) and AuTi (h) catalysts. | ||
(h) Quantification of radicals (OH)
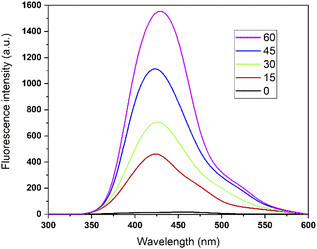
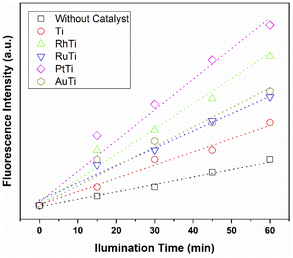
According to sonochemistry when ultrasound is applied to water, OH˙ OH2˙ O2− y H2O2 species can form because of the high energies generated during cavitational collapse.67 These species can also be formed by chemical radiation, via an ionizing photon.68 These species are similar to those produced in oxidation processes via photocatalysis.69 In Fig. 8, the fluorescence results of the PtTi catalyst are shown. The spectrum of the PtTi catalyst has the same shape and maximum emission wavelength with respect to that reported by Xiao et al.70 Therefore, it is possible that the fluorescent products generated on the PtTi catalyst are a product of the reaction of terephthalate with OH˙ Fig. 9 shows the dependence of fluorescence intensity on illumination time at 425 nm. The intensity follows an almost linear trend, so the formation of OH radicals is proportional to the illumination time, obeying zero order kinetics. The lines that fit each series provide the slope, which can be related to the rate of formation of OH radicals,70 see Fig. 9. The catalysts keep an order with respect to the rate of radical formation: PtTi > RhTi > AuTi > RuTi > Ti. In general, the incorporation of metal improves the formation rate of OH radicals, which indicates that the metals Pt and Rh present a better photoactivity in the oxidation reaction of 2,4-D.(i) Photocatalytic activity
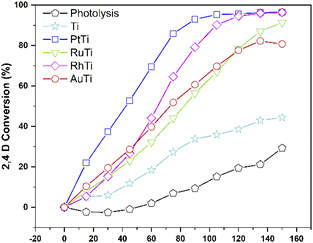
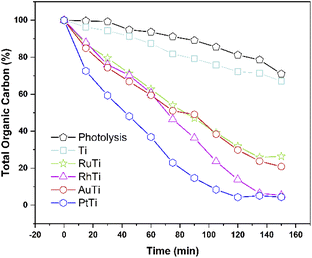
The conversion of the pollutant as a function of time for all catalysts is shown in Fig. 10. The incorporation of catalyst in the degradation increases the conversion, this can be verified by analysing the curve corresponding to the Ti sample and the uncatalyzed reaction. The RhTi sample showed a linear trend in 100 min of reaction, achieving 96.37% conversion in 120 min. The RuTi catalyst presented an almost linear progress, reaching 91.37% conversion at 150 min of reaction. The PtTi sample stands out for reaching 96.53% conversion in only 100 minutes. Finally, the AuTi sample presented a continuous and slightly superior behaviour with respect to the RuTi sample, without achieving 80.78% conversion in the established time. The rhodium metal showed to be active in photodegradation, obtaining good results compared to Ru and Au. Despite the high Pt content, the rhodium metal presents a convenient activity to highlight, demonstrating that it is a metal to be considered in the photodegradation of molecules.As for the total degradation of the compound, the TOC analysis indicates (Fig. 11) that only the PtTi and RhTi catalysts destroy the pollutant around 97%. It should be noted that the PtTi sample degrades 96.53% of 2,4-D in 105 minutes and mineralize (Sco2) 99.0% to CO2. In this sense, the RhTi sample only take 15 minutes more than PtTi in both stages to 96.4 and 98.3% of degradation and mineralization respectively. Despite the photocatalytic activity presented by the RuTi catalyst, it's not exceeded 81% mineralization of 2,4-D did not manage to exceed 80% mineralization of 2,4-D. These results may be related to the formation of Ti3+ shown by the XPS results in the table, since according to Li et al. enhances oxygen chemisorption and promotes excited electrons trapped by O2.71
Therefore, the enhancement of photoactivity has a good agreement with the decrease of PL intensity (Fig. 4).
The apparent kinetic constant and the half-life were calculated, assuming first-order,72 the results are shown in Table 2. The value of the kinetic constant for the Ti sample is lower when compared to the samples with metal. An increase in the kinetic constant is evident when incorporating a noble metal, despite being the sample with the lowest value in the constant with respect to RhPt and Au, RuTi is 2.3 times higher than Ti. As for the highest values are the samples PtTi and RhTi, the difference between them is only 2.58%. The half-life indicates that in the absence of metal, at least 180 min must elapse to achieve 50% conversion. In contrast, the half-life is reduced by up to 68% for PtTi and 66% for RhTi taking Ti as a reference. In this respect, there is only a difference of 2 min between the RhT and PtTi samples. According to the metal particle size, the Rh showed small metal particle size (1.6 nm) compared to the other metals and the highest dispersion with 69%. However, metal deposition changes the properties of the surface, reducing it because of the removal of oxygen atoms;73 increasing vacancies. The main interaction is ionic attraction due to charge transfer between the reduced surface and the adjacent metal atoms.58 Therefore, a reduction of the surface is essential to ensure good photoactivity in the degradation of pollutants. In this sense, it has been reported the importance of interaction that takes place between the metal Rh,48 Ru,74 Pt (ref. 75) and Au (ref. 76) with the vacancies of titanium oxide.
The materials with Pt and Rh were the best in the mineralization of 2,4-D, however, considering the metal load, the RhTi is better, because only 1% of metal load was used. According to the above in Fig. 12 shows of the RhTi mechanism photocatalytic, where the surface adsorbed O2 molecules were reduced to form superoxide radicals (O2−), which are unstable in aqueous solution and can be readily decomposed into hydroxyl radicals (OH−) with sufficient oxidation potential for the photocatalytic degradation of recalcitrant compounds.77,78 This effect is for the higher adsorption capability of O2 on the surface of the anatase phase of TiO2 and the Rh reduce the recombination rate for the electron−hole pairs photogenerated.79 These hydroxyl radicals easily degrade the 2,4-D into CO2 and H2O. The generation of OH− is an important key in the degradation of organic compounds, in this work, according to the quantification of OH− (Fig. 9), a strong relationship was found, where the PtTi and RhTi catalysts showed greater generation of OH−, in such a way that manner were the ones that best mineralized 2,4-D.
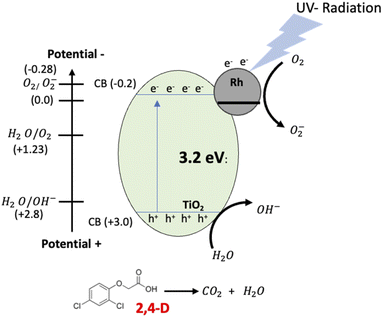 | ||
| Fig. 12 Schematic representation of the proposed photocatalysis mechanism of 2,4-D degradation on the Rh/TiO2 by UV radiation. | ||
Accorded to above, several experiments with scavengers were carried out to confirm the species involved in the UV photocatalytic reaction with RhTi catalyst. Scavenger experiments were benzoquinone (BQ, superoxide anions O2−), isopropanol (IPA, ˙OH radicals), ethylenediaminetetraacetic acid (EDTA, h+ hole trapping) and potassium dichromate (K2Cr2O7, e−).80,81 Fig. 13 shows the results of the apparent kinetic constant after the addition of scavengers, where a decrease of 83 and 63% was obtained with IPA and BQ, respectively. This result shows that OH radicals and superoxide (O2−) play a very important role in the photodegradation of 2,4D. On the other hand, a decrease of 14% and 21% was observed with K2Cr2O7 and EDTA. this shows little contribution to degradation.
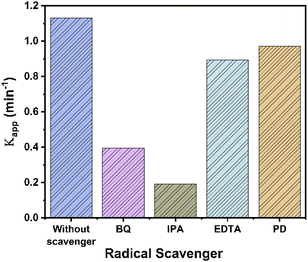 | ||
| Fig. 13 Apparent kinetic constant (kapp) for the degradation of 2,4D by RhTi with and without different scavengers. | ||
(j) Stability and recyclability reaction
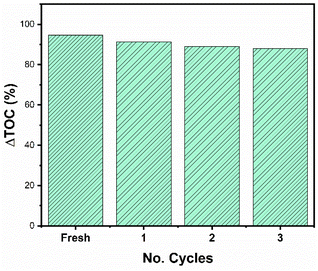
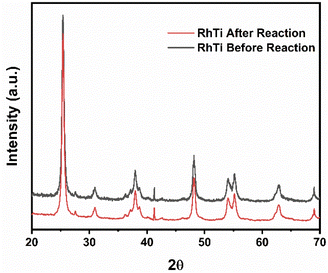
It is important to carry out a study of the stability and reuse cycles of the catalyst to know if the catalyst can be promising and reduce costs in photocatalytic processes. Fig. 14 shows the reuse cycles of the RhTi catalyst. For each cycle, the catalyst was filtered, washed several times with methanol and dried at 120 °C. Finally, the catalyst was calcined in a flow of H2 at 400 °C for 1 h. According to the results obtained, after 3 cycles of reuse, the catalyst had a loss of 7.7% of activity with respect to the fresh catalyst. This result showed that a very significant change in the reaction was not obtained.On the other hand, after the reuse cycles, the XRD study was carried out (Fig. 15) to find out if there was a change in the material, however, no significant changes were found in the structure of the catalyst.
Experimental
(a) TiO2 preparation
Titanium oxide was synthesized by the sol–gel method under the following procedure: n-titanium butoxide and n-butanol were placed in a balloon flask under constant stirring at pH 7. Subsequently, an alkoxide/water ratio of 1/8 was added dropwise. The system was kept under refluxing conditions for 24 hours at 70 °C. Afterwards, the excess solvents were removed using a rotary evaporator. The solid obtained was dried at 120 °C for 12 hours and then sieved to obtain a fine powder. Finally, the material was calcined at 500 °C for 12 hours using a heating rate of 2 °C min−1 under an air flow of 60 mL min−1.(b) Impregnation of metals (Au, Pt, Rh and Ru)
The precursor salts were RhCl3·xH2O, RuCl3·H2O, H2Cl6Pt·6H2O and HAuCl4·6H2O. Rhodium was taken as a reference, therefore, as a comparison target the amount of Rh (1 wt%) in moles is the same in Ru (0.98 wt%), Pt (1.89 wt%) and Au (1.91 wt%). The required amount of salt was dissolved and introduced to a 250 mL balloon flask where titanium oxide was in suspension. The solvent was extracted in a rotary evaporator. Subsequently, the sample was placed in an oven at 120 °C for 24 hours. The sample received a heat treatment in an air flow at 60 mL min−1 with a heating ramp of 1 °C min−1 until reaching 500 °C. The metal was obtained in a thermal process in a reducing atmosphere (hydrogen) with a flow rate of 60 mL min−1 and a heating ramp of 1 °C min−1 until reaching 500 °C, remaining at that temperature for 5 hours. The following symbology was used: Ti for TiO2 and XTi for impregnated TiO2 where X = Ru, Rh, Pt and Au.(c) Characterization
| α(hv) = A(hv − Eg)m/2 |
![[d with combining macron]](https://www.rsc.org/images/entities/i_char_0064_0304.gif) ) was calculated using equation:
) was calculated using equation:where di is the diameter measured directly from the image; and ni is the number of particles having the same diameter di.
(d) Photocatalytic activity
Photodegradation was performed at room temperature for 150 min, according to the following methodology: 125 mg of catalyst was added to 200 mL of aerated solution with a 40 ppm contaminant concentration of 2,4D (dichlorophenoxyacetic Acid), bubbled with a pump (BOYU S-4000B, pressure 0.012 MPa, power 9 W and an output flow of 3.2 L min−1) and constant agitation to achieve adsorption–desorption equilibrium. Subsequently, it was irradiated with a UV lamp (Pen-Ray (UVP), λ = 254 nm and an emission of 4000 μW cm−2), all this in the absence of light. From the reaction, samples were taken every 15 min and the evolution of the photodegradation was followed by an Agilent Technologies UV-vis spectrophotometer, model Cary 60, monitoring the intensity of the absorption band of 2,4-D at 282 nm (applying the Lambert–Beer equation) as a function of irradiation time. Photolysis of 2,4-D was also performed in the complete absence of light and without catalyst. All photocatalytic evaluations were performed in duplicate. The % conversion of 2,4D (X2,4D) was calculate with the equation:where C0 is an initial concentration of 2,4D and Cn is the 2,4D concentration to different reaction times.
Total Organic Carbon analysis (TOC), a Shimadzu TOC-VCHS analyser was used to obtain this parameter, employing a nondispersive infrared detector to quantitatively analyse carbon dioxide originated by the sample. The % TOC was calculated with the equation:
Conclusions
In this research work, the comparison of Rh on TiO2 was carried out, with respect to Pt, Au and Ru. Where the PtTi and RhTi showed the better photocatalytic properties because the decrease in bandgap energy (Eg), which generated a strong support–metal interaction which caused the decrease in the recombination of charge carriers, benefiting the photocatalysis process that occurs on the surface. Consequently, showing a good activity in the degradation and mineralization of 2,4-D. The PtTi catalyst showed a higher activity, but not very significant, with a difference of 2.85% in the reaction rate constant. However, RhTi achieved this photocatalytic process with a lower amount of by weight (1 wt%), a smaller metal particle diameter and a higher metal dispersion. On the other hand, the Ru and Au catalysts did not show good activity when compared to Rh. This results as a reference point to continue research the photocatalytic degradation of another organic compounds using RhTiO2 photocatalyst.Author contributions
G. A. Reguero-Márquez: methodology, software, validation, formal analysis, investigation, writing-original draft, writing-review & editing, visualization. Ma. A. Lunagómez-Rocha: methodology, software, validation, formal analysis, investigation, writing-original draft, writing-review & editing, visualization, project administration, funding acquisition. A. Cervantes-Uribe: methodology, validation, investigation, writing-original draft, writing-review & editing, visualization, project administration, funding acquisition. G. del Angel: investigation, writing-original draft, writing-review & editing, visualization. I. Rangel: investigation, writing-original draft, writing-review & editing, visualization. J. G. Torres Torres: conceptualization, methodology, validation, formal analysis, investigation, resources, writing-original draft, writing-review & editing, visualization, supervision, project administration, funding acquisition. F. González: investigation, writing-original draft, writing-review & editing. S. Godavarthi: investigation, writing-original draft, writing-review & editing, visualization. J. C. Arévalo-Pérez: methodology, validation, investigation, writing-original draft, writing-review & editing, visualization. A. E. Espinosa de los Monteros: investigation, writing-original draft, writing-review & editing, visualization. A. A. Silahua-Pavon: methodology, software, validation, formal analysis, investigation, writing-original draft, writing-review & editing, visualization, project administration, funding acquisition.Conflicts of interest
There are no conflicts to declare.Acknowledgements
We would like to thank the National Council of Science and Technology (CONACYT), Project No. 132648, Cátedras CONACYT (Invesigadoras e Investigadores por México) Project Number 1024 “Nanomaterials Study to Energy Applications”, PRODEP project with codes UJAT-PTC-250, 287 and finally the SEP-PFCE-UJAT-DACB 2020-2021 program project for their financial support.References
- J. Popp, K. Pető and J. Nagy, Agron. Sustainable Dev., 2013, 33, 243–255 CrossRef.
- W. Yang, F. Jiao, L. Zhou, X. Chen and X. Jiang, Appl. Surf. Sci., 2013, 284, 692–699 CrossRef CAS.
- D. H. Garabrant and M. A. Philbert, Review of 2,4-Dichlorophenoxyacetic Acid (2,4-D) Epidemiology and Toxicology, Crit. Rev. Toxicol., 2002, 32(4), 233–257 CrossRef CAS PubMed.
- D. J. Hamilton, Á. Ambrus, R. M. Dieterle, A. S. Felsot, C. A. Harris, P. T. Holland, A. Katayama, N. Kurihara, J. Linders, J. Unsworth and S. Wong, International union of pure and applied chemistry and the environment division commission on agrochemicals and the environment* regulatory limits for pesticide residues in water (Iupac Technical Report), Japan, 2003, vol. 75 Search PubMed.
- DOF - Diario Oficial de la Federación, https://www.dof.gob.mx/nota_detalle.php?codigo=2063863&fecha=31/12/1969#gsc.tab=0, (accessed September 6, 2022) Search PubMed.
- DOF - Diario Oficial de la Federación, https://www.dof.gob.mx/nota_detalle.php?codigo=5603318&fecha=22/10/2020#gsc.tab=0, (accessed September 6, 2022) Search PubMed.
- V. O. Njoku, K. Y. Foo and B. H. Hameed, Chem. Eng. J., 2013, 215–216, 383–388 CrossRef CAS.
- J. S. Valente, F. Tzompantzi, J. Prince, J. G. H. Cortez and R. Gomez, Appl. Catal., B, 2009, 90, 330–338 CrossRef CAS.
- A. J. González, A. Gallego, V. L. Gemini, M. Papalia, M. Radice, G. Gutkind, E. Planes and S. E. Korol, Int. Biodeterior. Biodegrad., 2012, 66, 8–13 CrossRef.
- A. Fujishima, T. N. Rao and D. A. Tryk, Titanium dioxide photocatalysis, J. Photochem. Photobiol., C, 2000, 1(1), 1–21 CrossRef CAS.
- W. Wen, J. Hai, J. Yao, Y.-J. Gu, H. Kobayashi, H. Tian, T. Sun, Q. Chen, P. Yang and C. Geng, Chem. Mater., 2021, 33, 1489–1497 CrossRef CAS.
- W. Wen, J.-M. Wu, Y.-Z. Jiang, L.-L. Lai and J. Song, Chem, 2017, 2, 404–416 CAS.
- C. Geng, T. Sun, Z. Wang, J.-M. Wu, Y.-J. Gu, H. Kobayashi, P. Yang, J. Hai and W. Wen, Nano Lett., 2021, 21, 7021–7029 CrossRef CAS PubMed.
- W. Choi, A. Termin and M. R. Hoffmann, The Role of Metal Ion Dopants in Quantum-Sized TiO2: Correlation between Photoreactivity and Charge Carrier Recombination Dynamics, J. Phys. Chem., 2002, 98(51), 13669–13679 CrossRef.
- U. G. Akpan and B. H. Hameed, Appl. Catal., A, 2010, 375, 1–11 CrossRef CAS.
- J. C. Colmenares, M. A. Aramendía, A. Marinas, J. M. Marinas and F. J. Urbano, Appl. Catal., A, 2006, 306, 120–127 CrossRef CAS.
- H. Katsumata, M. Sada, Y. Nakaoka, S. Kaneco, T. Suzuki and K. Ohta, J. Hazard. Mater., 2009, 171, 1081–1087 CrossRef CAS PubMed.
- S. Saha, J. M. Wang and A. Pal, Sep. Purif. Technol., 2012, 89, 147–159 CrossRef CAS.
- A. Ayati, A. Ahmadpour, F. F. Bamoharram, B. Tanhaei, M. Mänttäri and M. Sillanpää, Chemosphere, 2014, 107, 163–174 CrossRef CAS PubMed.
- M. Gar Alalm, S. Ookawara, D. Fukushi, A. Sato and A. Tawfik, J. Hazard. Mater., 2016, 302, 225–231 CrossRef CAS PubMed.
- S. Sakthivel, M. v. Shankar, M. Palanichamy, B. Arabindoo, D. W. Bahnemann and V. Murugesan, Water Res., 2004, 38, 3001–3008 CrossRef CAS.
- S. Oros-Ruiz, R. Zanella and B. Prado, J. Hazard. Mater., 2013, 263, 28–35 CrossRef CAS PubMed.
- Y.-A. Chen, Y.-T. Wang, H. S. Moon, K. Yong and Y.-J. Hsu, RSC Adv., 2021, 11, 12288–12305 RSC.
- C. C. Nguyen, C. T. Dinh and T. O. Do, RSC Adv., 2017, 7, 3480–3487 RSC.
- B. Zhou, Y. Li, J. Bai, X. Li, F. Li and L. Liu, Appl. Surf. Sci., 2019, 464, 115–124 CrossRef CAS.
- L. Xiu-Hua, M. Dan and D. Yi, Effects of rhodium doping on the microstructures and photocatalytic performances of TiO2 powders, 2016, 40(11), 678–682 Search PubMed.
- S. O. Sanni and O. G. Idemudia, J. Nanomater., 2014, 2014, 287493 Search PubMed.
- Y.-H. Chiu, K.-D. Chang and Y.-J. Hsu, J. Mater. Chem. A, 2018, 6, 4286–4296 RSC.
- M.-Y. Kuo, C.-F. Hsiao, Y.-H. Chiu, T.-H. Lai, M.-J. Fang, J.-Y. Wu, J.-W. Chen, C.-L. Wu, K.-H. Wei and H.-C. Lin, Appl. Catal., B, 2019, 242, 499–506 CrossRef CAS.
- S. K. Dutta, S. K. Mehetor and N. Pradhan, J. Phys. Chem. Lett., 2015, 6, 936–944 CrossRef CAS PubMed.
- H. W. Chen, Y. Ku and Y. L. Kuo, Water Res., 2007, 41, 2069–2078 CrossRef CAS PubMed.
- E. Grabowskaa, M. Diak, T. Klimczuk, W. Lisowski and A. Zaleska-Medynska, Mol. Catal., 2017, 434, 154–166 CrossRef CAS.
- M. Scarisoreanu, A. G. Ilie, E. Goncearenco, A. M. Banici, I. P. Morjan, E. Dutu, E. Tanasa, I. Fort, M. Stan, C. N. Mihailescu and C. Fleaca, Appl. Surf. Sci., 2020, 509, 145217 CrossRef CAS.
- C. Langhammer, Z. Yuan, I. Zorić and B. Kasemo, Nano Lett., 2006, 6, 833–838 CrossRef CAS PubMed.
- X. Lin, K. Yang, R. Si, X. Chen, W. Dai and X. Fu, Appl. Catal., B, 2014, 147, 585–591 CrossRef CAS.
- R. A. Ganeev, G. S. Boltaev, R. I. Tugushev and T. Usmanov, Appl. Phys. B, 2010, 100, 571–576 CrossRef CAS.
- A. M. Watson, X. Zhang, R. Alcaraz De La Osa, J. M. Sanz, F. González, F. Moreno, G. Finkelstein, J. Liu and H. O. Everitt, Nano Lett., 2015, 15, 1095–1100 CrossRef CAS PubMed.
- M. Moskovits, Surface-enhanced spectroscopy, 1985 Search PubMed.
- M. M. Khan, S. A. Ansari, J. Lee and M. H. Cho, J. Ind. Eng. Chem., 2013, 19, 1845–1850 CrossRef CAS.
- X. Li, T. Fan, H. Zhou, B. Zhu, J. Ding and D. Zhang, Microporous Mesoporous Mater., 2008, 116, 478–484 CrossRef CAS.
- S. K. Khore, S. R. Kadam, S. D. Naik, B. B. Kale and R. S. Sonawane, New J. Chem., 2018, 42, 10958–10968 RSC.
- D. Li, H. Haneda, S. Hishita and N. Ohashi, Chem. Mater., 2005, 17, 2596–2602 CrossRef CAS.
- Z. Bian, J. Zhu, F. Cao, Y. Lu and H. Li, Chem. Commun., 2009, 3789–3791 RSC.
- Y. Yang, Y. Yao, L. He, Y. Zhong, Y. Ma and J. Yao, J. Mater. Chem. A, 2015, 3, 10060–10068 RSC.
- Y. Cao, L. Zong, Q. Li, C. Li, J. Li and J. Yang, Appl. Surf. Sci., 2017, 391, 311–317 CrossRef CAS.
- M. V. Sofianou, N. Boukos, T. Vaimakis and C. Trapalis, Appl. Catal., B, 2014, 158–159, 91–95 CrossRef CAS.
- J. C. Yu, J. Yu, W. Ho, Z. Jiang and L. Zhang, Chem. Mater., 2002, 14, 3808–3816 CrossRef CAS.
- J. Zhang, S. Liu, Q. Wang, J. Yao, Y. Liu and B. Liu, Mater. Lett., 2020, 276, 128257 CrossRef CAS.
- Y. v. Larichev, O. v. Netskina, O. v. Komova and V. I. Simagina, Int. J. Hydrogen Energy, 2010, 35, 6501–6507 CrossRef CAS.
- L. Jiang and G. Zhou, Appl. Surf. Sci., 2021, 535, 147709 CrossRef CAS.
- J. Tan, J. Cui, X. Cui, T. Deng, X. Li, Y. Zhu and Y. Li, ACS Catal., 2015, 5, 7379–7384 CrossRef CAS.
- J. H. Shin, G. J. Kim and S. C. Hong, Appl. Surf. Sci., 2020, 506, 144906 CrossRef CAS.
- W. Ouyang, M. J. Muñoz-Batista, A. Kubacka, R. Luque and M. Fernández-García, Appl. Catal., B, 2018, 238, 434–443 CrossRef CAS.
- N. Kruse and S. Chenakin, Appl. Catal., A, 2011, 391, 367–376 CrossRef CAS.
- M. A. Matin, E. Lee, H. Kim, W. S. Yoon and Y. U. Kwon, J. Mater. Chem. A, 2015, 3, 17154–17164 RSC.
- D. A. Svintsitskiy, L. S. Kibis, A. I. Stadnichenko, E. M. Slavinskaya, A. S. Zaguzin, A. v. Romanenko, E. A. Derevyannikova, O. A. Stonkus and A. I. Boronin, in AIP Conference Proceedings, American Institute of Physics Inc., 2019, vol. 2143 Search PubMed.
- A. Romanchenko, M. Likhatski and Y. Mikhlin, Minerals, 2018, 8, 578 CrossRef CAS.
- S. J. Tauster, S. C. Fung, R. T. K. Baker and J. A. Horsley, Science, 1981, 211, 1121–1125 CrossRef CAS PubMed.
- K. Batalović, N. Bundaleski, J. Radaković, N. Abazović, M. Mitrić, R. A. Silva, M. Savić, J. Belošević-Čavor, Z. Rakočević and C. M. Rangel, Phys. Chem. Chem. Phys., 2017, 19, 7062–7071 RSC.
- G. Cuauhtémoc, G. Torres and V. Bertin, Catal. Today, 2008, 133, 588–593 CrossRef.
- C. Mateos-Pedrero, S. R. González-Carrazán, M. A. Soria and P. Ruíz, Catal. Today, 2013, 203, 158–162 CrossRef CAS.
- L. A. Calzada, C. Louis, C. W. Han, V. Ortalan and R. Zanella, Appl. Catal. B, 2020, 264, 118503 CrossRef.
- J. Okal, M. Zawadzki, P. Kraszkiewicz and K. Adamska, Appl. Catal., A, 2018, 549, 161–169 CrossRef CAS.
- M. A. L. Rocha, G. del Ángel, G. Torres-Torres, A. Cervantes, A. Vázquez, A. Arrieta and J. N. Beltramini, Catal. Today, 2015, 250, 145–154 CrossRef CAS.
- A. Cervantes, G. del Angel, G. Torres, G. Lafaye, J. Barbier, J. N. Beltramini, J. G. Cabañas-Moreno and A. Espinosa De Los Monteros, Catal. Today, 2013, 212, 2–9 CrossRef CAS.
- H. Lihui, X. Songhai and L. Honglai, Chin. J. Chem. Eng., 2007, 15, 507–511 CrossRef.
- X. Fang, G. Mark and C. von Sonntag, Ultrason. Sonochem., 1996, 3, 57–63 CrossRef CAS.
- K. Gopakumar, U. R. Kini and S. C. Ashawa, Radiat. Eff., 1977, 32, 199–203 CrossRef CAS.
- J. Peral, J. Casado and J. Doménech, J. Photochem. Photobiol., A, 1988, 44, 209–217 CrossRef CAS.
- Q. Xiao, Z. Si, J. Zhang, C. Xiao and X. Tan, J. Hazard. Mater., 2008, 150, 62–67 CrossRef CAS.
- F. Li and X. Li, Chemosphere, 2002, 48, 1103–1111 CrossRef CAS PubMed.
- C. S. Yang, Y. J. Wang, M. S. Shih, Y. T. Chang and C. C. Hon, Appl. Catal., A, 2009, 364, 182–190 CrossRef CAS.
- R. Baker, E. Prestridge and L. Murrell, J. Catal., 1983, 79, 348–358 CrossRef CAS.
- G. Zhou, F. Wang and R. Shi, J. Catal., 2021, 398, 148–160 CrossRef CAS.
- Z. Chen, L. Liang, H. Yuan, H. Liu, P. Wu, M. Fu, J. Wu, P. Chen, Y. Qiu and D. Ye, Appl. Catal. B, 2021, 298, 120507 CrossRef CAS.
- S. Chenakin and N. Kruse, J. Catal., 2018, 358, 224–236 CrossRef CAS.
- S. A. Ansari, M. M. Khan, M. O. Ansari and M. H. Cho, New J. Chem., 2015, 39, 4708–4715 RSC.
- T. Bhowmik, M. K. Kundu and S. Barman, RSC Adv., 2015, 5, 38760–38773 RSC.
- D. E. Juárez-Cortazar, J. G. Torres-Torres, A. Hernandez-Ramirez, J. C. Arévalo-Pérez, A. Cervantes-Uribe, S. Godavarthi, A. E. E. de los Monteros, A. A. Silahua-Pavón and A. Cordero-Garcia, Water, 2022, 14, 1389 CrossRef.
- Z. Hu, X. Cai, Z. Wang, S. Li, Z. Wang and X. Xie, J. Hazard. Mater., 2019, 380, 120812 CrossRef CAS PubMed.
- I. Cristea, A. Sobetkii, L. A. Constantin, M. A. Constantin and I. Nitoi, Rev. Chim., 2020, 71, 347–355 CrossRef CAS.
- K. Bubacz, E. Kusiak-Nejman, B. Tryba and A. W. Morawski, J. Photochem. Photobiol., A, 2013, 261, 7–11 CrossRef CAS.
| This journal is © The Royal Society of Chemistry 2022 |

