 Open Access Article
Development of nitrile rubber/eucommia ulmoides gum composites for controllable dynamic damping and sound absorption performance
Lin Sua,
Qi Wangb,
Ping Xianga,
Dexian Yin *b,
Xiaodong Dinga,
Li Liub and
Xiuying Zhao*b
aSystems Engineering Research Institute, Beijing, 100094, China
bKey Laboratory of Beijing City on Preparation and Processing of Novel Polymer Materials, Beijing University of Chemical Technology, Beijing, 100029, China. E-mail: yindx96@163.com; zhaoxy@mail.buct.edu.cn
First published on 2nd August 2022
Abstract
Aiming at enhancing the damping and sound absorption performances of nitrile rubber (NBR) incorporated Eucommia ulmoides gum (EUG), a series of NBR/EUG composites were successfully fabricated using an open mixing mill. The co-vulcanization behaviors, fracture surface morphology observations, mechanical and thermal properties and damping and sound absorption performances of NBR/EUG composites were investigated systematically. It was shown that the crystalline area and the amorphous area in NBR/EUG composites displayed a sea-island phase distribution and most of the EUG crystals were β-form crystals. Compared to that of neat NBR, the tensile strength and storage modulus of NBR/EUG composites increased dramatically with the increasing EUG content, owing to the gradually increasing number of crystals in the NBR/EUG composites. In addition, the incorporation of EUG into the NBR matrix distinctly improved the sound absorption performance of NBR/EUG composites. This work is expected to provide a new insight into the fabrication of other composite materials with controllable damping and sound absorption properties.
1 Introduction
As one of the main types of environmental pollution, noise pollution significantly endangers human health, accelerates mechanical breakdown and affects ecological systems.1,2 Specifically speaking, noise pollution not only damages the hearing and influences the sleeping quality of people but also affects the precision and working life of machines.3 Considering the components of turbine machinery such as large compressors and air fans, the problem continues to get worse and needs to be solved urgently. With the development of materials in recent decades, damping materials have become a growing research hotspot owing to the advantages of noise and vibration reduction.4,5 Among them, rubber with its unique viscoelastic property exhibits obvious superiority in the aspect of vibration damping applications because rubber could consume noise and vibration energy as heat energy, which has been applied extensively in transportation equipment, building, aerospace and so on.6,7Acrylonitrile-butadiene rubber, commonly called nitrile rubber (NBR), plays an important role in synthesized rubber fields and has gained considerable attention in damping application fields on account of its remarkable oil and water resistance.8–10 However, under the fast development of industry and society, the damping performance of NBR is not satisfactory, especially under extreme operating conditions.
Eucommia ulmoides gum (EUG), existing in barks, leaves and fruit coatings of Eucommia ulmoides trees, is a natural polymer with double characteristics of plastic and rubber.11 The chemical structure of EUG is trans-1, 4-polyisoprene and the chemical structure of natural rubber (NR) is cis-1, 4-polyisoprene, which displayed isomers of each other.12 Compared with NR, EUG is inclined to crystallization owing to the more regular molecular structure.13 Two crystal forms exist in EUG matrix including α-crystals and β-crystals with different melting points, and EUG owns outstanding damping properties on account of its crystal melting transition.14 In the meantime, EUG possesses a higher modulus than traditional rubber because of the existing crystals, which could resist deformation under extreme operating conditions. A hopeful strategy for obtaining diversified new-type damping elastomers with excellent comprehensive properties could be implemented via blending EUG with other synthetic rubbers.
Herein, a feasible method to fabricate NBR/EUG composites with adjustable modulus and excellent damping properties was proposed by changing the content of EUG. The effects of mixing technology and vulcanization system on the co-vulcanization of NBR and EUG were studied, and different proportions of NBR/EUG composites were prepared by using open mixing mill. The fracture surface morphology, thermal performance, mechanical property as well as damping and sound absorption behaviors of various NBR/EUG composites were systematically investigated, and the correlation between these properties and the special microstructure has been researched in this work. This work may provide a promising strategy for developing other composite materials with outstanding damping and sound absorption properties.
2 Experimental
2.1 Materials
NBR (N220S) with a content of 42% acrylonitrile was supplied by JSR Corporation, Japan. EUG with the number-average molecular weights of 122![[thin space (1/6-em)]](https://www.rsc.org/images/entities/char_2009.gif) 915 and polydispersity index of 2.073 was bought from China Ankang Hanyin Hua Ye Plant Pharmaceutical Co. Ltd. Other experimental materials were bought from common manufacturers in the rubber industry of China.
915 and polydispersity index of 2.073 was bought from China Ankang Hanyin Hua Ye Plant Pharmaceutical Co. Ltd. Other experimental materials were bought from common manufacturers in the rubber industry of China.
2.2 Preparation of various NBR/EUG composites
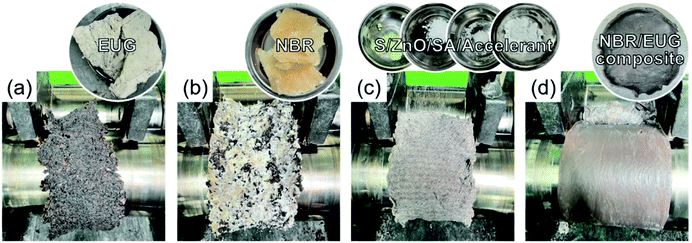
The preparation steps of various NBR/EUG composites were as follows and the corresponding experimental photos were exhibited in Fig. 1. Step 1: EUG was plasticized on a hot open mixing mill for 1 min at 60 °C (Fig. 1a). Step 2: NBR was added into EUG matrix (Fig. 1b). Step 3: S, ZnO, stearic acid (SA) and accelerant were ordinal added for uniform mixing (Fig. 1c). Step 4: the roller spacing was adjusted to the minimum, and triangle bag shape was made six times for better mixing (Fig. 1d). Then, the roller spacing was adjusted to 2 mm and NBR/EUG composites were subsequently fabricated.About 5.0 g of NBR/EUG composites were put into a vulcanizing instrument at a vulcanization temperature of 150 °C and the process positive vulcanization time T90 of NBR/EUG composites was obtained. Then various NBR/EUG composites were fabricated via an electric plate vulcanizing machine for T90 + 2 min at 25 MPa.
2.3 Characterizations
 | (1) |
 | (2) |
3 Results and discussion
3.1 Co-vulcanization behavior of NBR and EUG
Vulcanization of rubber plays a very important role in the comprehensive properties of rubber. Generally speaking, different kinds of rubber display thermodynamics incompatible, and co-vulcanization process is needed to achieve good mechanical performance. NBR is a polar rubber with polar side groups, and EUG exhibits different properties according to different degrees of vulcanization, thus it is very important to select the appropriate formula and process conditions.In this work, five kinds of accelerators commonly used in NBR and EUG processing were selected and showed in Fig. 2. Accelerator TMTD as a type of thiuram accelerator is widely used in NBR vulcanization, because it could give rubber outstanding permanent deformation properties of compression. But the coke safety of thiuram accelerators is froward and the spray frost effect is relatively obvious. Accelerators NS and CZ are kinds of sulfenamide accelerators, it owns the advantages of high activation performance, fast reaction rate and scorch safety. The drawback is that the single use of sulfenamide type accelerators could lead to low crosslinking density of rubber. Accelerator DTDM is also a sulphur donor with the advantages of safe operation, no spray frost and invariant color. However, the vulcanization rate is relatively slow when it used alone. Accelerator D as a part of guanidine accelerator is often utilized as accessory ingredient.
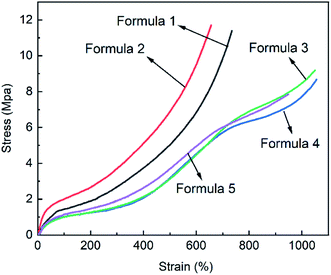
There were two considerations when designing NBR/EUG vulcanization systems. One was that good compatibility of NBR and EUG was required to optimize the overall mechanical properties. The other was that a majority of vulcanizing agents should be distributed in NBR matrix to obtain the optimum mechanical properties of NBR under the vulcanization process, in the meantime, the vulcanization process would not destroy the main crystalline region in EUG matrix. Based on the above analysises, five different vulcanization formulas were designed in this work, which were shown in Table 1. The mechanical properties of NBR/EUG composites with different formulas were displayed in Fig. 3 and Table 2.
| Component (phr) | Formula 1 | Formula 2 | Formula 3 | Formula 4 | Formula 5 |
|---|---|---|---|---|---|
| a Notes: TMTD (tetramethyl thiuram disulfide); NS (N-tertbutyl-2-benzothiazole sulfonamide); CZ (N-cyclohexyl-2-benzothiazole sulfonamide); DTDM (4,4′-dithio-dimorpholine); D (diphenyl guanidine). | |||||
| NBR | 80 | 80 | 80 | 80 | 80 |
| EUG | 20 | 20 | 20 | 20 | 20 |
| ZnO | 5 | 5 | 5 | 5 | 5 |
| SA | 2 | 1 | 2 | 2 | 2 |
| Accelerator TMTD | 0 | 0.2 | 0.2 | 0 | 0 |
| Accelerator NS | 0 | 0 | 0.8 | 1.2 | 0 |
| Accelerator CZ | 0 | 0 | 0 | 0 | 0.8 |
| Accelerator DTDM | 3 | 0 | 0 | 0 | 0 |
| Accelerator D | 1 | 1 | 0 | 0 | 0 |
| S | 2 | 2 | 2.5 | 2.5 | 2.5 |
| Mechanical properties | Formula 1 | Formula 2 | Formula 3 | Formula 4 | Formula 5 |
|---|---|---|---|---|---|
| Tensile strength (MPa) | 11.9 ± 0.3 | 12.3 ± 0.4 | 9.3 ± 0.3 | 8.8 ± 0.1 | 8.2 ± 0.2 |
| Elongation at break (%) | 753 ± 13 | 675 ± 8 | 1114 ± 12 | 1035 ± 15 | 1019 ± 11 |
| 100% elongation stress (MPa) | 1.6 ± 0.3 | 2.0 ± 0.1 | 1.0 ± 0.2 | 1.0 ± 0.1 | 1.2 ± 0.1 |
| 300% elongation stress (MPa) | 2.7 ± 0.2 | 3.6 ± 0.3 | 1.5 ± 0.1 | 1.6 ± 0.1 | 2.0 ± 0.1 |
| Tensile permanent deformation (%) | 20 ± 3 | 19 ± 0 | 62 ± 4 | 51 ± 3 | 55 ± 1 |
| Hardness (Shore A) | 59.8 ± 0.2 | 63.2 ± 0.3 | 48.9 ± 0.1 | 49.8 ± 0.4 | 51.3 ± 0.2 |
It could be found in Fig. 3 and Table 2 that compared to other formulas, formula 2 displayed the highest tensile strength and hardness, in which the accelerators TMTD and D were utilized in this formula. Accelerator TMTD consists of two active groups and two accelerator groups (Fig. 2), in which the active sulfur atoms are precipitated to participate in the vulcanization reaction during the vulcanization process. As a kind of acid accelerator, the distribution coefficient of TMTD in NBR is higher than that of EUG. Accelerator D with relatively slow vulcanizing speed and high operation safety could be dissolved in both NBR and EUG matrix. The combination of accelerator TMTD and D could effectively vulcanize NBR while retaining part of the crystalline region of EUG, so formula 2 was chosen as the final formula to conduct the follow-up experiments. Based on formula 2, various NBR/EUG composites with NBR/EUG ratios of 100/0, 95/5, 90/10, 85/15, 80/20, 70/30, 60/40, 50/50, and 0/100 were fabricated on the hot roll mixer.
3.2 Microstructure observations
The quantitative nanomechanical technique of atomic force microscopy (AFM-QNM), a mature technique for the research of polymer morphology at the sub-nanometer spatial resolution, was utilized to investigate the influence of EUG on the morphology of various NBR/EUG composites. Fig. 4 displayed the AFM images of NBR/EUG composites at different ratios of 95/5, 90/10, 80/20, 70/30, 60/40, and 50/50. The light regions represent the high modulus area and the dark regions represent the low modulus area, and the phase distribution of NBR/EUG composites could be explored through the color distribution. It could be found in Fig. 4 that the light regions represented the EUG phase (with an ellipsoid shape) and the dark regions represented the NBR phase, which showed a “sea-island” phase distribution. As displayed in Fig. 4(a–c), when the amount of EUG was small (lower than 30%), the distribution of EUG phase was uniform and no large aggregation phase formed in NBR/EUG composites. It illustrated that during the processing process, a small quantity of EUG could be uniformly dispersed in the NBR matrix via strong mechanical shear force.15 The EUG phase could reinforce NBR matrix on account of the interface interaction between EUG and NBR as well as the crosslinking network of sulfur. As shown in Fig. 4(d–f), the EUG phase with high Young's modulus aggregated into a larger island phase in the NBR phase when the amount of EUG was high (30% or above) in NBR matrix. Owing to the crystallization effect of EUG, a large amount of EUG in NBR matrix was likely to cause stress concentration, leading to the formation of small cracks at the two-phase interface and the reduction of mechanical properties of NBR/EUG composites.16,17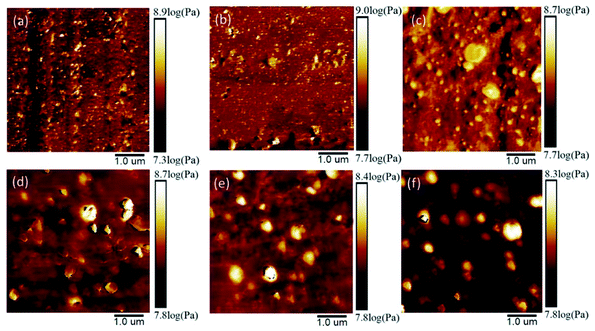 | ||
| Fig. 4 AFM images of various NBR/EUG composites: (a) NBR/EUG = 95/5; (b) NBR/EUG = 90/10; (c) NBR/EUG = 80/20; (d) NBR/EUG = 70/30; (e) NBR/EUG = 60/40; (f) NBR/EUG = 50/50. | ||
The morphologies of polymeric composites strongly influence the properties of composites owing to the interfacial interaction of the two-phase interfaces. Thus, the fractured surface morphologies of various NBR/EUG composites were further investigated by SEM and the relevant photographs were shown in Fig. 5. As displayed in Fig. 5a, the NBR/EUG (95/5) composite presented a relatively smooth surface and a bit of EUG phase could be observed, which was uniformly distributed throughout NBR matrix. However, the size of the spherical EUG phase was visibly increased with the increase of EUG content (Fig. 5(b and c)). Especially, when the addition of EUG was more than 20%, two distinct phases could be found on the surfaces of NBR/EUG composites and the SEM photographs exhibited typical sea-island structures, in which elliptical EUG phase dispersed in continuous NBR matrix. The observations demonstrated that a small amount of EUG content could be uniformly dispersed in NBR matrix. However, with an increasing amount of EUG in NBR/EUG composites, the two-phase interface between NBR and EUG presented a weak interfacial adhesion and poor compatibility because of the crystallization of EUG, resulting in the appearance of stress concentration phenomenon and possibly poor mechanical property of NBR/EUG composites.15
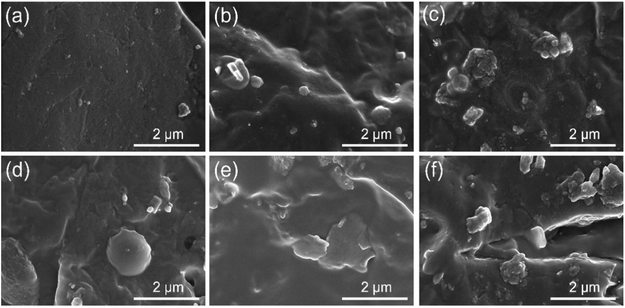 | ||
| Fig. 5 SEM images of various NBR/EUG composites: (a) NBR/EUG = 95/5; (b) NBR/EUG = 90/10; (c) NBR/EUG = 80/20; (d) NBR/EUG = 70/30; (e) NBR/EUG = 60/40; (f) NBR/EUG = 50/50. | ||
3.3 Mechanical properties
The mechanical properties of NBR/EUG composites including Shore hardness, tensile strength, elongation at break, stress at definite elongation (100% and 300%), tensile permanent deformation and stress–strain curves were investigated and exhibited in Fig. 6 and Table 3. In Fig. 6, the Shore hardness of neat NBR was 53A. The addition of EUG to NBR led to considerable enhancement in the Shore hardness of various NBR/EUG composites, which increased from 53A to 83A. The reason was that the existed crystals of EUG in NBR matrix displayed a relatively high Shore hardness, which observably enhanced the Shore hardness of NBR/EUG composites.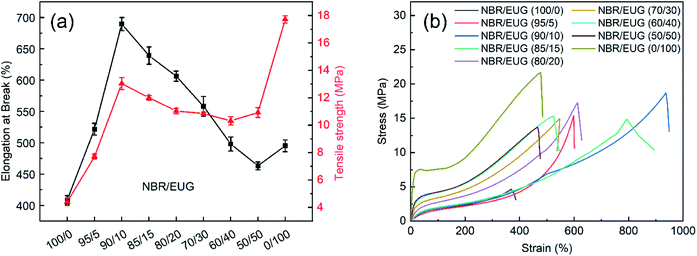 | ||
| Fig. 6 Mechanical properties of various NBR/EUG composites: (a) elongation at break and tensile strength; (b) stress–strain curves. | ||
| Mechanical properties | NBR/EUG | ||||||||
|---|---|---|---|---|---|---|---|---|---|
| 100/0 | 95/5 | 90/10 | 85/15 | 80/20 | 70/30 | 60/40 | 50/50 | 0/100 | |
| Tensile strength (MPa) | 4.4 ± 0.3 | 7.7 ± 0.2 | 13.0 ± 0.4 | 12.0 ± 0.2 | 11.0 ± 0.2 | 10.8 ± 0.1 | 10.3 ± 0.3 | 10.9 ± 0.4 | 17.7 ± 0.3 |
| Elongation at break (%) | 409 ± 7 | 522 ± 10 | 689 ± 11 | 639 ± 14 | 606 ± 8 | 558 ± 16 | 498 ± 11 | 463 ± 6 | 495 ± 10 |
| 100% elongation stress (MPa) | 1.2 ± 0.1 | 1.3 ± 0.2 | 1.5 ± 0.2 | 1.7 ± 0.1 | 2.2 ± 0.1 | 2.7 ± 0.0 | 3.1 ± 0.1 | 3.5 ± 0.1 | 5.8 ± 0.1 |
| 300% elongation stress (MPa) | 2.5 ± 0.1 | 2.4 ± 0.1 | 2.6 ± 0.1 | 3.0 ± 0.3 | 4.2 ± 0.3 | 5.0 ± 0.1 | 5.9 ± 0.1 | 6.7 ± 0.3 | 10.7 ± 0.2 |
| Tensile permanent deformation (%) | 0 ± 0 | 0 ± 0 | 4 ± 1 | 12 ± 0 | 12 ± 1 | 28 ± 1 | 28 ± 0 | 40 ± 0 | 88 ± 1 |
| Hardness (Shore A) | 53 ± 1 | 54 ± 2 | 57 ± 1 | 59 ± 2 | 62 ± 0 | 70 ± 0 | 75 ± 2 | 79 ± 1 | 83 ± 2 |
As shown in Fig. 6 and Table 3, the tensile strength and elongation at break of NBR/EUG composites improved from 4.4 to 13.0 MPa and from 409% to 689%, respectively, with increasing EUG content from 0% to 10%. With EUG content in NBR matrix of more than 10%, the tensile strength and elongation at break of NBR/EUG composites decreased, which were still higher than those of NBR. It was because a small amount of EUG content dispersing in NBR matrix could be acted as physical intersection points, leading to the increase of the mechanical properties of NBR/EUG composites.18,19 Nevertheless, a large amount of EUG caused the formation of large size crystals in NBR matrix, leading to stress concentration and formation of small cracks at the two-phase interface as well as the reduction of mechanical properties of NBR/EUG composites, which could be observed in AFM and SEM photographs (in Fig. 4 and 5). Hence, the tensile strength and elongation at break of NBR/EUG composites first increased to their optimal value and then decreased gradually with EUG content increased from 0% to 50%, and the NBR/EUG (90/10) composite displayed maximum tensile strength and elongation at break values among these NBR/EUG composites. Moreover, owing to the particular rubber-plastic character of EUG, various NBR/EUG composites changed from elastic rubber materials to tough plastic materials (in Fig. 6b) and the stress at definite elongation (100% and 300%) increased gradually (in Table 3) with the increasing content of EUG in NBR matrix.
3.4 Damping properties
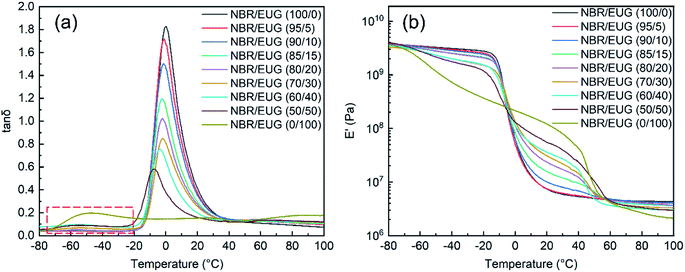
DMA was utilized to investigate the dynamic response of various NBR/EUG composites and Fig. 7 displayed the temperature dependence of loss factor (tan![[thin space (1/6-em)]](https://www.rsc.org/images/entities/char_2009.gif) δ) and storage modulus (E′) for the composites.
δ) and storage modulus (E′) for the composites.
Tan![[thin space (1/6-em)]](https://www.rsc.org/images/entities/char_2009.gif) δ curve, the ratio of loss modulus/E′, was regarded as a measurement of material damping ability (i.e., dissipation of vibration energy) and the glass transition temperature (Tg) of materials could be obtained by the maximum value of tan
δ curve, the ratio of loss modulus/E′, was regarded as a measurement of material damping ability (i.e., dissipation of vibration energy) and the glass transition temperature (Tg) of materials could be obtained by the maximum value of tan![[thin space (1/6-em)]](https://www.rsc.org/images/entities/char_2009.gif) δ curves. As exhibited in Fig. 7a, the tan
δ curves. As exhibited in Fig. 7a, the tan![[thin space (1/6-em)]](https://www.rsc.org/images/entities/char_2009.gif) δ of NBR/EUG composites displayed a maximum value at the temperature of around 0 °C, and another peak could be seen at around −50 °C because of the glass transition behavior of EUG.20 With the increasing content of EUG from 0% to 50%, the Tg of NBR/EUG composites decreased gradually and shifted to a lower temperature, in the meantime, the tan
δ of NBR/EUG composites displayed a maximum value at the temperature of around 0 °C, and another peak could be seen at around −50 °C because of the glass transition behavior of EUG.20 With the increasing content of EUG from 0% to 50%, the Tg of NBR/EUG composites decreased gradually and shifted to a lower temperature, in the meantime, the tan![[thin space (1/6-em)]](https://www.rsc.org/images/entities/char_2009.gif) δ curves of various NBR/EUG composites changed from a single peak to double peaks (in red frame of Fig. 7a), especially in the tan
δ curves of various NBR/EUG composites changed from a single peak to double peaks (in red frame of Fig. 7a), especially in the tan![[thin space (1/6-em)]](https://www.rsc.org/images/entities/char_2009.gif) δ curves of NBR/EUG (60/40) composite, NBR/EUG (50/50) composite and NBR/EUG (0/100) composite. The appearance of double peak phenomena suggested that the compatibility of NBR and EUG phases in NBR/EUG composites decreased with the increase of EUG content.19,21
δ curves of NBR/EUG (60/40) composite, NBR/EUG (50/50) composite and NBR/EUG (0/100) composite. The appearance of double peak phenomena suggested that the compatibility of NBR and EUG phases in NBR/EUG composites decreased with the increase of EUG content.19,21
The E′ of various NBR/EUG composites were shown in Fig. 7b. As could be seen from Fig. 7b, the E′ of all NBR/EUG composites underwent two transformations, corresponding to the glass transition of NBR and the crystal melting of EUG respectively. Increasing the content of EUG, a successive increase of E′ values could be observed in various NBR/EUG composites between −20 °C to 50 °C. The reason was that EUG could crystallize in this temperature range, which significantly improved the E′ of NBR/EUG composites.15,18,22 With further increasing the temperature (above 50 °C), EUG crystals reached their melting temperature and displayed amorphous conditions, which led to a sharp decrease of E′ in NBR/EUG composites. The results indicated that the E′ of NBR/EUG composites could be effectively regulated by changing the content of EUG in the composites.
3.5 Crystallization and melting properties
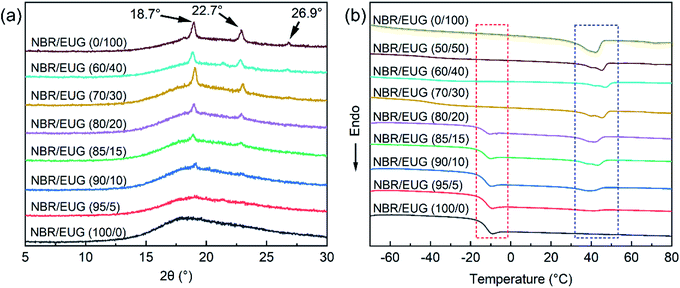
XRD was carried out to evaluate the crystallization performances of various NBR/EUG composites with different contents of EUG, and Fig. 8a exhibited the relevant XRD curves. It was found in Fig. 8a that no diffraction peak appeared in NBR/EUG (100/0) composite owing to the noncrystalline structure of pure NBR. When a small amount of EUG (10 phr) incorporated in NBR, two diffraction peaks started to appear near 18.7° and 22.7°, as displayed in the XRD curve of NBR/EUG (90/10) composite. With the content of EUG increasing from 10 to 100 phr, another diffraction peak at around 26.9° was observed in the XRD curve of NBR/EUG (70/30) composite and the intensity of the aforementioned three diffraction peaks gradually increased, which was pretty obvious in the XRD curve of NBR/EUG (0/100) composite. The appearance of these diffraction peaks was attributed to the existing crystals of EUG (containing α- and β-form crystalline structures) in NBR matrix, in which the peak of the α-form crystalline structure of EUG was at 22.7° and the peaks of the β-form crystalline structure of EUG were at 18.7° and 22.7°.23,24 Notably, the diffraction peak at 22.7° displayed a low intensity while the diffraction peaks at 18.7° and 22.7° showed a relatively high intensity among all NBR/EUG composites, which indicated that most of the EUG crystals in NBR/EUG composites were β-form crystals.25,26 Different temperatures facilitated the formation of α and β crystals during the isothermal crystallization of EUG, in which α crystal displayed a thermodynamic stable form and β crystal showed a metastable form. Thus, β crystals were produced easily at a fast cooling rate during the non-isothermal crystallization of EUG.27In addition, the size of the EUG crystals in NBR/EUG composites could be calculated from the XRD data via the Scherrer formula. The average crystal size of EUG determined from the diffraction peaks of 18.7°, 22.7° and 26.9° was shown in Table 4, in which the data with a large error calculated by the Scherrer formula was eliminated. As listed in Table 4, all EUG crystal sizes existed in the scope of 1 to 32 nm, indicating that the agglomeration phenomenon of EUG crystals did not occur in NBR/EUG composites. Meanwhile, it could be found in Table 4 that the χc of various NBR/EUG composites increased with the increase of EUG content.
| Crystallization properties | NBR/EUG | ||||||||
|---|---|---|---|---|---|---|---|---|---|
| 100/0 | 95/5 | 90/10 | 85/15 | 80/20 | 70/30 | 60/40 | 50/50 | 0/100 | |
| Average crystal size (18.7°) (nm) | — | — | — | 8.3 | 7.0 | 14.8 | 23.6 | 22.4 | 21.4 |
| Average crystal size (22.7°) (nm) | — | — | — | 1.6 | 2.9 | 16.5 | 29.7 | 20.7 | 23.9 |
| Average crystal size (26.9°) (nm) | — | — | — | — | — | 23.7 | 31.8 | 30.0 | 31.8 |
| χc (%) | — | — | — | 4.22 | 4.96 | 5.93 | 7.21 | 7.77 | 6.62 |
To further investigate the crystallization performances of various NBR/EUG composites, DSC was employed and the related DSC graph was given in Fig. 8b. According to the DSC results, the curve of pure NBR showed an obvious glass transition peak at about 14 °C. With the increase of EUG content, the glass transition peak became less obvious until it disappeared (in red frame of Fig. 8b), ascribing to the following two reasons. On one hand, the incorporation of EUG increased the number of crystals in NBR matrix, limiting the movement and rearrangement of chain segments during the glass transition region.28–30 On the other hand, increasing EUG content in NBR/EUG composites signified the reduction of the proportion of NBR content. Moreover, with the increase of EUG content, the melting peak of various NBR/EUG composites appeared gradually and the melting peak area was getting larger and larger (in blue frame of Fig. 8b), indicating the crystallization performances of the fabricated NBR/EUG composites were able to change by adjusting the content of EUG in NBR matrix.17
3.6 Sound absorption performances
Effects of EUG content, water pressure and frequency of various NBR/EUG composites on the change of SAC with the frequency of sound wave were exhibited in Fig. 9. It showed that all curves fluctuated within a narrow range owing to the resonant absorption of sound.31,32 In addition, the SAC data of various NBR/EUG composites fluctuated greatly and the rule of curve variation was not obvious under the water pressure of 1.0 MPa, which might be the instability of the test instrument.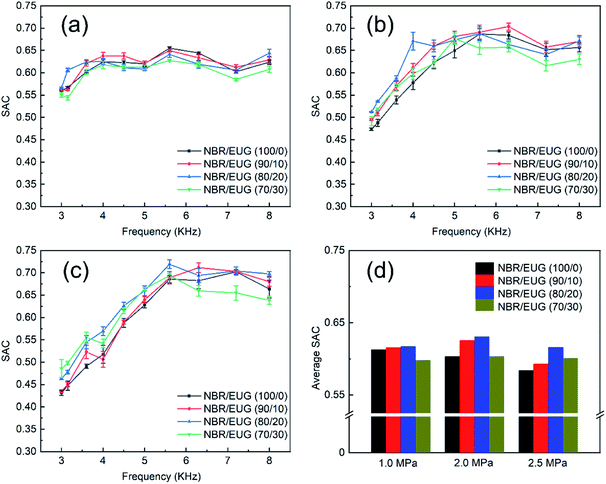 | ||
| Fig. 9 SAC of various NBR/EUG composites under different pressures ((a) 1.0 MPa; (b) 2.0 MPa; (c) 2.5 MPa) and (d) average SAC. | ||
In Fig. 9, the SAC of NBR/EUG composites distinct improved with the increase of frequency, attributing to that high frequency means short wavelength and comparatively weak penetrating power. It also could be seen from Fig. 9 that the SAC of NBR/EUG composites increased with the increasing EUG content from 0% to 20%, which was obviously regular under high-pressure conditions (e.g., 2.0 or 2.5 MPa). The reason should be attributed to two aspects. One is that the incorporated EUG crystals enhanced the modulus of NBR/EUG composites, which increased the propagation speeds of sonic waves and improved the impedance matching between the composites and water.14,31,33 The other is that the sound impedance of the crystals in NBR/EUG composites mismatched that of water, and thus the incident sound wave reflection happened and reflected many times when it met the crystals.15 As a result, the propagation path of sound waves was changed and increased, leading to the enhancement of the sound energy dissipation. However, the SAC slightly decreased when EUG content further increased, due to that the excess crystals in NBR/EUG composites would hinder the movement of molecular chains and thus affect there damping performances as well as the sound energy dissipation.
4 Conclusions
In this paper, various NBR/EUG composites with controllable damping and sound absorption performances were successfully fabricated. AFM and SEM observations stated that various NBR/EUG composites displayed a distinct sea-island phase distribution. XRD and DSC results illustrated that with the increasing of EUG content, the χc of various NBR/EUG composites gradually improved and most of the EUG crystals exhibited β-form crystals. Additionally, the tensile strength and E′ of NBR/EUG composites increased dramatically with the increasing EUG content. Particularly, the tensile strength of NBR/EUG composites improved from 4.4 to 13.0 MPa and the elongation at break increased from 409% to 689%, respectively, with increasing EUG content from 0% to 10%. Meanwhile, the incorporation of EUG obviously improved the sound absorption performances of various NBR/EUG composites. This study offered a new insight into the preparation of composite materials with controllable damping and sound absorption properties.Author contributions
Writing – original draft preparation: Lin Su and Qi Wang; Writing – review & editing: Dexian Yin and Xiuying Zhao; Investigation, Ping Xiang, Xiaodong Ding and Li Liu; Methodology and Supervision: Xiuying Zhao; All authors have read and agreed to the published version of the manuscript.Conflicts of interest
There are no conflicts to declare.Acknowledgements
This research was funded by National Key Research and Development Program of China, grant number 2017YFB0306904.References
- S. A. Baghban, M. Khorasani and G. M. M. Sadeghi, J. Polym. Res., 2020, 27, 62 CrossRef CAS.
- A. Joy, S. Varughese, S. Shanmugam and P. Haridoss, ACS Appl. Nano Mater., 2019, 2, 736–743 CrossRef CAS.
- X. Q. Jia, S. Y. Li, H. J. Miu, T. Yang, K. Rao, D. Y. Wu, B. L. Cui, J. L. Ou and Z. C. Zhu, Front. Chem., 2020, 8, 683 CrossRef CAS PubMed.
- X. Wang, X. Chen, M. Song, Q. Wang, W. Zheng, H. Song, Z. Fan and A. Myat Thu, Ind. Eng. Chem. Res., 2020, 59, 11494–11504 CrossRef CAS.
- I. C. Tsimouri, S. Montibeller, L. Kern, P. J. Hine, R. Spolenak, A. A. Gusev and S. Danzi, Compos. Sci. Technol., 2021, 208, 108744 CrossRef.
- C. Liu, J. Fan and Y. Chen, Polym. Test., 2019, 79, 106003 CrossRef.
- F. Zhang, M. Guo, K. Xu, G. He, H. Wu and S. Guo, Compos. Sci. Technol., 2014, 101, 167–172 CrossRef CAS.
- C. Qu, S. Li, Y. Zhang, T. Wang, Q. Wang and S. Chen, Tribol. Int., 2021, 163, 107150 CrossRef CAS.
- T. Li, S. Chen, S. Wan, S. Cai and X. He, Polym. Compos., 2020, 41, 1867–1877 CrossRef CAS.
- N. Ning, X. Li, H. Tian, Y. Hua, H. Zuo, P. Yao, L. Zhang, Y. Wu, G.-H. Hu and M. Tian, RSC Adv., 2017, 7, 5451–5458 RSC.
- L. Xia, Y. Wang, Z. Ma, A. Du, G. Qiu and Z. Xin, Polym. Adv. Technol., 2017, 28, 94–101 CrossRef CAS.
- G. Liu, X. Zhang, T. Zhang, J. Zhang, P. Zhang and W. Wang, Polym. Test., 2017, 63, 582–586 CrossRef CAS.
- X. Wei, P. Peng, F. Peng and J. Dong, J. Agric. Food Chem., 2021, 69, 3797–3821 CrossRef CAS PubMed.
- Y. Dong, D. Yin, L. Deng, R. Cao, S. Hu, X. Zhao and L. Liu, Materials, 2021, 14, 7487 CrossRef CAS PubMed.
- R. Cao, L. Deng, Z. Feng, X. Zhao, X. Li and L. Zhang, Polymer, 2021, 213, 123292 CrossRef CAS.
- H. Kang, L. Yao, Y. Li, X. Hu, F. Yang, Q. Fang and L. Zhang, J. Appl. Polym. Sci., 2018, 135, 46017 CrossRef.
- Q. Fang, X. Jin, F. Yang, C. Ma, Y. Gao and N. Wang, Polym. Bull., 2015, 73, 357–367 CrossRef.
- M. Dong, T. Zhang, J. Zhang, G. Hou, M. Yu and L. Liu, Polym. Test., 2020, 87, 106539 CrossRef CAS.
- X. Zong, S. Wang, N. Li, H. Li, X. Zhang and A. He, Polymer, 2021, 213, 123325 CrossRef CAS.
- J. Zhang, Z. Xue and R. Yan, Chin. J. Polym. Sci., 2010, 29, 157–163 CrossRef.
- J. Zhang and Z. Xue, Polym. Bull., 2011, 67, 511–525 CrossRef CAS.
- Sarina, J. Zhang and L. Zhang, Polym. Bull., 2012, 68, 2021–2032 CrossRef CAS.
- Q. Sun, X. Zhao, D. Wang, J. Dong, D. She and P. Peng, Carbohydr. Polym., 2018, 181, 825–832 CrossRef CAS PubMed.
- X. Qi, F. Xie, J. Zhang, L. Zhang and D. Yue, RSC Adv., 2019, 9, 42367–42374 RSC.
- H. Nie, H. Ren, X. Han and A. He, Polym. Test., 2019, 80, 106120 CrossRef CAS.
- K. Yao, H. Nie, Y. Liang, D. Qiu and A. He, Polymer, 2015, 80, 259–264 CrossRef CAS.
- Y. Wu, K. Yao, H. Nie and A. He, Polymer, 2018, 153, 271–276 CrossRef CAS.
- J. Zhang and Z. Xue, Polym. Test., 2011, 30, 753–759 CrossRef.
- D. Yin, J. Mi, H. Zhou, X. Wang and K. Yu, J. Appl. Polym. Sci., 2020, 137, 48850 CrossRef CAS.
- D. Yin, J. Mi, H. Zhou, X. Wang and H. Tian, Carbohydr. Polym., 2020, 247, 116708 CrossRef CAS PubMed.
- K. Shi, G. Jin, R. Liu, T. Ye and Y. Xue, Results Phys., 2019, 12, 132–142 CrossRef.
- G. Cheng, D. HE and G. Shu, Colloids Surf., A, 2001, 179, 191–194 CrossRef CAS.
- I. I. Kabir, Y. Fu, N. De Souza, J. C. Baena, A. C. Y. Yuen, W. Yang, J. Mata, Z. Peng and G. H. Yeoh, J. Mater. Sci., 2020, 55, 5048–5063 CrossRef CAS.
| This journal is © The Royal Society of Chemistry 2022 |

