 Open Access Article
Creative Commons Attribution 3.0 Unported Licence
Investigation of crystal field effects for the spectral broadening of Yb3+-doped LuxY2−xO3 sesquioxide crystals†
Ruiqi Guoa,
Dapeng Huanga,
Dazhi Lu *a,
Fei Liang
 a,
Qingli Zhang*b,
Haohai Yua and
Huaijin Zhanga
aState Key Laboratory of Crystal Materials and Institute of Crystal Materials, Shandong University, Jinan 250100, China. E-mail: dazhi.lu@sdu.edu.cn
bAnhui Institute of Optics and Fine Mechanics, Chinese Academy of Sciences, Hefei 230031, China. E-mail: zql@aiofm.ac.cn
First published on 12th August 2022
Abstract
The investigation of crystal field effects is significant for elucidating the spectral characteristics of Yb3+-doped sesquioxide crystals for ultrafast laser generation. The narrow spectra of Yb3+-doped single sesquioxide crystals limit the generation of ultrafast lasers; in this study, the Y3+ ions were introduced into Lu2O3 single crystals by the employment of ion replacement to broaden the spectra. To analyze the spectral broadening, the responsible crystal field parameters (CFPs) were calculated. The conversion of the host dominant ion and the distortion of the ligand affected the values and signs of the CFPs, and further determined the energy level splitting and fluorescence spectra. A linear relationship expressed by the semi-empirical equations for Yb3+-doped sesquioxide crystals was produced, which could be used for high throughput spectral prediction. Opposite variations of high- and low-frequency vibrational energies and the influence of the electron–phonon coupling on the spectra were also achieved. The redshift from the crystal field and the blueshift from the electron–phonon coupling make the optimal spectral broadening appear when x = 1.19 in the Yb:LuxY2−xO3 crystals. The results of these analyses could provide some key clues for the development of Yb3+-doped crystals for the generation and amplification of ultrafast lasers.
Introduction
The crystal field theory, which describes how the crystal field influences active ions, has been used to analyze the relationship between the spectroscopic characteristics and the crystallographic structure of laser gain materials.1–4 The investigation of crystal field effects is demanded for Yb3+-based laser gain materials for a 1 μm emission, owing to the fact that energy level distributions are sensitive to crystal field interactions. The weaker shielding effect of outer 5s25p6 for 4f13 shell electrons in Yb3+ ions enhances the effect of the crystal field compared with other lanthanide ions.5 A main feature of Yb3+-based lasers is their quasi-three-level operating scheme, in which the fundamental and terminal laser levels belong to the same ground-state manifold. In order to limit the thermal population of the terminal laser level for highly efficient laser generation, a large energy level splitting is required.6,7 It can be realized in Yb3+-doped cubic sesquioxide (Re2O3, Re = Lu, Y, and Sc) through providing a strong crystal field in comparison with various Yb3+-doped materials.8,9The adequate spectroscopic and thermal capabilities possessed by Yb3+-doped cubic sesquioxides facilitate their application in ultrafast laser operations.10–12 The Yb:Lu2O3 thin-disk laser (TDL) generated a pulse width of 96 fs with the highest average output power of 21.1 W in the sub-100 fs regime.13 However, the insufficient spectral width of Yb3+-doped pure sesquioxide (e.g. Yb:Lu2O3: ∼13 nm, Yb:Sc2O3: ∼12 nm, Yb:Y2O3: ∼14 nm)14 limits the development of ultrashort pulse generation. The Yb3+-doped sesquioxide solid solutions formed by host mixing are effective for broadening the emission spectra and obtaining short pulse widths.15–20 C. J. Saraceno et al. used Yb:Lu2O3 with a full width at half maximum (FWHM) emission spectrum of 13 nm and the mixed sesquioxide Yb:LuScO3 with an FWHM of 22 nm to generate ultrashort pulses, and achieved shortened pulse durations from 142 fs to 96 fs.14,21,22 Compared with the Sc3+ ions, the presence of Y3+ ions in Yb:Lu2O3 largely retains the thermal characteristic, which is the best among these Yb3+-doped sesquioxide solid solutions.23,24 In our previous study, a ligand engineering strategy was used to disorder coordination in the Yb:LuxY2−xO3 crystal system and ultimately realized spectrum broadening.25 Furthermore, crystal field computations and analyses of Yb3+-doped sesquioxides are required for investigating the varying regularity of CFPs in the solid solutions and the mechanism of spectral broadening.
In this study, further analysis was conducted based on the results of the previous experimental research in the Yb:LuxY2−xO3 crystal system.25 The energy level sequence of Yb3+ ions in the coordinate environment was obtained from the decomposed fluorescence and absorption spectra. The CFPs were fitted with reference to the gained energy levels, and the crystal field strength and its influence on the energy level splitting and overall spectral broadening were analyzed. Meanwhile, the semi-empirical equations were obtained to predict the energy level splitting from the component of the solid solution. Furthermore, the vibrational modes obtained from Raman spectroscopy and calculated by first principles were used to analyze their influences on electron–phonon coupling and the spectral broadening mechanism. This study can serve as a basis for a deeper understanding of the crystal field effects as well as for further research on ultrafast laser gain crystal materials.
Experimental section
The 1 at% Yb:LuxY2−xO3 (x = 0, 0.79, 0.99, 1.19, 1.39, 2) series crystals had been grown using the optical floating zone (OFZ) method.25 The fluorescence and absorption spectra of the crystals were measured at room temperature (∼25 °C) using a fluorescence spectrometer (FLS920, Edinburgh Instruments) excited at 900 nm and an ultraviolet-visible/near-infrared region spectrophotometer (UH4150, Hitachi), respectively. The observed energy levels of Yb3+ ions in LuxY2−xO3 crystals were obtained from the decomposed fluorescence and absorption spectra. The Raman spectra of the crystals were collected by a Raman spectrometer system (LABRAM HR-800, Horiba) excited with a 532 nm solid-state laser.Programs for superposition model fitting (SMFit) and crystal field parameter fitting (CFPFit)26,27 were executed to obtain the phenomenological CFPs in the Yb3+-doped sesquioxide crystal system. Two fitting steps were performed: first, the SMFit program28 was run to obtain the intrinsic CFPs Bk and initial CFPs Bkq(0) using the lattice parameters and observed energy levels. Second, the obtained Bkq(0) were substituted into the CFPFit program as the initial values, and the final CFPs Bkq were fitted based on the observed energy levels using a numerical iteration method. The phonon state densities of the Lu2O3 and Y2O3 crystals were calculated using first principles based on the density functional theory,29 and the generalized gradient approximation with Perdew–Burke–Ernzerhof30 was used to describe the exchange–correlation function. The linear response method was used in the phonon calculations, and the norm-conserving method was selected as the pseudopotential.
Results and discussion
Based on the X-ray diffraction results of the grown crystals, all components of the 1 at% Yb:LuxY2−xO3 (x = 0, 0.79, 0.99, 1.19, 1.39, and 2) crystals exhibited the same crystallographic structure, and their point and space groups were m![[3 with combining macron]](https://www.rsc.org/images/entities/char_0033_0304.gif) and Ia
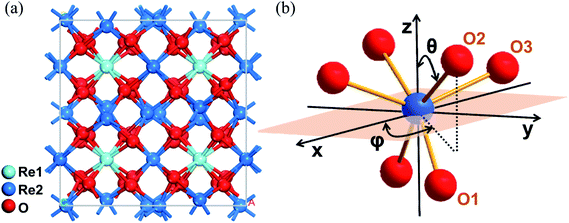
and Ia![[3 with combining macron]](https://www.rsc.org/images/entities/char_0033_0304.gif) .25 Their lattice parameters are list in Table S1.† As shown in Fig. 1(a), two cationic sites were found in the crystallographic structure, namely the centrosymmetric C3i site denoted as Re1, and the non-centrosymmetric C2 site denoted as Re2. The Yb3+ ions occupied both cationic sites when incorporated into the crystal. Because the fluorescence was mainly derived from the electric dipole transition of Yb3+ ions at the non-centrosymmetric Re2-site,31 and the number of Re2 sites was larger than that of Re1, the cations at the Re2-site were the focus of this study. As shown in Fig. 1(b), distorted octahedron coordination was formed by the Re2-site central cation and its surrounding six oxygen ions. These oxygen ions were classified as three pairs according to the different Re–O bond lengths.
.25 Their lattice parameters are list in Table S1.† As shown in Fig. 1(a), two cationic sites were found in the crystallographic structure, namely the centrosymmetric C3i site denoted as Re1, and the non-centrosymmetric C2 site denoted as Re2. The Yb3+ ions occupied both cationic sites when incorporated into the crystal. Because the fluorescence was mainly derived from the electric dipole transition of Yb3+ ions at the non-centrosymmetric Re2-site,31 and the number of Re2 sites was larger than that of Re1, the cations at the Re2-site were the focus of this study. As shown in Fig. 1(b), distorted octahedron coordination was formed by the Re2-site central cation and its surrounding six oxygen ions. These oxygen ions were classified as three pairs according to the different Re–O bond lengths.
The 4f13 shell electrons of Yb3+ ion split into two manifolds under the crystal field effect when the Yb3+ ion is doped into the sesquioxide crystals: the ground state 2F7/2 with four Stark splitting energy levels, and the excited state 2F5/2 with three Stark splitting energy levels.32 The seven energy levels of each component of the Yb:LuxY2−xO3 (x = 0, 0.79, 0.99, 1.19, 1.39, and 2) crystals were derived according to the peak positions of the experimental fluorescence and absorption spectra. Additionally, these energy levels were used as reference values for the subsequent energy-level fitting.
In the Yb3+-doped sesquioxide system, the Hamiltonian is expressed as follows:33
 | (1) |
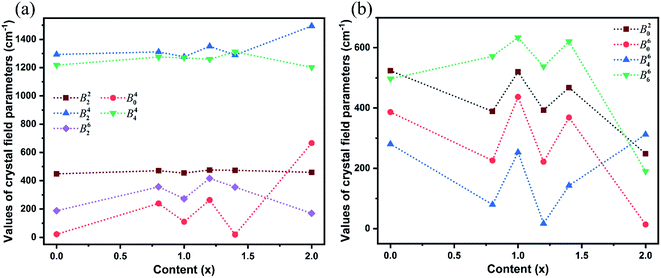
The SMFit program was developed based on the superposition model,28 which reduced the number of initial parameters and simplified the fitting calculation. For the sites occupied by Yb3+ ions with C2 symmetry, three intrinsic CFPs Bk (k = 2, 4, and 6) were considered. Additionally, there were fifteen mutually independent parameters in the plural Bkq, where k = 2, 4, and 6, and q was an even integer in the range of −k ≤ q ≤ k. The intrinsic CFPs Bk obtained using SMFit are listed in Table 1. The CFPs Bkq(0), which were used as the initial parameters of CFPFit, are listed in Table S2.† For each Bkq(0) with specific k and q values, the signs were the same for different x values, indicating that the influence of the coordination structure on the parameter signs was consistent. The CFPs Bkq obtained from the CFPFit are listed in Table 2, the corresponding experimental and calculated energy levels are listed in Table S3,† and the trends of the Bkq values with respect to the host mixing contents x are shown in Fig. 2. The fitting precision indices R and σ improved significantly after CFPFit, indicating the effectiveness of a two-step calculation. The parameter values of B42 and B44 were the largest, which suggested that they played a major role among the CFPs. The parameter values fluctuated with respect to x. As shown in Fig. 2(a), the local minimum values of each parameter were obtained at x = 0.99, which were the opposite of the trends shown in Fig. 2(b). The dominant ion converted at the point of x = 0.99 between Lu3+ and Y3+ ions in the matrix crystals, which induced the singularity of the CFPs at this component, and resulted in two opposite trends of crystal field effects.
| x | B2 (cm−1) | B4 (cm−1) | B6 (cm−1) | R (%) | σ (cm−1) |
|---|---|---|---|---|---|
| 0 | 992.73 | 875.51 | 333.45 | 0.1277 | 11.0843 |
| 0.79 | 1233.03 | 837.98 | 419.01 | 0.1256 | 10.9158 |
| 0.99 | 1119.73 | 863.38 | 437.74 | 0.1452 | 12.6221 |
| 1.19 | 1398.19 | 826.43 | 472.72 | 0.1174 | 10.2113 |
| 1.39 | 1166.23 | 869.37 | 448.64 | 0.1402 | 12.1989 |
| 2.00 | 1081.99 | 892.62 | 456.72 | 0.0923 | 8.0373 |
| x | ζ | B20 | B22 | B40 | B42 |
|---|---|---|---|---|---|
| 0 | 2889.37 | 523.47 | 123.4 + 431.15i | −21.37 | −170.7 + 1282.18i |
| 0.79 | 2889.65 | 388.88 | −0.19 + 470.88i | −239.22 | −127.29 + 1305.43i |
| 0.99 | 2888.16 | 520.05 | −26.63 + 453.72i | 109.85 | −118.72 + 1271.2i |
| 1.19 | 2889.69 | 392.91 | −5.56 + 475.47i | −263.97 | −153.27 + 1342.5i |
| 1.39 | 2888.45 | 467.58 | −9.05 + 473.44i | 18.95 | −160.35 + 1279.35i |
| 2.00 | 2887.11 | 248.09 | 66.61 + 454.69i | −665.65 | −119.32 + 1490.08i |
| x | B44 | B60 | B62 | B64 | B66 |
|---|---|---|---|---|---|
| 0 | −1215.55 − 71.85i | 386.23 | −7.94 + 187.61i | 278.54 + 32.82i | 99.49 − 486.88i |
| 0.79 | −1268.99 − 123.78i | 225.86 | −335.09 + 123.66i | 77.67 + 17.48i | −223.38 − 526.06i |
| 0.99 | −1264.93 − 109.76i | 436.56 | −159 + 221.45i | 251.77 + 24.43i | 40.59 − 632.21i |
| 1.19 | −1256.2 − 86.48i | 221.57 | −385.67 + 157.54i | −0.21 − 17.12i | −300.11 − 445.98i |
| 1.39 | −1308.91 − 88.54i | 368.24 | −254.76 + 247.19i | 140.11 + 27.49i | −18.54 − 620.37i |
| 2.00 | −1187.26 − 188.92i | −13.95 | −151.77 − 75.38i | −310.94 + 25.96i | −185.93 − 39.5i |
It was imperative to understand the variation in the parameter signs. Based on a comparison of the Bkq signs of all x values before and after the CFPFit calculation, as shown in Tables S2† and 2, the real and imaginary parts of B44 remained negative, and the imaginary parts of B22 and B42 remained positive. Several signs significantly varied, such as that of B20, which changed from negative to positive, whereas the signs of the real parts of B42 and B62 changed from positive to negative. The point charge electrostatic model (PCEM) was considered as a potential method for parsing the relationship between structures and signs. The expression for the Bkq parameters in the PCEM contains a summation over discrete point charges situated at the positions of the ligands:33
 | (2) |
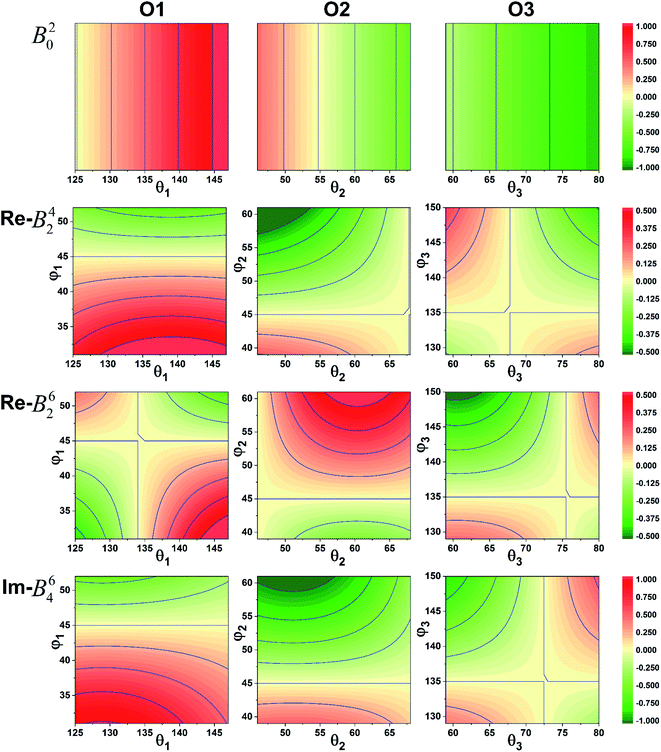 | ||
| Fig. 3 Sign variation of the CFPs with respect to the coordination ion angle θL and φL (red: positive, green: negative). | ||
The crystal field strength parameter Nν is a simplified description of the crystal field and is expressed as follows:33
 | (3) |
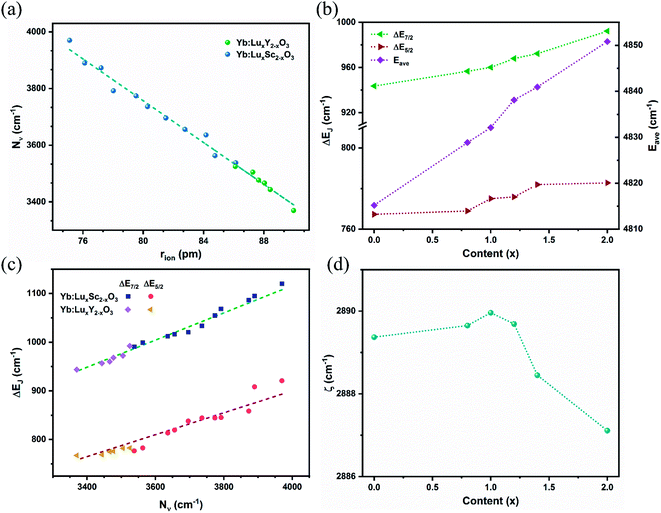
The calculated crystal field strengths of the Yb:LuxY2−xO3 crystal series are shown in Fig. 4(a). The ionic radii of Yb3+ [r(Yb3+) = 86.8 pm], Lu3+ [r(Lu3+) = 86.1 pm], and Y3+ [r(Y3+) = 90 pm] (ref. 34 and 35) were different, and the total cationic radius (rion) varied with respect to the mixing content x of the host crystal. Given that r(Y3+) > r(Lu3+), rion gradually increased as x gradually decreased, as shown in Fig. 4(a); Nν was negatively correlated with rion. The dashed line in Fig. 4(a) is the crystal field strength line fitted by the Yb:LuxSc2−xO3 crystal series,36 which is expressed as follows.
| Nυ (cm−1) = 6707.42 − 36.88rion (pm) | (4) |
The relationship between the two crystal series was consistent, and the semi-empirical formula is suitable for various Yb3+-doped cubic sesquioxide crystal systems.
Stark splitting occurs at the Yb3+ ion energy levels under the influence of the crystal field.5 The differences in the split energy levels of the ground state (ΔE7/2) and the excited state (ΔE5/2) are shown in Fig. 4(b). With an increase in x and the crystal field strength, the extent of splitting increased. Overall, ΔE7/2 > ΔE5/2, given that 2F7/2 exhibits one more splitting energy level than 2F5/2, thus resulting in a greater difference. The average energy level Eave of the Yb3+ ions with respect to x is shown in Fig. 4(b). Because of the energy-level expansion caused by splitting, Eave increased with x. Moreover, Eave acted as a spherically symmetric central force field in the Hamiltonian.
The crystal field strength Nν is related to the energy level splitting, which has been deduced by F Auzel et al. using relation equations.37 For the ground state 2F7/2 of Yb3+ ions, the relation is expressed as ΔE(2F7/2) = 0.246N(2F7/2); however, the splitting of Yb3+ ion in sesquioxide was beyond the predictive value.6 Here, by combining the trends from Yb:LuxSc2−xO3 and Yb:LuxY2−xO3 crystals, two semi-empirical equations were proposed for defining the relation between the crystal field strength Nν and the maxima splitting ΔEJ of ground (J = 7/2) and excited (J = 5/2) states of Yb3+ ion in sesquioxide, which are expressed as:
| ΔE7/2 = 0.279Nν | (5) |
| ΔE5/2 = 0.225Nν | (6) |
These corresponding straight lines are also represented in Fig. 4(c), and most components of the Yb3+ doped sesquioxide fit the trend lines well. The relations described by the semi-empirical eqn (4)–(6) can be used to predict the energy level splitting from the determined mixed content and ionic radii.
The variation in the spin–orbit coupling parameters ζ with respect to x is shown in Fig. 4(d). Theoretically, the spin–orbit coupling parameter is a free ion parameter that increases rapidly with an increase in the atomic number Z, and ζ is approximately 2900 cm−1 for the Yb3+ ion. Moreover, ζ varied slightly with respect to x and reached its maximum value at x = 0.99, which may be due to the influence of the central force field. Compared with the Yb3+-doped LuxSc2−xO3 crystal, the variation range of ζ was reduced for LuxY2−xO3 owing to the smaller radius difference and weaker disturbance of the central force field.
Under the crystal field effect, the splitting degree of the ground state 2F7/2 energy levels increased with increases in x; this caused a decrease in the spacing between the excited and terminal levels of the transition, resulting in a redshift of emission wavelength and an extension of the fluorescence spectra framework. Meanwhile, lattice vibrations and electron-coupling broadened the fluorescence spectra. Therefore, the vibrational states of the lattice were experimentally and numerically investigated.
The Raman spectra of the Yb:LuxY2−xO3 (x = 0, 0.79, 0.99, 1.19, 1.39, and 2) crystals are shown in Fig. 5(a). The density of phonon states of the Y2O3 crystal calculated using the first-principles method is shown in Fig. 5(b). The calculated values were higher than the experimental values, perhaps because of the different conditions and the inherent defects of the computational models.38 As is evident from the figure, oxygen ions exhibited high-frequency (>300 cm−1) vibrations, which could be attributed to the stretching and bending of the Re–O bonds in the lattice. The vibrational energy was negatively correlated with the bond length that was directly related to the cationic radius. Typically, the frequency of the most intense Raman peak shifted from 376.7 cm−1 (Yb:Y2O3)39 to 391.0 cm−1 (Yb:Lu2O3) with x increasing and the cationic radius decreasing. On the other hand, the vibrations with less than 300 cm−1 energy were primarily from the cationic vibrations, and the cationic contribution of the Re2 site (Y2) was more significant than that of the Re1 site (Y1). It was a negative relationship between the vibrational energy and the cationic mass. As shown in Fig. 5(a), the vibration at approximately 100 cm−1 corresponding to the heavier Lu3+ ion increased with increased x, whereas the vibration at approximately 150 cm−1 corresponding to the lighter Y3+ ion decreased with increased x.
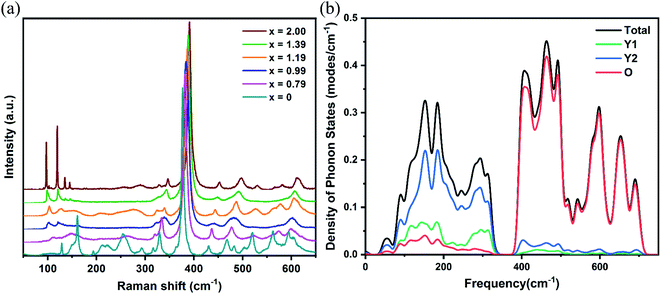 | ||
| Fig. 5 (a) Experimentally obtained Raman spectra for different x values. (b) Calculated density distribution of phonon states for Y2O3. | ||
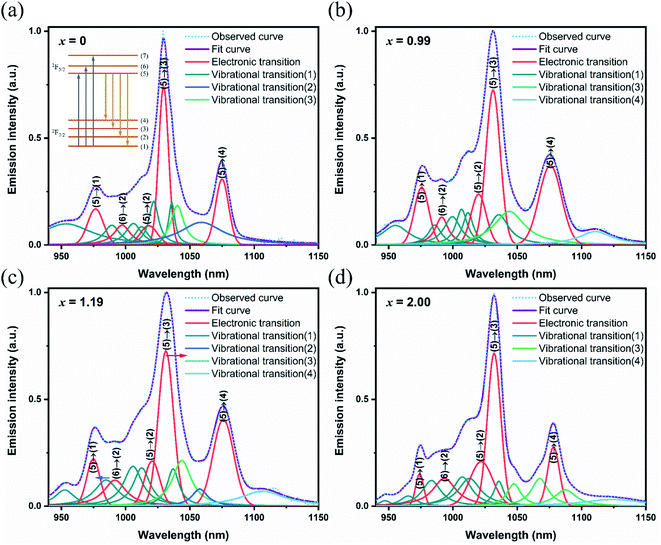
The experimental fluorescence spectra showed that the maximum broadening spectrum was 24.55 nm in the Yb:LuxY2−xO3 crystals at x = 1.19,25 which was expected to obtain pulse continuation of 45 fs.40 In order to distinguish the electronic and vibrational transitions, the fluorescence spectra were decomposed as shown in Fig. 6. The main transition peaks with the same positions as the spectra obtained in low temperature (77 K), researchers generally identified them as the transitions between the upper and lower energy levels which resulting from the Stark splitting.8,41,42 The other peaks were assigned as vibrational transitions since the enhanced electron–phonon coupling strength with the increased temperature.43,44 The electronic transitions were represented using Gauss line shapes because of the inhomogeneous broadening. Meanwhile, the vibrational transitions were represented using Lorentz line shapes because of the homogeneous broadening. As mentioned above, the redshift appeared on the wavelength from electronic transition with increased x, and the broadening from electronic transition reached the maximum at x = 0.99.25 Additionally, the lattice vibrations involved in the vibrational transition were identified. As for high-frequency vibrational transitions, the excited energy levels increased owing to the stronger crystal field, and the terminal energy levels increased owing to the higher vibrational frequency, with increased x. This eventually stabilized the transition peaks at approximately 1006.5, 1012.5, and 1036 nm. With respect to the low-frequency vibrational transitions, the energy level spacing was increased from the opposite changes in the excited and terminal energy levels. The blueshift was observed from approximately 990 nm to 980 nm on low-frequency transition peaks with increased x. The content of x = 1.19 for optimal spectral broadening was achieved considering the influence of the redshift from the crystal field and the blueshift from the electron–phonon coupling.
Conclusions
In this study, the crystal field effects in Yb:LuxY2−xO3 crystals were systematically analyzed, and the intrinsic CFPs Bk and CFPs Bkq were obtained by two-step fitting. The CFPs B4q were discovered to play a major role because of their large values among all the Bkq. The parameter signs were affected by ligand distortion and the changes of polar and azimuth angles were discovered. Subsequently, the semi-empirical equations describing the linear relationship between the energy level splitting, crystal field strength, and the cation radius were deduced, which could be taken as a reference in Yb3+-doped sesquioxides research. The energy-level splitting increased along with the x value; consequently, the spectral framework broadened depending on crystal field effects. Based on vibrational mode experiments and calculations, the vibrations were found to participate in spectral broadening through the electron–phonon coupling process. Specifically, the high-frequency vibrations raised the intensities of the spectra and the low-frequency vibrations brought the blueshift of the transition peaks of the spectra. The findings of this study can therefore serve as a basis for the development of ultrafast laser applications based on other rare-earth ion-doped crystal materials.Conflicts of interest
There are no conflicts to declare.Acknowledgements
This work was supported by the National Natural Science Foundation of China (52025021, 51802307), Foundation of Advanced Laser Technology Laboratory of Anhui Province (No. AHL 20220 ZR04), Future Plans of Young Scholars at Shandong University.Notes and references
- M. Ju, Y. Xiao, W. Sun, C. Lu and Y.-y. Yeung, J. Phys. Chem. C, 2020, 124, 2113–2119 CrossRef CAS.
- Z. Li, P. Zhu, J. Ding, N. Ji, Y. Chen, Z. Wang, X. Duan and H. Jiang, Cryst. Growth Des., 2019, 19, 7143–7152 CrossRef CAS.
- Z. Song, Z. Xia and Q. Liu, J. Phys. Chem. C, 2018, 122, 3567–3574 CrossRef CAS.
- M. Ju, Y. Xiao, M. Zhong, W. Sun, X. Xia, Y.-y. Yeung and C. Lu, ACS Appl. Mater. Interfaces, 2019, 11, 10745–10750 CrossRef CAS.
- G. Boulon and V. Lupei, J. Lumin., 2007, 125, 45–54 CrossRef CAS.
- P. H. Haumesser, R. Gaume, B. Viana, E. Antic-Fidancev and D. Vivien, J. Phys.: Condens. Matter, 2001, 13, 5427–5447 CrossRef CAS.
- R. Gaume, P. H. Haumesser, E. Antic-Fidancev, P. Porcher, B. Viana and D. Vivien, J. Alloys Compd., 2002, 341, 160–164 CrossRef CAS.
- V. Petrov, K. Petermann, U. Griebner, V. Peters, J. Liu, M. Rico, P. Klopp and G. Huber, Proc. of SPIE, 2006, 6216, 62160H Search PubMed.
- C. Kraenkel, IEEE J. Sel. Top. Quantum Electron., 2015, 21, 1602013 Search PubMed.
- W. Tian, R. Xu, J. Zhu and Z. Wei, Acta Photonica Sin., 2021, 50, 0850207 CrossRef.
- Y. Wu, Y. Gao, Q. Zheng, L. Ji, Y. Cui, F. Li, Y. Hua, W. Ma and Z. Sui, Opt. Eng., 2020, 59, 036111 CAS.
- P. Klopp, V. Petrov, U. Griebner, K. Petermann, V. Peters and G. Erbert, Opt. Lett., 2004, 29, 391–393 CrossRef CAS.
- N. Modsching, J. Drs, J. Fischer, C. Paradis, F. Labaye, M. Gaponenko, C. Kraenkel, V. J. Wittwer and T. Sudmeyer, Opt. Express, 2019, 27, 16111–16120 CrossRef CAS PubMed.
- K. Beil, C. J. Saraceno, C. Schriber, F. Emaury, O. H. Heckl, C. R. E. Baer, M. Golling, T. Suedmeyer, U. Keller, C. Kraenkel and G. Huber, Appl. Phys. B: Lasers Opt., 2013, 113, 13–18 CrossRef CAS.
- C. R. E. Baer, C. Krankel, O. H. Heckl, M. Golling, T. Sudmeyer, R. Peters, K. Petermann, G. Huber and U. Keller, Opt. Express, 2009, 17, 10725–10730 CrossRef CAS PubMed.
- A. Schmidt, V. Petrov, U. Griebner, R. Peters, K. Petermann, G. Huber, C. Fiebig, K. Paschke and G. Erbert, Opt. Lett., 2010, 35, 511–513 CrossRef CAS.
- W. Jing, P. Loiko, L. Basyrova, Y. Wang, H. Huang, P. Camy, U. Griebner, V. Petrov, J. M. Serres, R. M. Sole, M. Aguilo, F. Diaz and X. Mateos, Opt. Mater., 2021, 117, 111128 CrossRef CAS.
- S. N. Bagayev, V. V. Osipov, V. A. Shitov, E. V. Pestryakov, V. S. Kijko, R. N. Maksimov, K. E. Lukyashin, A. N. Orlov, K. V. Polyakov and V. V. Petrov, J. Eur. Ceram. Soc., 2012, 32, 4257–4262 CrossRef CAS.
- C. J. Saraceno, O. H. Heckl, C. R. E. Baer, M. Golling, T. Suedmeyer, K. Beil, C. Kraenkel, K. Petermann, G. Huber and U. Keller, Opt. Express, 2011, 19, 20288–20300 CrossRef CAS PubMed.
- C. Kraekel, A. Uvarova, C. Guguschev, S. Kalusniak, L. Huelshoff, H. Tanaka and D. Klimm, Opt. Mater. Express, 2022, 12, 1074–1091 CrossRef.
- C. J. Saraceno, S. Pekarek, O. H. Heckl, C. R. E. Baer, C. Schriber, M. Golling, K. Beil, C. Kraenkel, G. Huber, U. Keller and T. Suedmeyer, Opt. Express, 2012, 20, 9650–9656 CrossRef CAS.
- C. J. Saraceno, O. H. Heckl, C. R. E. Baer, C. Schriber, M. Golling, K. Beil, C. Kraenkel, T. Suedmeyer, G. Huber and U. Keller, Appl. Phys. B: Lasers Opt., 2012, 106, 559–562 CrossRef CAS.
- R. Peters, C. Kraenkel, S. T. Fredrich-Thornton, K. Beil, K. Petermann, G. Huber, O. H. Heckl, C. R. E. Baer, C. J. Saraceno, T. Suedmeyer and U. Keller, Appl. Phys. B: Lasers Opt., 2011, 102, 509–514 CrossRef CAS.
- G. Toci, A. Pirri, B. Patrizi, R. N. Maksimov, V. V. Osipov, V. A. Shitov, A. S. Yurovskikh and M. Vannini, Opt. Mater., 2018, 83, 182–186 CrossRef CAS.
- W. Liu, D. Lu, R. Guo, K. Wu, S. Pan, Y. Hang, D. Sun, H. Yu, H. Zhang and J. Wang, Cryst. Growth Des., 2020, 20, 4678–4685 CrossRef CAS.
- Q. L. Zhang, K. J. Ning, J. Xiao, L. H. Ding, W. L. Zhou, W. P. Liu, S. T. Yin and H. H. Jiang, Chin. Phys. B, 2010, 19, 087501 CrossRef.
- Q. L. Zhang, K. J. Ning, L. H. Ding, W. P. Liu, D. L. Sun, H. H. Jiang and S. T. Yin, Chin. Phys. B, 2013, 22, 067105 CrossRef.
- D. J. Newman, Adv. Phys., 1971, 20, 197–256 CrossRef CAS.
- S. J. Clark, M. D. Segall, C. J. Pickard, P. J. Hasnip, M. J. Probert, K. Refson and M. C. Payne, Z. fur Krist. - Cryst. Mater., 2005, 220, 567–570 CrossRef CAS.
- J. P. Perdew, K. Burke and M. Ernzerhof, Phys. Rev. Lett., 1996, 77, 3865–3868 CrossRef CAS PubMed.
- E. W. Meijer, E. E. Havinga and G. Rikken, Phys. Rev. Lett., 1990, 65, 37–39 CrossRef CAS PubMed.
- A. Lupei, V. Lupei and S. Hau, Opt. Mater., 2017, 63, 143–152 CrossRef CAS.
- K. A. Gschneidner Jr and L. Eyring, Handbook on the physics and chemistry of rare earths, 1996, vol. 23 Search PubMed.
- Y. Q. Jia, J. Solid State Chem., 1991, 95, 184–187 CrossRef CAS.
- R. D. Shannon, Acta Crystallogr., Sect. A: Cryst. Phys., Diffr., Theor. Gen. Crystallogr., 1976, 32, 751–767 CrossRef.
- R. Guo, D. Huang, D. Lu, F. Liang, Q. Zhang, H. Yu and H. Zhang, Opt. Mater. Express, 2022, 12, 1963–1976 CrossRef.
- F. Auzel, Opt. Mater., 2002, 19, 89–94 CrossRef CAS.
- X. Zhang, W. Wang, Q. Zeng and H. Li, Solid State Commun., 2010, 150, 360–363 CrossRef CAS.
- A. Kremenovic, J. Blanusa, B. Antic, P. Colomban, V. Kahlenberg, C. Jovalekic and J. Dukic, Nanotechnology, 2007, 18, 145616 CrossRef.
- W. Koechner, Solid-state laser engineering, Springer Science+Business Media, Inc, 2006 Search PubMed.
- L. D. Merkle, G. A. Newburgh, N. Ter-Gabrielyan, A. Michael and M. Dubinskii, Opt. Commun., 2008, 281, 5855–5861 CrossRef CAS.
- K. Petermann, L. Fornasiero, E. Mix and V. Peters, Opt. Mater., 2002, 19, 67–71 CrossRef CAS.
- A. Lupei, V. Lupei, V. N. Enaki, C. Presura and A. Petraru, Spectrochim. Acta, Part A, 1999, 55, 773–781 CrossRef.
- A. Ellens, H. Andres, M. L. H. terHeerdt, R. T. Wegh, A. Meijerink and G. Blasse, Phys. Rev. B, 1997, 55, 180–186 CrossRef CAS.
Footnote |
| † Electronic supplementary information (ESI) available. See https://doi.org/10.1039/d2ra03639h |
| This journal is © The Royal Society of Chemistry 2022 |

