 Open Access Article
Ratiometric rapid distinction of two structurally similar fluoroquinolone antibiotics by a Tb/Eu hydrogel†
Ananya Biswas and
Uday Maitra *
*
Department of Organic Chemistry, Indian Institute of Science, Bangalore, 560012, Karnataka, India. E-mail: maitra@iisc.ac.in
First published on 15th September 2022
Abstract
Norfloxacin and ofloxacin are two frequently prescribed second-generation fluoroquinolone antibiotics with an identical 4-quinolone chromophore and hence, are difficult to distinguish by conventional methods (UV or fluorescence). We have designed a Tb3+/Eu3+/cholate cocktail that enabled us to differentiate these two drugs and rapidly measure their concentrations when present together. Additionally, a Tb3+-cholate gel-based paper sensor was developed to detect and quantify them in a single drug containing system with a limit of detection (LOD) well below 100 nM.
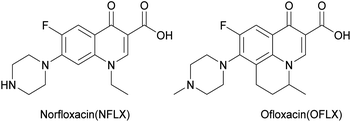
Fluoroquinolone antibiotics belong to one of the most important classes of human and veterinary medicines owing to their broad-spectrum activity and effective oral absorption. Norfloxacin and ofloxacin (Fig. 1) are among the most prescribed second generation fluoroquinolone antibiotics1,2 used for the treatment of respiratory and urinary tract infections, ocular and skin infections, pelvic inflammatory disease, gonococcal urethritis, infectious diarrhoea, etc. However, potential adverse reactions such as tendinitis, tendon rupture, arthralgia, myalgia, peripheral neuropathy, hematuria, and central nervous system effects due to their excess intake have been well documented in the literature.3 Extensive use and misuse of the antibiotics as veterinary medicines have led to their appearance in milk,4,5 chicken6 and fish7 imposing adverse side effects for the consumer. Contamination of municipal wastewater, surface water and even groundwater results from their extensive usage, and from their excretion from human and animals unchanged.8 All these can cause the propagation of antibiotic-resistant micro-organisms9 leading to a disturbed ecosystem. Therefore, the development of a robust, rapid and straightforward analytical protocol for screening of Norfloxacin (NFLX) and Ofloxacin (OFLX) residues in biological fluids, sewage water, edible tissues and foodstuff is highly desirable for the control of their appropriate dosage, maintaining their pharmacokinetics and avoid environmental crisis.10 Various analytical methods for this purpose have been reported in the literature including spectrophotometry,11 spectrofluorimetry,12 voltammetry,13,14 capillary electrophoresis,15 chemiluminescence,16,17 and high performance liquid chromatography (HPLC).18 Several fluorescent probes have utilized molecular imprinting chemiluminescence,19 Neodymium-modified micellar media,20 carbon dots etc.21,22 Although fluorescence-based reporters provide greater intrinsic sensitivity, many of them are, however, incompatible with biological samples because of complications arising from background scattering and autofluorescence from endogenous components.23 Trivalent lanthanide ions have long radiative lifetimes allowing background-free measurement using time-gating. They also have sharp, well-defined long-wavelength emission fingerprints24 ideal for biological applications and can therefore serve as a strong sensing platform. They can be sensitized by proximate chromophores (‘‘antennae’’) and may act as attractive fluorogenic (turn on) and fluorolytic (turn-off) bio-probes. This group has extensively investigated photoluminescent lanthanide cholate supramolecular hydrogels25–32 by utilizing their in-built hydrophobic pockets to encapsulate small organic ‘antennas’. The self-assembly brings the antenna in close proximity to the acceptor lanthanide leading to energy transfer to the lanthanide ion. This strategy thus eliminates the need for the synthesis of antenna-linker-ligand type of probes to achieve lanthanide sensitization. A variety of lanthanide-luminescence based fluoroquinolone-assays17,33–38 have been reported in the literature. However, tedious synthesis of the probe, complex sample treatments, non-aqueous detection media, strict maintenance of pH have restricted the practical applicability of many of them.34–37 We have found that when doped in micromolar concentrations in Tb-Ch (5/15 mM) or Eu-Ch (5/15 mM) gels, both Norfloxacin and Ofloxacin significantly enhanced the luminescence intensities. Based on this finding we explored cholate-hydrogel based detection and quantification of these two fluoroquinolones. Initial experiments were performed in Tb (5 mM) cholate (15 mM) hydrogel by doping it with increasing concentrations of norfloxacin (NFLX). The emission intensity of Tb3+ showed a linear relationship with concentration (Fig. S1 in ESI†). Even 4 μM of NFLX resulted in 30-fold enhancement of sensitization of Tb3+ luminescence. Atomic force microscopy showed that the fibrous network of Tb3+-cholate gel remained unaltered (Fig. S2 in ESI†) when NFLX was doped in micromolar concentrations, proving the robustness and stability of the sensing gel system. Fluorescence microscopic image of semi-dried NFLX doped Tb-cholate gel (Fig. S2c in ESI†) showed uniform green luminescent gel fibres, indicating that the NFLX was distributed and embedded on the hydrophobic fibres, promoting the energy transfer process making the fibres green luminescent.
In order to simplify the sensing method, we chose a paper-based system. Such sensors39–41 are affordable, biodegradable, sensitive, specific, user-friendly, rapid, robust, and deliverable to end-users. For this purpose, Tb-cholate (5/15 mM) gel doped with NFLX (4 μM) was prepared, sonicated for 5–6 s to reduce the viscosity, and then applied (20 μL) on a 3 mm paper disc (Fig. 2). SEM images showed dried flakes of gel on the cellulose fibre network (Fig. S3 in ESI†). The thickness of the gel layer coated on the paper surface was about 8 μm, as determined by tilt-SEM (Fig. S3c in ESI†). Time gated fluorescence (TRF) was measured on the coated discs using a plate reader. After 5 min of drying, a significantly higher Tb3+ luminescence output was observed, compared to that measured in wet gels (Fig. 3b, 8 vs. 7). This increase may be attributed to the efficient wicking of water molecules from the gel in the hydrophilic cellulose frameworks of paper which in turn helps reduce the OH-mediated luminescence quenching.42 Increased sensitization on gel-coated paper discs was observed for both NFLX and OFLX. We also confirmed that the extent of sensitization of Tb3+ remained constant as a function of time (Fig. S4 in ESI†). The limit of detection (LOD) for NFLX and OFLX were measured based on Tb3+-luminescence output as a function of the drug concentration and were found to be 13.6 nM (Fig. S5a in ESI†) and 67 nM (Fig. S5b in ESI†), respectively. The paper-based method was used to quantify the NFLX spiked in milk samples (cow raw milk and a commercial homogenized toned milk) and in human blood serum. The LOD values measured were 68 nM, 100 nM and 100 nM, respectively (Fig. S12 and S13 in SI†). The time-gated detection method eliminated any interference from the matrix (serum or milk). This method is therefore simple, rapid, sensitive, autofluorescence and background emission free, and may thus serve as a practical tool for analytical screening.
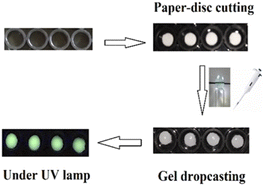 | ||
| Fig. 2 Design of paper-based sensors (paper disc cutting, placing them on plate groove, gel dropcasting). | ||
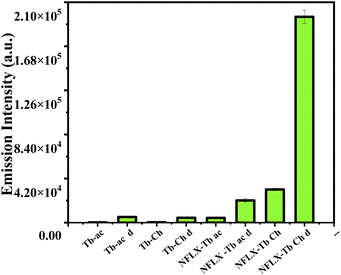 | ||
| Fig. 3 Tb3+ -luminescence (λem 545 nm, λex 330 nm) enhancement by NFLX (4 μM) (Ac, Ch, D: acetate solution, cholate matrix and coated paper disc, respectively). | ||
Distinguishing two structurally similar compounds of the same class is a fundamental objective of analytical research.
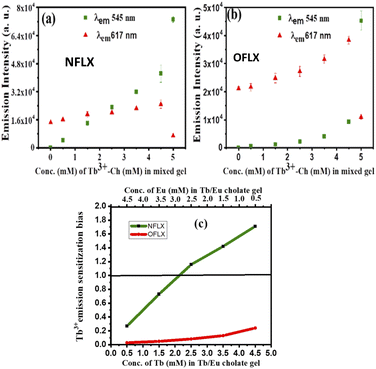
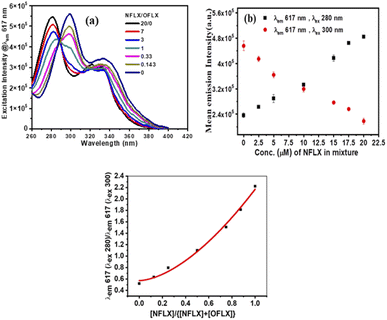
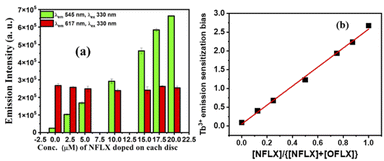
Dennany et al. recently reported a [Ru(bpy)3]2+ based ECL sensor43 to distinguish Atropine and Scopolamine, two similar alkaloids. Encouraged by this report, we focused on the differentiation of norfloxacin and ofloxacin which have comparable 4-quinolone chromophores with similar functional groups attached (Fig. 1). With both drugs, the luminescence enhancement for Tb3+ was greater than that for Eu3+ (Fig. S8 & S9 in ESI†). Therefore, single lanthanide (Tb3+ or Eu3+) derived gels cannot differentiate them. For this purpose, heterobimetallic ensemble strategy was explored by adopting the ratiometric detection technique.44,45 In order to identify optimum conditions, a set of five cholate gels samples containing varying ratios of Tb3+ & Eu3+ (maintaining total concentration of 5 mM) was prepared. This set was doped with 1 μM NFLX. An identical set was prepared with 1 μM OFLX as the dopant. After drop casting the gels on paper discs, luminescence intensities were quantified on a plate reader (Fig. 4a and b). From these data, the sensitization bias ITb/IEu, as measured by I545/I617 (λex 330 nm), was calculated and plotted against the concentration of Tb3+ in the mixed gel. Tb3+/Eu3+ cocktail with [Tb3+] ≥ 2.5 mM doped with NFLX showed sensitization bias (I545/I617) values greater than 1, whereas with OFLX the bias was always less than 1 (Fig. 4c). Based on these observations we chose Tb3+/Eu3+/cholate (4.5 mM/0.5 mM/15 mM) cocktail as the probe to differentiate these two drugs over a wider concentration range (Fig. S15 in ESI†). Another set of measurements were made at low μM concentrations of the drugs (Fig. S14 in ESI†). The Terbium sensitization bias (ITb/IEu) was calculated and plotted against the concentration of FLXs and found to be greater than 1 for NFLX but less than 1 for OFLX (Fig. S14c in ESI†). In the Tb3+/Eu3+ mixed cholate hydrogel matrix three concurrent energy transfer processes can occur–energy transfer from sensitizer (i) to Tb3+, (ii) to Eu3+, and (iii) energy transfer from Tb3+ to Eu3+. While one of the emission bands of Tb3+ has overlap with the most intense 617 nm peak of Eu3+, the Eu3+ emission peak at 690 nm is solely contributed by Eu3+. The 690 nm emission intensity in 15 μM NFLX doped mixed gels was measured and found to linearly increase with the Tb3+ concentration (even though Eu3+ concentration is decreasing) indicating Tb3+– Eu3+ energy transfer (Fig. S19 in ESI†). Significant reduction of Tb3+-luminescence lifetime from 1.53 ms in NFLX doped Tb3+-Ch (4.5 mM/15 mM) gel to 0.55 ms in NFLX doped Tb3+/Eu3+-Ch (4.5 mM/0.5 mM/15 mM) gel provided additional evidence. In the Tb3+/Eu3+/cholate (4.5 mM/0.5 mM/15 mM) cocktail, the three concurrent energy transfer processes are optimized to show Tb3+/Eu3+ emission intensity ratio exactly reversed for the two drugs (Fig. S14, S16 in ESI†). The optimized cocktail was subsequently used to determine the ratio of the two drugs in a mixture. The drug mixtures (total concentration 20 μM) were doped in the cocktail and the photophysical behavior was investigated. The excitation spectra corresponding to Eu3+ 617 nm emission showed a unique pattern depending on the ratio of NFLX and OFLX in the mixture. The intensity (Fig. 5a) at 280 nm reflects NFLX excitation, whereas the intensity at 300 nm reflects OFLX excitation. Based on these findings, the Eu3+ emission intensity at 617 nm from the drug mixtures at two different excitation wavelengths 280 nm and 300 nm were evaluated. Ratiometric response I617 (λex 280)/I617(λex 300) was found to linearly increase with the ratio of NFLX concentration to the total concentrations of both the drugs in the mixture (Fig. 5c). To validate the need for using the cocktail in this study, the excitation spectra corresponding to Eu3+ at 617 nm in (NFLX + OFLX) doped Eu3+-Ch gel (no Tb) was recorded in which no such NFLX & OFLX ratio-dependent pattern was observed (Fig. S17 in ESI†). For further exploration of the cocktail, Terbium emission sensitization bias was calculated and found to be directly proportional to the ratio of NFLX concentration to the total concentrations of both the drugs in the mixture (Fig. 6b). This protocol can thus be used as a platform to determine the ratio and individual concentration of the two drugs when present in a mixture.
In conclusion, a hetero bimetallic ensemble Tb3+/Eu3+/cholate was designed for the differentiation of structurally similar NFLX and OFLX. Till date, only physical separation by HPLC is known to quantify norfloxacin and ofloxacin concentrations in a mixture. Additionally, a paper-based sensor has also been developed for the detection and quantification of them in single drug containing system with a lower nanomolar range. The method allowed autofluorescence free detection with biological samples without the need of deproteinization and sample processing. Nonetheless, our preliminary investigations employed to utilize ratiometric bis-lanthanide strategy will serve as the foundation for the fundamental need to differentiate structurally similar molecules. Further studies to utilize this supramolecular paper-based methodology in real diagnostic fields is underway in our lab.
Author contributions
AB performed experiments, analysed the data, and wrote the initial draft. UM revised the final manuscript. The project was supervised by UM.Conflicts of interest
There are no conflicts to declare.Acknowledgements
UM thanks the SERB for the award of a J.C. Bose Fellowship (SP/S2/OC-68/2007) and for grant CRG/2020/0001140. CENSE, IISc is acknowledged for providing the SEM facility. Blood serum was collected from a volunteer by IISc Health Centre professionals as per the decision (IHEC no: 5-23012019) of Institutional Human Ethics Committee (IHEC) of IISc. AB thanks the Council of Scientific and Industrial Research (CSIR), New Delhi for the award of a research fellowship.Notes and references
- R. Feng, X. Zhang, X. Xue, Y. Xu, H. Ding, T. Yan, L. Yan and Q. Wei, ACS Appl. Bio Mater., 2021, 4, 7186–7194 CrossRef CAS PubMed.
- Y. Song, J. Qiao, W. Liu and L. Qi, Anal. Bioanal. Chem., 2021, 413, 979–985 CrossRef CAS PubMed.
- S. Kabbani, A. L. Hersh, D. J. Shapiro, K. E. Fleming-Dutra, A. T. Pavia and L. A. Hicks, Clin. Infect. Dis., 2018, 67, 134–136 CrossRef PubMed.
- S. Sachi, J. Ferdous, M. H. Sikder and S. M. Azizul Karim Hussani, J. Adv. Vet. Anim. Res., 2019, 6, 315–332 CrossRef.
- S. R. Raz, M. G. E. G. Bremer, W. Haasnoot and W. Norde, Anal. Chem., 2009, 81, 7743–7749 CrossRef PubMed.
- R. Chaowana and O. Bunkoed, Anal. Bioanal. Chem., 2019, 411, 6081–6090 CrossRef CAS PubMed.
- H. Li, J. Yin, Y. Liu and J. Shang, J. Agric. Food Chem., 2012, 60, 1722–1727 CrossRef CAS PubMed.
- A. Hartmann, A. C. Alder, T. Koller and R. M. Widmer, Environ. Toxicol. Chem., 1998, 17, 377–382 CrossRef CAS.
- J. Cama, H. Bajaj, S. Pagliara, T. Maier, Y. Braun, M. Winterhalter and U. F. Keyser, J. Am. Chem. Soc., 2015, 137, 13836–13843 CrossRef CAS PubMed.
- M. J. Schneider and D. J. Donoghue, J. Chromatogr. B., 2002, 780, 83–92 CrossRef CAS.
- B. S. Nagaralli, J. Seetharamappa and M. B. Melwanki, J. Pharm. Biomed. Anal., 2002, 29, 859–864 CrossRef CAS PubMed.
- S. Wang, X. Bao, B. Gao and M. Li, Dalton Trans., 2019, 48, 8288–8296 RSC.
- A. M. Santos, A. Wong, F. H. Cincotto, F. C. Moraes and O. Fatibello-Filho, Microchim. Acta, 2019, 186, 148–157 CrossRef PubMed.
- Z. Liu, M. Jin, J. Cao, J. Wang, X. Wang, G. Zhou, A. van den Berg and L. Shui, Sens. Actuators, B, 2018, 257, 1065–1075 CrossRef CAS.
- B. Deng, C. Su and Y. Kang, Anal. Bioanal. Chem., 2006, 385, 1336–1341 CrossRef CAS PubMed.
- H. W. Sun, L. Q. Li and X. Y. Chen, Anal. Bioanal. Chem., 2006, 384, 1314–1319 CrossRef CAS PubMed.
- M. Kaczmarek and S. Lis, Analyst, 2011, 136, 2592–2597 RSC.
- A. H. Kamal and S. F. El-Malla, Microchem. J., 2019, 150, 104151–104158 CrossRef CAS.
- W. Wang, Z. Gong, S. Yang, T. Xiong, D. Wang and M. Fan, Talanta, 2018, 208, 120435–120442 CrossRef.
- R. Duan, J. Jiang, S. Liu, J. Yang, M. Qiao, Y. Shi and X. Hu, J. Sci. Food Agric., 2017, 97, 2569–2574 CrossRef CAS PubMed.
- M. Yang, H. Li, J. Liu, W. Kong, S. Zhao, C. Li, H. Huang, Y. Liu and Z. Kang, J. Mater. Chem. B, 2014, 2, 7964–7970 RSC.
- V. D. Dang, A. B. Ganganboina and R. A. Doong, ACS Appl. Mater. Interfaces, 2020, 12, 32247–32258 CrossRef CAS.
- Y. Li, H. Wang, J. Li, J. Zheng, X. Xu and R. Yang, Anal. Chem., 2011, 83, 1268–1274 CrossRef CAS PubMed.
- M. C. Heffern, L. M. Matosziuk and T. J. Meade, Chem. Rev., 2014, 114, 4496–4539 CrossRef CAS PubMed.
- S. Banerjee, R. Kandanelli, S. Bhowmik and U. Maitra, Soft Matter, 2011, 7, 8207–8215 RSC.
- S. Bhowmik, S. Banerjee and U. Maitra, Chem. Commun., 2010, 46, 8642–8644 RSC.
- D. Bhowmik, A. Dutta and U. Maitra, Chem. Commun., 2020, 56, 12061–12064 RSC.
- T. Gorai and U. Maitra, J. Mater. Chem. B, 2018, 6, 2143–2150 RSC.
- T. Gorai and U. Maitra, ACS Sens., 2016, 1, 934–940 CrossRef CAS.
- R. Laishram and U. Maitra, Asian J. Org. Chem., 2017, 6, 1235–1239 CrossRef CAS.
- R. Laishram, S. Bhowmik and U. Maitra, J. Mater. Chem. C, 2015, 3, 5885–5889 RSC.
- S. Bhowmik, T. Gorai and U. Maitra, J. Mater. Chem. C, 2014, 2, 1597–1600 RSC.
- A. Rieutord, L. Vazquez, M. Soursac, P. Prognon, J. Blais, P. Bourget and G. Mahuzier, Anal. Chim. Acta, 1994, 290, 215–225 CrossRef CAS.
- S. N. Shtykov, T. D. Smirnova, Y. G. Bylinkin, N. V. Kalashnikova and D. A. Zhemerichkin, J. Anal. Chem., 2007, 62, 136–140 CrossRef CAS.
- F. Yu, L. Li, F. Chen and W. Liu, Anal. Lett., 2010, 43, 357–366 CrossRef CAS.
- M. J. Schneider, L. Yun and S. J. Lehotay, Food Addit. Contam. A, 2013, 30, 666–669 CrossRef CAS.
- H. Tan, L. Zhang, C. Ma, Y. Song, F. Xu, S. Chen and L. Wang, ACS Appl. Mater. Interfaces, 2013, 5, 11791–11796 CrossRef CAS.
- S. Singha and K. H. Ahn, Sensors, 2016, 16, 2065–2074 CrossRef PubMed.
- M. M. Gong and D. Sinton, Chem. Rev., 2017, 117, 8447–8480 CrossRef CAS PubMed.
- S. Abbasi-Moayed, H. Golmohammadi and M. R. Hormozi-Nezhad, Nanoscale, 2018, 10, 2492–2502 RSC.
- S. Chen, Y. Song, D. Ding, Z. Ling and F. Xu, Adv. Funct. Mater., 2018, 28, 1802547–1802555 CrossRef.
- K. Binnemans, Chem. Rev., 2009, 109, 4283–4374 CrossRef CAS PubMed.
- K. Brown, C. Jacquet, J. Biscay, P. Allan and L. Dennany, Anal. Chem., 2020, 92, 2216–2223 CrossRef CAS PubMed.
- Z. Dai, L. Tian, B. Song, Z. Ye, X. Liu and J. Yuan, Anal. Chem., 2014, 86, 11883–11889 CrossRef CAS PubMed.
- M. S. Tremblay, M. Halim and D. Sames, J. Am. Chem. Soc., 2007, 129, 7570–7577 CrossRef CAS.
Footnote |
| † Electronic supplementary information (ESI) available: Materials and methods, emission, and excitation spectra. See https://doi.org/10.1039/d2ra03668a |
| This journal is © The Royal Society of Chemistry 2022 |

