DOI:
10.1039/D2RA04353J
(Paper)
RSC Adv., 2022,
12, 26111-26115
Enhancement of V2O5 Li-ion cathode stability by Ni/Co doped Li-borate-based glass†
Received
14th July 2022
, Accepted 7th September 2022
First published on 15th September 2022
Abstract
In this research, we investigate the stability of a Li-ion cathode created by mixing a borate based glass which has been doped with Ni/Co and vanadium pentoxide (V2O5). V2O5 has a high specific capacity in battery systems because of its layered structure and variety of oxidation states. However, due to the flimsy structure, the capacity stability of V2O5 is fairly low. In this case, we seek to overcome the problem by mixing Ni/Co-doped borate based glass. The voltage-capacity graph demonstrates that the form of the glass mix was changed from a stairway shape to a straight line while the capacity was not much decreased. The crystallography study using X-ray diffractograms looked at whether the cycling test had changed the crystal structure of V2O5. The X-ray Absorption Near Edge Structure (XANES) results also reveal that V2O5's oxidation state changed from V5+ to V4+. The glass mix can retain more of the V5+ state, indicating that glass mixture helps to release the Li-ions trapped in the structure. The findings of this study might contribute to the rapid advancement of renewable energy and electric vehicle technology.
Introduction
To support the exponential rise of electric vehicles and renewable energy sources, a high-density energy storage technology is necessary.1 Lithium-ion batteries (LIBs) are widely used as a power source due to their high energy density, power, and low cost.2 Furthermore, since long-range electric vehicles (EVs) predominate the market, high-performance batteries are needed.3 However, LiFePO4 (LFP) is the most used cathode material for LIBs because of its inexpensive cost.4,5 Unfortunately, the specific capacity of the LFP cathode is only around 170 mA h g−1 due to the low number of Li-ion cells in the unit cell.6 Vanadium-based materials, on the other hand, are attractive because they have a wide range of oxidation states and could be manufactured using a variety of techniques.7–9 The vanadium pentoxide (V2O5) phase is particularly intriguing since it is a layer form material in which Li-ion can be inserted up to 4 ions per formula unit, resulting in a huge theoretical capacity of roughly 440 mA h g−1.10 With this performance, an EV car with a range of over 1000 kilometres is achievable. Despite this, the vanadium oxide structure of this material is quite weak and easy to break down during cycling use, which causes its capacity to decrease quickly.11,12 There are numerous ways to deal with this problem; a prior study found that graphene might hold the vanadium structure and enhance stability.6 By the way, producing high quality large-scale graphene mix materials still requires effort.13,14 Here, we show how to create vanadium composite materials on a massive scale for Li-ion electrodes. The strength and durability of glass made it a material that is thought to aid in strengthening.15 According to a previous study, glass nature has an open structure that may be used for the high stability of battery electrodes.16–18 The Li-borate base glass system was successfully used as a Li-ion electrode in this investigation. As we have studied in various conditions, cobalt and nickel co-doping was used to improve the electrochemical characteristics. In this research, the mechanism and capacity stability will be discussed. Moreover, The X-ray Absorption Near Edge Structure (XANES) approach was also utilized to address the oxidation states of the V ions which have been affected from the cycling test.
Experimental
Preparation of the glass
The lithium-borate-based glass (0.16NiO-0.04CoO:0.8LBO) was co-doped with nickel and cobalt ions utilizing a two-step melt-quenching technique.15 The first stage was to make LBO-based glass by combining finely powdered (99% analytical grade purity) 6.553 g of Li2CO3 and 21.961 g of H3BO3 in Pt crucibles and melting at 1100 °C for an hour in an electrical furnace. The liquid glass was then poured over stainless-steel plates before being immediately pressed by another set of stainless-steel plates to reduce the temperature. Following that, 0.168 g of NiO and 2.179 g of CoO were added to the 7.651 g of fine powdered LBO glasses. Similar to the previous process, but the second step was completed with a melting temperature of 1150 °C.
Preparation of a V2O5 mix Ni/Co doped Li-borate base glass electrode
To create the slurry, 0.8 g of V2O5 mix Ni/Co doped Li-borate base glass (under various composition conditions), 0.1 g of carbon black (CB), and 0.1 g of polyvinylidene fluoride (PVDF) were mixed in 4 ml of N-methyl-2-pyrrolidone (NMP). The slurry was then ball-milled at 300 rpm for 24 hours.19,20 The mixed-well slurry was deposited on a 16 μm thick aluminium foil current collector using the doctor blade technique (set at a height of 200 μm). The films were then pre-heated for one hour at 90 °C. The films were then pressed at 1 ton and heated for 1 h at 120 °C. The dried films were cut to a dish diameter of 16 mm and kept in a dry box.
The composition condition varied from 100 percent of pure V2O5 (name as V100) to 0 percent (name as V00). The V2O5 mix Ni/Co doped Li-borate base glasses had the following composition ratio:
| V00 → 100% Ni/Co doped Li-borate base glass + 0% V2O5 |
| V25 → 75% Ni/Co doped Li-borate base glass + 25% V2O5 |
| V50 → 50% Ni/Co doped Li-borate base glass + 50% V2O5 |
| V75 → 25% Ni/Co doped Li-borate base glass + 75% V2O5 |
| V94 → 6% Ni/Co doped Li-borate base glass + 94% V2O5 |
| V100 → 0% Ni/Co doped Li-borate base glass + 100% V2O5 |
Structural and physical characterization
The X-ray diffraction (XRD). The X-ray diffraction (XRD) spectra were acquired on the Rigaku SmartLab using Cu Kα radiation with a 40 kV applied voltage and 30 mA anode current. SEM with energy dispersive spectroscopy (EDS) (FEI quanta 450).
The X-ray Absorption Spectroscopy (XAS). The X-ray Absorption Spectroscopy (XAS) were performed at the Synchrotron Light Research Institute (Public Organization), Thailand's Beamline 5.2 SUT-NANOTEC-SLRI XAS. The V, Co, and Ni K-edges of a V2O5 mix Ni/Co doped Li-borate base glass film over Al foil were measured in fluorescence mode. A Ge (111) double crystal monochromator was used to analyse the samples. All spectra were calibrated in terms of energy regarding the first peak in the derivative spectrum of pure Ni, Co, and V. As previously reported, the XANES were normalized using the Athena program.21
Manufacturing of Li-ion battery coin cells
The cell was constructed using the coin cell technique (the schematic illustration of coin cell assembly components was shown in Fig. 1b). The anode was Li foil, while the cathode was V2O5 mix Ni/Co doped Li-borate base glass film on Al foil, separated by PP separator film (Celgard 2400).22 After being dropped with 50 microliters of 1 M LiPF6 in ethylene carbonate (EC)![[thin space (1/6-em)]](https://www.rsc.org/images/entities/char_2009.gif) :
:![[thin space (1/6-em)]](https://www.rsc.org/images/entities/char_2009.gif) dimethyl carbonate (DMC) (1
dimethyl carbonate (DMC) (1![[thin space (1/6-em)]](https://www.rsc.org/images/entities/char_2009.gif) :
:![[thin space (1/6-em)]](https://www.rsc.org/images/entities/char_2009.gif) 1) electrolyte, the coin cell was crimped with an ECCCM-160E-A crimping machine (MTI Corporation) at a 1 ton push. The voltage was measured immediately after cleaning the cell and set as the initial voltage. Galvanostatic cycling profiles of cells were performed in ambient temperature circumstances utilizing the battery testing equipment (Neware BTS4000) at 0.03 A g−1 current density.23,24 The cell's measuring voltage range was defined based on the beginning voltage, with the upper voltage limit equal to the initial voltage plus 1.6 volts and the lower voltage limit equal to the initial voltage minus 0.4 volts.
1) electrolyte, the coin cell was crimped with an ECCCM-160E-A crimping machine (MTI Corporation) at a 1 ton push. The voltage was measured immediately after cleaning the cell and set as the initial voltage. Galvanostatic cycling profiles of cells were performed in ambient temperature circumstances utilizing the battery testing equipment (Neware BTS4000) at 0.03 A g−1 current density.23,24 The cell's measuring voltage range was defined based on the beginning voltage, with the upper voltage limit equal to the initial voltage plus 1.6 volts and the lower voltage limit equal to the initial voltage minus 0.4 volts.
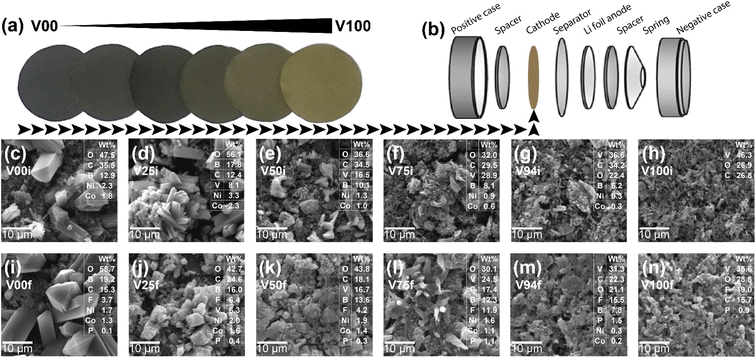 |
| | Fig. 1 (a) The photograph of film composition of V2O5 from 0% (black color) to 100% (yellowish-brown color), (b) the coin cell assembly components, the SEM images before cycling test of: (c) 0%, (d) 25%, (e) 50%, (f) 75%, (g) 94%, (h) 100% of V2O5, the SEM images after cycling test of: (i) 0%, (j) 25%, (k) 50%, (l) 75%, (m) 94%, and (n) 100% of V2O5, the inset is the weight of composition investigated from the SEM-EDS technique. | |
Results and discussion
The V2O5 composite glass film is evenly spread, as shown in Fig. 1a. The colour tones are spread equally. Pure glass is relatively black colour (due to the carbon black components), and the colour fades to yellowish-brown in pure V2O5 conditions. A scanning electron microscope (SEM) reveals the mixture's blending and even dispersion (Fig. 1c–h). The glass particles are quite large in comparison to the V2O5 crystals. The dispersion of particles was investigated by SEM-EDS mapping of the elements (see Fig. S1–S12 in the ESI data†). The SEM of after-test films was also measured to determine the structure change during the cycling test (Fig. 1i–n). To avoid irrelevant change, the films were measured after the cycle test without being cleansed, therefore the films will also be covered with LiPF6 electrolyte elements. As a result of incorporating electrolyte materials, the weight percentage of composition elements changed. However, the composition of V remains the same as a function of the setting condition (the comparing graph was shown in the Fig. S13 of ESI data†). According to the earlier study,17 some glass was seen in the SEM changing from glass to crystal throughout the cycle test (see clearly in Fig. 1i). The crystal spike that was generated has a chance to adhere to the V and provide strength. It is like a stone in concrete, giving it a stronger structure.25
The X-ray diffraction (XRD) reveals the presence of an Al peak in a V2O5 composite glass film coated on an Al current collector (as shown in Fig. 2b). In the mixed V2O5 condition, the peak V2O5 satisfies the standard value. In the pure glass without mixing V2O5 conditions, no peak was detected. It obviously corresponds to the properties of the glass.15 Furthermore, the XRD curves (Fig. 2c) changed significantly after 30 cycles of battery testing (but the Al current collector peak is still in the same position, confirming that the shifted peak is not from measurement or instrument). After the 30th cycling test crystallinity of V2O5 trends to be disappeared due to the irreversible state of V2O5 at below 3.0 V as agreed with the previous study.26,27 The V2O5 mixed glass was coated on the Al current collector and used as the cathode Li-ion battery.28 The voltage value was immediately measured after the cell assembly is completed to determine the cell test range. The voltage is lowest in the pure glass condition and highest in the pure V2O5 condition, as shown in Fig. 3a. The potential versus the amount of V2O5 is shaping like an S-curve.
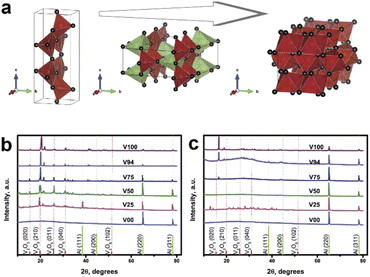 |
| | Fig. 2 (a) Schematic illustration of the V2O5 crystal structure before, during Li-ion intercalation, and after the cycling test, X-ray diffraction patterns (XRD) of V2O5 mixed Ni/Co doped Li-borate base glass in the various compositions of V2O5: (b) fresh film before a test and (c) after the cycling test. | |
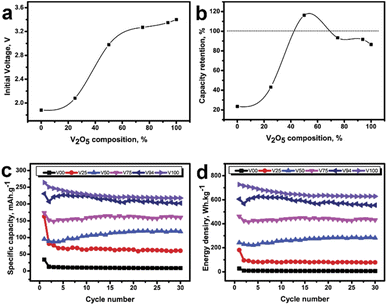 |
| | Fig. 3 (a) The initial voltage was immediately measured after the cell assembly, (b) the percent of capacity retention compare between the 1st and 30th cycle test, (c) specific capacity versus cycle test, and (d) energy density versus cycle test of various compositions of V2O5. | |
The results demonstrate that it has the highest capacity and energy density in pure V2O5 conditions, with 264 mA h g−1 and 726 W h kg−1, respectively. As more glass is added, the value gradually decreases (see Fig. 3c and d). However, after 30 cycles of testing, it was discovered that the capacitance is retain only 86 percent of its initial value under pure V2O5 conditions. But the retention is greater in the glass mixed conditions, particularly in the 50% glass blended conditions, where capacitance is even greater than the initial value (as illustrated in Fig. 3b). Even though the value is modest, it was discovered to be pretty stable under pure glass conditions. The shape of the capacity-voltage graph varies with the glass-to-V2O5 ratio, as shown in Fig. 4. It was discovered that the graph has a stepped shape in pure V2O5 conditions. The graph remains unchanged as the number of cycles increases. However, there is a shortening due to reduced capacity. The graph was also discovered in the first round with a stepped graph when mixing small amounts of glass, such as 6 percent and 25 percent glass, as shown in Fig. 4b and c, respectively. But more and more stretches are starting. The graph was discovered to change to a straight line as the number of cycles increased. Additionally, the graph appears to be linear in the first round when the glass is more than 50% mixed. Note that, the full charge/discharge curve was shown in Fig. S14 in the ESI.† The dQ/dV – V curve (inset of each graph) displays the change in reaction position for each condition to help in understanding the change.29 The graph was smaller in the pure V2O5 condition (see the inset of Fig. 4a), but it still had the same shape and peak position. Considering the conditions that have been blended with glass. A significant shift in shape was observed where the dominant response peak becomes smaller, and the graph feature was trended to be square. This is analogous to the supercapacitor's graph characteristic,30 which is high stability energy storage. Furthermore, redox peaks were not clearly visible in circumstances with more than 75% mixed glass and pure glass. However, the graph, like any other condition, was shifted towards a square shape. V2O5 exhibits a variety of oxidation states depending on its structure and neighbouring elements.9
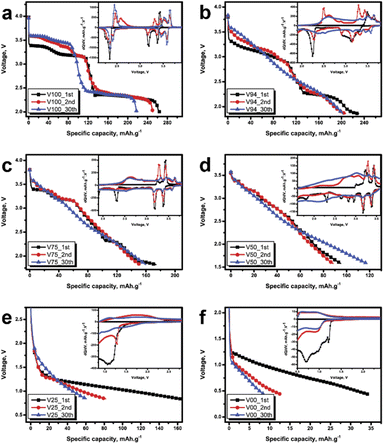 |
| | Fig. 4 The capacity-voltage of discharge curve of (a) 0%, (b) 25%, (c) 50%, (d) 75%, (e) 94%, and (f) 100% of V2O5, the inset of each graph show the dQ/dV – voltage curve. | |
The X-ray absorption spectroscopy (XAS) was an effective tool for investigating the oxidation state and determining the local structure.31 The X-ray absorption near edge structure (XANES) in Fig. 5 compares the fresh films (the condition name suffixed with i) and the electrode films after the cycling test (suffix name with f). The figure also shows the conventional spectra of V2O5 (vanadium's oxidation state was 5+) and VO2 (vanadium's oxidation state was 4+) to indicate the film's state. The weighting of the oxidation state between V5+ and V4+ in Fig. 5f was obtained by the linear combination fitting using the Athena software.21 According to the XANES, all vanadium compound films were almost V5+ when created and were altered to V4+ during cycle tests. According to XRD data, the oxidation state may have altered as a result of a structural change. The Li-ion was transported from the cathode to the anode during the charging process. Vanadium will undergo an increase in oxidation (from V4+ to V5+). Additionally, during the discharge process, the cathode's oxidation state will decrease (from V5+ to V4+). Vanadium's oxidation should be identical to its starting state if there are no changes (as should be the case for many V5+ states).32 By the way, we discovered that the oxidation state of vanadium in the 5+ state was lowered, suggesting that there is some Li-ion trapping in the structure and that this is causing a reduction in the capacity retention. Considering the glass addition state, it appears to have a higher V5+ content. This suggested that the Li-ion trapped in the structure was aided to release by glass mixture. Focusing on the XANES spectrum's pre-edge intensity, all of the spectra from after the cycling test have lower intensities than the spectra from before the test. According to the previous reports, the pre-edge intensity can be used to refer to the coordination structure.33 The pre-edge of the vanadium K-edge change was examined to determine whether it changed from a 4-fold co-ordinate to a 6-fold co-ordinate (as illustrated in schematic of Fig. 2a), which is consistent with the structural change seen in the XRD data.
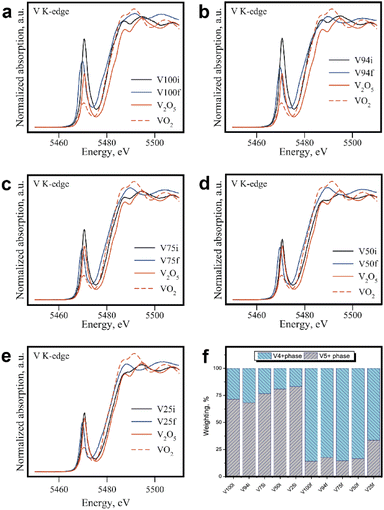 |
| | Fig. 5 The X-ray absorption near edge structure (XANES) at V-K-edge. Spectra compares the fresh films (the condition name suffixed with i) and the electrode films after the cycling test (suffix name with f) of (a) 100%, (b) 94%, (c) 75%, (d) 50%, (e) 25% of V2O5, and (f) the weighting of the oxidation state between V5+ and V4+ with was obtained by the linear combination fitting. | |
Conclusions
The Ni/Co-doped Li-borate glass can be used to improve the stability issue by adopting simple mixing procedures like ball-milling. Due to its strength and durability, glass can aid in strengthening. Glass plays the role of the rock in a concrete block in a vanadium-based system. According to the oxidation state change calculated using the XAS method, the glass can aid in maintaining more V5+ state, which would mean that more Li-ion was released in comparison to pure V2O5 condition. The XRD result demonstrates that during the cycling test, the electrode's structure changed. The results of the battery tests demonstrate that the addition of glass can shift the voltage-capacity curve from the stairway form of pure V2O5 to a straighter line. The reaction is amplified more clearly by the dQ/dV. In the case of pure V2O5, the redox reaction position does not change, but the form changes significantly to a rectangular shape when glass is introduced. Due to the supercapacitor behaviors, the rectangular shape may be more stable. This simple process allows for higher capacity, more reliable, and large-scale manufacture of vanadium-based battery electrodes.
Author contributions
S. S., J. P. and P. K. designed the experiments. S. S., J. P., A. M., J. L., N. C., Y. P.-A., and P. K. performed material preparation, structural characterization, and electrochemical measurements. S. S., J. P., P. S., S. R. and P. K. analysed the data. S. S. and P. K. co-wrote the paper. All authors discussed the results and commented on the manuscript.
Conflicts of interest
There are no conflicts to declare.
Acknowledgements
This research work has received funding supports from the NSRF via the Program Management Unit for Human Resources & Institutional Development, Research, and Innovation (grant number B05F640082) and National Research Council of Thailand (NRCT, Grant number N42A650253). Also, this work is supported by the Synchrotron Light Research Institute (Public Organization), the SUT-NANOTEC-SLRI XAS beamline (BL5.2), Thailand for the XAS facilities.
Notes and references
- J. Smart and S. Schey, SAE Int. J. Altern. Powertrains, 2012, 1, 27–33 CrossRef.
- Y. Miao, P. Hynan, A. von Jouanne and A. Yokochi, Energies, 2019, 12, 1074 CrossRef CAS.
- B. Nykvist, F. Sprei and M. Nilsson, Energy Policy, 2019, 124, 144–155 CrossRef.
- C. V. Subba Reddy, A. P. Jin, X. Han, Q. Y. Zhu, L. Q. Mai and W. Chen, Electrochem. Commun., 2006, 8, 279–283 CrossRef CAS.
- J. W. Fergus, J. Power Sources, 2010, 195, 939–954 CrossRef CAS.
- S. Afyon, F. Krumeich, C. Mensing, A. Borgschulte and R. Nesper, Sci. Rep., 2014, 4, 1–7 Search PubMed.
- G. C. Bond and P. König, J. Catal., 1982, 77, 309–322 CrossRef CAS.
- G. C. Bond and S. F. Tahir, Appl. Catal., 1991, 71, 1–31 CrossRef CAS.
- I. E. Wachs, Dalton Trans., 2013, 42, 11762–11769 RSC.
- C. Delmas, H. Cognac-Auradou, J. M. Cocciantelli, M. Ménétrier and J. P. Doumerc, Solid State Ionics, 1994, 69, 257–264 CrossRef CAS.
- Y. L. Cheah, V. Aravindan and S. Madhavi, ACS Appl. Mater. Interfaces, 2013, 5, 3475–3480 CrossRef CAS.
- C. Li, W. Yuan, C. Li, H. Wang, L. Wang, Y. Liu and N. Zhang, Chem. Commun., 2021, 57, 4319–4322 RSC.
- K. S. Kim, Y. Zhao, H. Jang, S. Y. Lee, J. M. Kim, K. S. Kim, J. H. Ahn, P. Kim, J. Y. Choi and B. H. Hong, Nature, 2009, 457, 706–710 CrossRef CAS PubMed.
- F. Qing, Y. Zhang, Y. Niu, R. Stehle, Y. Chen and X. Li, Nanoscale, 2020, 12, 10890–10911 RSC.
- J. lomon, J. Padchasri, A. Montreeuppathum, S. Siriroj, Y. Poo-arporn, S. Pinitsoontorn, P. Songsiriritth-igul, S. Rujirawat, P. Kidkhunthod and N. Chanlek, J. Alloys Compd., 2022, 911, 164994 CrossRef CAS.
- Y. Zhang, P. Wang, T. Zheng, D. Li, G. Li and Y. Yue, Nano Energy, 2018, 49, 596–602 CrossRef CAS.
- F. Kong, X. Liang, Y. Rao, X. Bi, R. Bai, X. Yu, D. Wang, Z. Chen, H. Jiang and C. Li, Chem. Eng. J., 2022, 442, 136228 CrossRef CAS.
- X. Han, G. Wu, J. Du, J. Pi, M. Yan and X. Hong, Chem. Commun., 2021, 58, 223–237 RSC.
- W. Bauer and D. Nötzel, Ceram. Int., 2014, 40, 4591–4598 CrossRef CAS.
- T. Marks, S. Trussler, A. J. Smith, D. Xiong and J. R. Dahn, J. Electrochem. Soc., 2011, 158, A51 CrossRef CAS.
- B. Ravel and M. Newville, J. Synchrotron Radiat., 2005, 12, 537–541 CrossRef CAS PubMed.
- A. Kayyar, J. Huang, M. Samiee and J. Luo, J. Visualized
Exp., 2012, 66, 4104 Search PubMed.
- Y. Lv, T. Mei, H. Gong, D. Wei, Z. Xing, Y. Zhu and Y. Qian, Micro Nano Lett., 2012, 7, 439–442 CrossRef.
- Y. Wang, C. Zhang and Z. Chen, J. Power Sources, 2015, 279, 306–311 CrossRef CAS.
- V. L. Bonavetti and E. F. Irassar, Cem. Concr. Res., 1994, 24, 580–590 CrossRef CAS.
- J. M. McGraw, J. D. Perkins, J. G. Zhang, P. Liu, P. A. Parilla, J. Turner, D. L. Schulz, C. J. Curtis and D. S. Ginley, Solid State Ionics, 1998, 113–115, 407–413 CrossRef CAS.
- I. Mjejri, M. Gaudon, G. Song, C. Labrugère and A. Rougier, ACS Appl. Energy Mater., 2018, 1, 2721–2729 CrossRef CAS.
- A. Gabryelczyk, S. Ivanov, A. Bund and G. Lota, J. Energy Storage, 2021, 43, 103226 CrossRef.
- E. Talaie, P. Bonnick, X. Sun, Q. Pang, X. Liang and L. F. Nazar, Chem. Mater., 2017, 29, 90–105 CrossRef CAS.
- W. G. Pell and B. E. Conway, J. Power Sources, 2001, 96, 57–67 CrossRef CAS.
- P. Iamprasertkun, A. Krittayavathananon, A. Seubsai, N. Chanlek, P. Kidkhunthod, W. Sangthong, S. Maensiri, R. Yimnirun, S. Nilmoung, P. Pannopard, S. Ittisanronnachai, K. Kongpatpanich, J. Limtrakul and M. Sawangphruk, Sci. Rep., 2016, 6, 1–12 CrossRef PubMed.
- B. Ji, W. Yao, Y. Zheng, P. Kidkhunthod, X. Zhou, S. Tunmee, S. Sattayaporn, H.-M. Cheng, H. He and Y. Tang, Nat. Commun., 2020, 11, 1125 CrossRef PubMed.
- J. Wong, F. W. Lytle, R. P. Messmer and D. H. Maylotte, Phys. Rev. B: Condens. Matter Mater. Phys., 1984, 30, 5596 CrossRef CAS.
|
| This journal is © The Royal Society of Chemistry 2022 |
Click here to see how this site uses Cookies. View our privacy policy here.  Open Access Article
 *a
*a
![[thin space (1/6-em)]](https://www.rsc.org/images/entities/char_2009.gif) :
:![[thin space (1/6-em)]](https://www.rsc.org/images/entities/char_2009.gif) dimethyl carbonate (DMC) (1
dimethyl carbonate (DMC) (1![[thin space (1/6-em)]](https://www.rsc.org/images/entities/char_2009.gif) :
:![[thin space (1/6-em)]](https://www.rsc.org/images/entities/char_2009.gif) 1) electrolyte, the coin cell was crimped with an ECCCM-160E-A crimping machine (MTI Corporation) at a 1 ton push. The voltage was measured immediately after cleaning the cell and set as the initial voltage. Galvanostatic cycling profiles of cells were performed in ambient temperature circumstances utilizing the battery testing equipment (Neware BTS4000) at 0.03 A g−1 current density.23,24 The cell's measuring voltage range was defined based on the beginning voltage, with the upper voltage limit equal to the initial voltage plus 1.6 volts and the lower voltage limit equal to the initial voltage minus 0.4 volts.
1) electrolyte, the coin cell was crimped with an ECCCM-160E-A crimping machine (MTI Corporation) at a 1 ton push. The voltage was measured immediately after cleaning the cell and set as the initial voltage. Galvanostatic cycling profiles of cells were performed in ambient temperature circumstances utilizing the battery testing equipment (Neware BTS4000) at 0.03 A g−1 current density.23,24 The cell's measuring voltage range was defined based on the beginning voltage, with the upper voltage limit equal to the initial voltage plus 1.6 volts and the lower voltage limit equal to the initial voltage minus 0.4 volts.


