 Open Access Article
Chitosan-based oxygen-doped activated carbon/graphene composite for flexible supercapacitors
Ruquan Ren ,
Yan Zhong
 ,
Xueyong Ren
 * and
Yongming Fan
 *
*
College of Material Science and Technology, Beijing Forestry University, Beijing, 100083, China. E-mail: rxueyong@bjfu.edu.cn; fanym@bjfu.edu.cn
First published on 12th September 2022
Abstract
Flexible supercapacitors have attracted widespread attention from many researchers as a type of portable energy storage device. As a unique carbon material, graphene has shown great potential in supercapacitor electrodes, mainly due to its large theoretical specific surface area, high conductivity and chemical stability. Therefore, reasonable design of graphene-based hydrogels with low cost, high specific surface area, and excellent mechanical properties is of great significance for flexible and wearable energy storage device applications. Oxygen-doped activated carbon/graphene composite hydrogels have been fabricated using a one-step hydrothermal method. In the hybrid hydrogel, the activated carbon derived from chitosan with high specific surface area and oxygen-containing groups which were introduced by using a facile room-temperature oxidation strategy with HNO3 are assembled into the framework of reduced graphene oxide (rGO) to effectively prevent the restacking of rGO nanosheets and result in high specific surface area and high conductivity of the composite hydrogels, thereby leading to an excellent energy storage performance. The optimal sample displayed a high specific capacitance of 375.7 F g−1 in 1 M H2SO4 electrolyte at a current density of 1 A g−1. Furthermore, the assembled flexible supercapacitor showed an ideal cycling stability of 83% after 5000 charge/discharge cycles at 10 A g−1. The facile strategy developed in this work is of significance for the performance improvement of supercapacitor electrode materials.
1. Introduction
Developing advanced and efficient energy materials is greatly demanded for portable electronic devices and electric vehicles.1 Supercapacitors as one of the power storage devices have been gaining wide attention with their excellent energy and power density, lifetime, environmental friendliness, and safety.2–5 Based on the charge storage mechanism, supercapacitors are classified as electrochemical double-layer capacitors (EDLCs), Faraday pseudocapacitors and hybrid supercapacitors.6,7 Carbonaceous materials such as graphene have been widely investigated in the fabrication of supercapacitors because of its unique properties like high specific surface area (≈2630 m2 g−1), conductivity, mechanical flexibility, and chemical stability.8–12 However, graphene nanosheets as electrode material are inclined to restack due to the strong interaction in the nanoscale, which causes the decrease of the surface area and limits the performance of supercapacitors.13–17 Construction of three-dimensional (3D) graphene frameworks such as graphene hydrogel, aerogel or foam can help to avoid the aggregation of graphene nanosheets and favourite the ion transportation within the interconnected 3D porous frameworks.18–23 Biomass-derived carbon materials have been extensively used as the electrode material for the great potential in energy storage. However, the prototype carbonized materials generally are not suitable for the fabrication of supercapacitor, because it is imperfect in electrochemical property compared to metals and conducting polymers. Activation and modification of carbon materials is usually necessary to disclose porous structure and upgrade the electrochemical performance. In general, the carbonized bio-material is mainly composed of carbon element with small amount of oxygen and hydrogen. The oxygen in the carbon material forms the groups like hydroxyl, ketone, or carboxyl, which are mainly at the edges of pores and considered active and on which the most chemical reactions can take place.24It has been reported that some heteroatoms, such as O, N, P, S, etc., can enhance the electronic conductivity, surface wettability or pseudo-capacitance due to the regulation of the carbon matrix during the formation of carbon materials.25–29 Therefore, modification of carbon materials by heteroatoms doping on activated carbon can increase the pseudocapacitance performance and the overall specific capacitance.
The combination of heteroatoms-doped activated carbon and graphene may act as the bi-functional electrode of the supercapacitor and collaboratively make the improvement of supercapacitors in energy storage performance. While functional groups are mainly responsible for the pseudocapacitive properties, the large surface area can be correlated with nanometre pores that contribute to the double-layer capacitance.30 On top of that, the combination of these two carbon materials can effectively prevent the agglomeration of graphene nano sheets and favourite the formation of high specific area and the ion conductivity of the activated carbon.
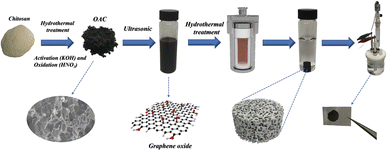
Various biomass-derived carbon materials have been extensively investigated in the past decades, and they can be readily converted into porous carbon with great potential in energy storage. Chitosan is the second most abundant carbon resources after cellulose with nitrogen element in the basic chemical structure, which could be one of the attractive precursors in the preparation of porous carbon.31 Chitosan can be used as a potential carbon precursor to prepare high value-added biomass-based porous carbon which can reduce the cost from the raw materials. However, the biomass carbon material has only a small market as commercial electrode material for supercapacitors. Its conductivity was restrained by the amorphous nanoporous carbon and the sp3 hybrid carbon–carbon bond, leading to low energy density and rate performance of the biomass-based porous carbon. The combination of chitosan-based activated carbon and graphene could solve this problem. Inspired by this conception, the activated carbon was prepared in this work with chitosan, by way of hydrothermal carbonization process (HTC) followed by KOH activation. Extra oxygen element contents were introduced by oxidation of activated carbon with HNO3. The activated carbon/graphene hydrogel with 3D structure for supercapacitors was prepared by using the chitosan-based activated carbon and graphene oxide via a hydrothermal process and the process of the composite hydrogel material is shown in Fig. 1. Results suggest that the oxygen-doped activated carbon (OAC)/graphene composite electrode exhibit substantially enhanced energy storage capability (specific capacitance of 375.7 F g−1 at 1 A g−1) compared to the graphene hydrogel (GH) electrode (specific capacitance of 206.6 F g−1). We believe that the as-prepared composite hydrogels highlight the great potential for the application in supercapacitors.
2. Experimental
2.1 Materials
Graphite powers (carbon content 99 wt%) were purchased from Nanjing XFNANO Materials Tech Co.,Ltd (Nanjing, China). Chitosan (low viscosity: <200 mPa s), acetic acid, concentrated sulfuric acid (H2SO4, 98%), sodium nitrate (NaNO3, AR), hydrochloric acid (HCl, AR, 36 to 38%), potassium permanganate (KMnO4, AR), potassium ferrate (KFeO4), hydrogen peroxide (H2O2, 30%), potassium hydroxide (KOH, GR, 95%) and nitric acid (HNO3) were purchased from Shanghai Macklin Biochemical Co., Ltd. (Shanghai, China).2.2 Preparation of graphene oxide
The graphene oxide (GO) was prepared according to a modified Hummers' method.32 Firstly, graphene powder (3 g) and NaNO3 (1.5 g) were mixed with 70 mL of 98% H2SO4 under stirring in an ice bath. Secondly, KMnO4 (9.0 g) and KFeO4 were added slowly to keep the suspension temperature lower than 20 °C, and continuing to stir for 2 h, then the reaction mixture was warmed to 35 °C for 3 h. 150 mL of deionized water was added dropwise, and the solution was stirred for 20 min at 90 °C. Then, Additional 500 mL water was added slowly, and further dropped into the mixture with 15 mL of 30% H2O2. The fulvous suspension was filtered and washed several times to neutral.2.3 Preparation of oxygen-doped activated carbon
Chitosan-based oxygen-doped activated carbon was generated by three steps of hydrothermal carbonization, chemical activation and nitrate oxidization. At first, 2.0 g chitosan was evenly dispersed into 100 mL acetic acid (2%) by magnetic stirring, then the mixture was transferred into a 150 mL Teflon-lined stainless-steel autoclave and heated to 210 °C for 8 h. After cooling to room temperature, the carbonized product was washed with ethanol and distilled water till neutral. Secondly, 3 g of chitosan carbon and 9 g of KOH were thoroughly ground, mixed and then activated using a tube furnace under the condition of 800 °C with N2 flow. The obtained activated carbon was neutralized with 1 M HCl solution, washed using deionized water to neutral pH and dried at 105 °C for 4 h. Thirdly, the obtained activated carbon (AC) powder was immersed into HNO3 (5 M) solution and oxidized for 24 h under stirring at room temperature. The sample was finally washed with distilled water and dried at 105 °C for 4 h to generate the powdered oxygen-doped activated carbon (OAC).2.4 Preparation of oxygen-doped activated carbon/graphene hydrogels composite electrode (GOACs)
The dispersion of GO (25 mL, 2 mg mL−1) was first prepared according to the literature.32 The ground oxygen-doped activated carbon (OAC) was added to GO aqueous dispersion and sonicated for 1 h. The mass ratio of GO to OAC is 2![[thin space (1/6-em)]](https://www.rsc.org/images/entities/char_2009.gif) :
:![[thin space (1/6-em)]](https://www.rsc.org/images/entities/char_2009.gif) 1, 3
1, 3![[thin space (1/6-em)]](https://www.rsc.org/images/entities/char_2009.gif) :
:![[thin space (1/6-em)]](https://www.rsc.org/images/entities/char_2009.gif) 1, 4
1, 4![[thin space (1/6-em)]](https://www.rsc.org/images/entities/char_2009.gif) :
:![[thin space (1/6-em)]](https://www.rsc.org/images/entities/char_2009.gif) 1. The mixture was then transferred into an autoclave (50 mL in volume) to proceed a hydrothermal treatment at 180 °C for 12 h and the hydrogel composite was obtained. It was then washed by deionized water. The products were named GOAC2, GOAC3, and GOAC4 followed the mass ratio of GO to OAC 2
1. The mixture was then transferred into an autoclave (50 mL in volume) to proceed a hydrothermal treatment at 180 °C for 12 h and the hydrogel composite was obtained. It was then washed by deionized water. The products were named GOAC2, GOAC3, and GOAC4 followed the mass ratio of GO to OAC 2![[thin space (1/6-em)]](https://www.rsc.org/images/entities/char_2009.gif) :
:![[thin space (1/6-em)]](https://www.rsc.org/images/entities/char_2009.gif) 1, 3
1, 3![[thin space (1/6-em)]](https://www.rsc.org/images/entities/char_2009.gif) :
:![[thin space (1/6-em)]](https://www.rsc.org/images/entities/char_2009.gif) 1, 4
1, 4![[thin space (1/6-em)]](https://www.rsc.org/images/entities/char_2009.gif) :
:![[thin space (1/6-em)]](https://www.rsc.org/images/entities/char_2009.gif) 1, respectively. In the same time, the GO hydrogel without OAC was prepared as control under the same condition and the pure graphene hydrogel obtained was labeled GH. For the fabrication of electrodes with different samples, the prepared hydrogels were cut into small pieces and pressed on 316L stainless steel fabrics (SSFs) (2.0 × 3.0 cm) under 10 MPa for 10 min. The obtained electrodes were immersed in the electrolyte of 1.0 M H2SO4 before the electrochemical test.
1, respectively. In the same time, the GO hydrogel without OAC was prepared as control under the same condition and the pure graphene hydrogel obtained was labeled GH. For the fabrication of electrodes with different samples, the prepared hydrogels were cut into small pieces and pressed on 316L stainless steel fabrics (SSFs) (2.0 × 3.0 cm) under 10 MPa for 10 min. The obtained electrodes were immersed in the electrolyte of 1.0 M H2SO4 before the electrochemical test.
2.5 Characterizations
The obtained hydrogel composites were freeze-dried at −60 °C under vacuum conditions before FESEM, XPS, BET and Raman measurement. The morphology and structure characterizations of the samples were observed by means of scanning electron microscopy (FESEM, Gemini300, ZEISS, Jena, Germany). The energy dispersive X-ray spectra (EDS) were collected on Oxford MAX-50 (Oxford, UK). Raman spectrum was measured on a Thermo DXR2xi Raman Spectrometer fitted with a 633 nm laser beam. XPS analysis was performed in a Thermo SCIENTIFIC ESCALAB 250Xi photoelectron spectrometer using Al Kα X-ray source (1486.6 eV). Brunauer–Emmett–Teller (BET) surface area measurements and Barrett–Joyner–Halenda (BJH) porous size distribution were performed at −196 °C by Nitrogen adsorption–desorption on a surface analyzer (ASAP2020).2.6 Electrochemical measurements
The electrochemical performance was measured in a three-electrode system on CHI660E workstation (Shanghai ChenHua Instruments Co, China), with the platinum electrode as counter electrode and the saturated calomel electrode (SCE) as the reference electrode. All electrochemical measurements were carried out using 1 M H2SO4 aqueous electrolyte. The cyclic voltammetry (CV) curves at different scan rates (5–100 mV s−1) and galvanostatic charge/discharge (GCD) curves at various current densities (0.5–10 A g−1) were collected. Electrochemical impedance spectroscopy (EIS) measurements were performed in a frequency range from 0.01 Hz to 100 kHz with an amplitude of 5 mV. The specific capacitance was calculated using the follow equation:
 | (1) |
For the supercapacitor device tested in two-electrode system, the specific capacitance was calculated using the follow equation:
 | (2) |
3. Results and discussion
3.1 Morphology observation
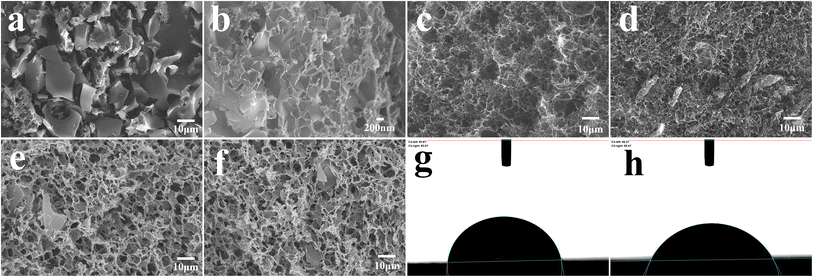
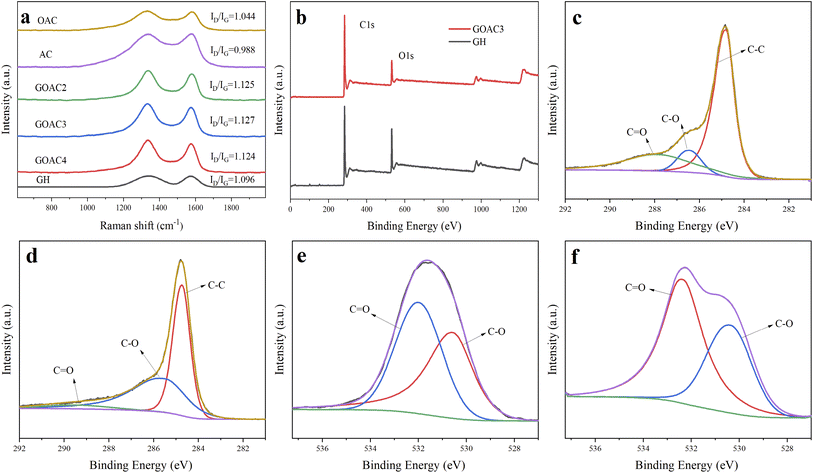
Fig. 2a–f displays the microstructure of the obtained material. It can be seen that OAC is powder like with pores-rich honeycomb microstructures on the surface (Fig. 2a and b), which is likely generated by the carbon activation process. The freeze-dried GH hydrogels (Fig. 2c) displayed the microstructure of 3D porous network with various sizes of micro-/meso-pores,33 which facilitates the transportation of electrolyte ions. The porous structure should be formed by the self-assembly effect in the hydrothermal process, in which GO sheets were reduced to rGO and self-assembled. The micro morphology of oxygen-doped activated carbon/graphene hydrogels composite GOAC3, GOAC4 and GOAC2 are shown in Fig. 2d–f. It can be seen that all the composite hydrogel contains the porous graphene nano sheets network with the active carbon wrapped in the middle. It can be speculated that, the 2D GO nanosheets self-assembled into the 3D network hydrogels during hydrothermal treatment and OAC particles were captured and wrapped into the graphene network, resulting in the feature of high specific surface area and improved electrochemical performance (Fig. 4a). As shown in Fig. 2g and h, the water contact angle of GH is 83.8, while the angle of RGO-water film is only 66.2, which suggesting that the GOAC3 electrode has better hydrophilicity and quite different functional groups on the surface which due to the introduction of OAC. As a result, hydrogel formed a much rougher network with interpenetrated nano- and micropores, which was beneficial to facilitate ion transport within the hydrogel electrode.The Raman spectra (Fig. 3a) showed the D and G bands of all samples, which were centered at ∼1335 and ∼1580 cm−1, respectively. The D band is attributed to the defect and disordered structure in carbon materials, while the G band corresponds to the crystalline graphite carbon.34 The intensity ratio of the D band to G band (R = ID/IG) is commonly used to illustrate the graphitization degree in the carbon materials.35 The calculated R values of OAC (1.044) was larger than that of AC (0.988), which suggests that the doping of oxygen-containing functional group would cause an increase in disorder degree. Moreover, the R values of GH, GOAC4, GOAC3, and GOAC2 were 1.096, 1.124, 1.127 and 1.125, respectively, indicating that the addition of OAC introduced more defect sites of the composite material.
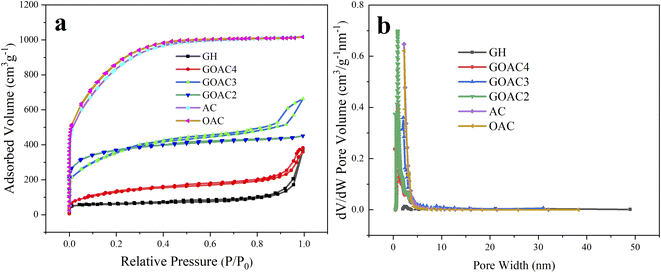 | ||
| Fig. 4 (a) N2 adsorption/desorption isotherms for all samples; (b) pore size distribution for all samples. | ||
The surface composition of GH and GOAC3 hydrogels were measured by XPS instrument. As seen in Fig. 3b, the total XPS spectrum shows a dominant graphitic C1s peak at 284.8 eV and O 1s peak at 531 eV. The C/O atomic ratio of sample GOAC3 (6.7) was higher than that of sample GH (4.1), due to that the carbon content of OAC is higher than that of GH. In Fig. 3c and d, the high-resolution spectrum of C1s showed three peaks at 284.8, 286.5 and 288 eV, which could be assigned to C–C, C–O and –C![[double bond, length as m-dash]](https://www.rsc.org/images/entities/char_e001.gif) O, respectively.36 Meanwhile, as shown in Fig. 3e and f, the two peaks in the high resolution spectrum of O1s at 530.2, and 532.4 eV could be contributed to C–O and C
O, respectively.36 Meanwhile, as shown in Fig. 3e and f, the two peaks in the high resolution spectrum of O1s at 530.2, and 532.4 eV could be contributed to C–O and C![[double bond, length as m-dash]](https://www.rsc.org/images/entities/char_e001.gif) O, respectively. These results indicated that the both graphene hydrogel and composite hydrogel contained oxygen-containing functional groups which is beneficial to Faraday reaction and increases specific capacitance. The textural parameters of AC, OAC, GH, GOAC4, GOAC3 and GOAC2 were analyzed by N2 adsorption/desorption isotherms at −196 °C. The shapes of the N2 adsorption/desorption isotherms curve and hysteresis can be used to study the size distribution, shape, and structure of the pore inside carbon materials. From the curves AC and OAC in Fig. 4a, we can see that a sharp increase was appeared at a P/P0 of 0.1, which was the characteristic of micropores of carbon material according to the classification of International Union of Pure and Applied Chemistry (IUPAC).37 For the sample GH, a steep increase in the slope at a high relative pressure (P/P0 >0.9) was obvious which can be attributed to capillary condensation in the mesopores. However, the GOAC3 presented a combination of these two characteristics, combined with the result of pore size distribution shown in Fig. 4b, it can be confirmed that OAC is very effectively doped into the three-dimensional graphene network structure and promote the development of micro porosity of the composite hydrogel. Moreover, Table 1 shows the detailed information regarding the physical properties of all samples. The addition of OAC to the GH greatly increases the specific surface area of the electrode material. Compared to GH, all the composite hydrogels showed higher specific capacitance values, the GOAC3 exhibited high values of specific surface area and total pore volume at 1257.6 m2 g−1 and 1.0266 cm3 g−1, respectively.
O, respectively. These results indicated that the both graphene hydrogel and composite hydrogel contained oxygen-containing functional groups which is beneficial to Faraday reaction and increases specific capacitance. The textural parameters of AC, OAC, GH, GOAC4, GOAC3 and GOAC2 were analyzed by N2 adsorption/desorption isotherms at −196 °C. The shapes of the N2 adsorption/desorption isotherms curve and hysteresis can be used to study the size distribution, shape, and structure of the pore inside carbon materials. From the curves AC and OAC in Fig. 4a, we can see that a sharp increase was appeared at a P/P0 of 0.1, which was the characteristic of micropores of carbon material according to the classification of International Union of Pure and Applied Chemistry (IUPAC).37 For the sample GH, a steep increase in the slope at a high relative pressure (P/P0 >0.9) was obvious which can be attributed to capillary condensation in the mesopores. However, the GOAC3 presented a combination of these two characteristics, combined with the result of pore size distribution shown in Fig. 4b, it can be confirmed that OAC is very effectively doped into the three-dimensional graphene network structure and promote the development of micro porosity of the composite hydrogel. Moreover, Table 1 shows the detailed information regarding the physical properties of all samples. The addition of OAC to the GH greatly increases the specific surface area of the electrode material. Compared to GH, all the composite hydrogels showed higher specific capacitance values, the GOAC3 exhibited high values of specific surface area and total pore volume at 1257.6 m2 g−1 and 1.0266 cm3 g−1, respectively.
| Sample | SBET (m2 g−1) | Smic (m2 g−1) | Vtot (cm3 g−1) | Vmic (cm3 g−1) |
|---|---|---|---|---|
| a Note: SBET: the specific surface area; Smic: the micropore surface area; Vtot: total pore volume; Vmic: micropore volume. | ||||
| AC | 2954.4 | 1616.1 | 1.57 | 0.7524 |
| OAC | 3003.7 | 1774.6 | 1.5725 | 0.8425 |
| GH | 199.8 | 117.3 | 0.5691 | 0.0596 |
| GOAC4 | 482.3 | 164.2 | 0.5926 | 0.1065 |
| GOAC3 | 1257.6 | 616.1 | 1.0266 | 0.4336 |
| GOAC2 | 1208.6 | 494.4 | 0.6969 | 0.2948 |
3.2 Electrochemical characterization
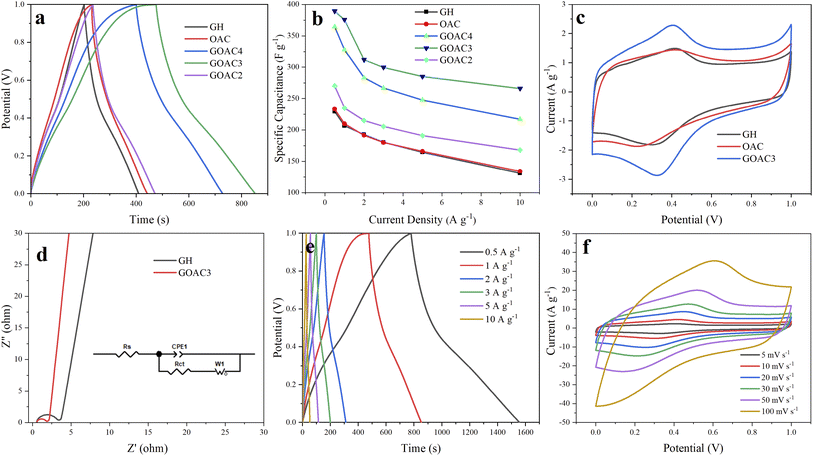
The electrochemical performance of GH and composite electrodes were tested by a three-electrode system using 1 M H2SO4 as an aqueous electrolyte. GCD curves of all electrodes at a current density of 1 A g−1 is illustrated in Fig. 5a. The GCD curves of RGO displayed the typical symmetrical triangles, which featured the dual-layer capacitor. The capacitive performance of oxygen-doped activated carbon/graphene composite are obviously improved compared to GH, and GOAC3 displayed the best in capacitive performance. The results of the specific capacitance of GH, OAC, GOAC4, GOAC3 and GOAC2 based on eqn (1) at current density of 1 A g−1 are 206.6 F g−1, 215.2 F g−1, 327.8 F g−1, 375.7 F g−1, 235 F g−1, respectively. The Mass loading of obtained electrodes of GH, OAC, GOAC4, GOAC3 and GOAC2 are 0.003 g, 0.0064 g, 0.0048 g, 0.0022 g and 0.0028 g, respectively. The specific capacitance of GOAC3 is higher than that of both GH and OAC which indicates that there is a synergistic interaction between the two carbon materials. Although GOAC3 composite electrode did not exhibit sufficiently high rate performance and cyclic stability, however, GOAC3 surpass most of reported graphene-based flexible electrodes (Table 2) in capacitance. The specific capacitances of GH, OAC, GOAC4, GOAC3 and GOAC2 at different current densities are shown in Fig. 5b. From 0.5 A g−1 to 10 A g−1, the capacitance retention of GH, OAC, GOAC4, GOAC3 and GOAC2 are 57.1%, 57.4%, 59.5%, 68.3% and 62.2%, respectively. The excellent rate capability of GOAC3 should be caused by the interconnected 3D porous framework. The introduction of OAC can significantly improve capacitive properties of graphene hydrogel material, however, when the ratio of GO to OAC increased from 3![[thin space (1/6-em)]](https://www.rsc.org/images/entities/char_2009.gif) :
:![[thin space (1/6-em)]](https://www.rsc.org/images/entities/char_2009.gif) 1 to 2
1 to 2![[thin space (1/6-em)]](https://www.rsc.org/images/entities/char_2009.gif) :
:![[thin space (1/6-em)]](https://www.rsc.org/images/entities/char_2009.gif) 1, the specific capacitance decreases, which should be a consequence of excessive addition of OAC reduced cross-linking between GO flakes.
1, the specific capacitance decreases, which should be a consequence of excessive addition of OAC reduced cross-linking between GO flakes.
| Electrode materials | Electrolyte | Specific capacitance | Rate performance | Cycling stability | Reference |
|---|---|---|---|---|---|
| RGO/MnOx@carbon hollow nanospheres | 6 M KOH | 355 F g−1 (1 A g−1) | — | 88% (0.5 A g−1) | 2 |
| Phytic acid/graphene hydrogel | 1 M H2SO4 | 248.8 F g−1 (1 A g−1) | 67.9% | 86.2% (5 A g−1) | 8 |
| Hierarchically ordered mesoporous carbon/graphene | 6 M KOH | 329.5 F g−1 (1 A g−1) | 49% | 96% (10 A g−1) | 41 |
| Highly porous carbon with a graphene nanoplatelet microstructure | 1 M H2SO4 | 311 F g−1 (1 A g−1) | 87% | 88% (5 A g−1) | 42 |
| Graphene hydrogels decorated with N, O co-doped carbon dots | 1 M H2SO4 | 335.1 F g−1 (1 A g−1) | 64% | 83.4% (5 A g−1) | 43 |
| Sodium anthraquinone-2-sulfonate composite graphene | 1 M H2SO4 | 387.4 F g−1 (1 A g−1) | 91.11% | 91.11% (10 A g−1) | 44 |
| Tetrahydroxy anthraquinone/graphene | 1 M H2SO4 | 259 F g−1 (1 A g−1) | 70.7% | 81.8% (1 mA cm−2) | 45 |
| Polypyrrole@RGO hydrogel | 1 M KNO3 | 340 F g−1 (1 A g−1) | 61.2% | 87.4% (3 A g−1) | 46 |
| OAC/graphene hydrogel | 1 M H2SO4 | 375.7 F g−1 (1 A g−1) | 68.3% | 83% (10 A g−1) | This work |
Fig. 5c is the CV test result of GH and GOAC3 electrodes. It is seen that GOAC3-based electrode displays a larger current and integral area than the corresponding GH-based electrode at the scan rate of 5 mV s−1, which imply that GOAC3 has a better electrochemical performance than GH electrode. There were obvious redox peaks both in two electrodes, which can be attributed to the oxygen-containing functional group of the OAC and GH, which provide extra pseudo-capacitance and improve the specific capacitance. The Nyquist plots are a powerful tool to better describe the intrinsic mechanism on the capacity characteristics of the composite electrodes.38 The electrochemical impedance of GH and GOAC3 were texted with EIS and the results are shown in Fig. 5d. In the low frequency region, both GH and GOAC3 electrodes display almost vertical lines, which indicate a relatively ideal charging and discharging process. The first point of intersection with the Z′ axis in the high-frequency region represents the ionic resistance of the electrolyte.39 These two electrodes nearly had the similar intercept (GH, 0.539 Ω; GOAC3, 0.566 Ω) because of the same electrolyte solution and current collector. Furthermore, the smaller diameter of the semicircle means the lower charge transfer resistance (Rct) of the carbon-based electrode. Inferred from the semicircle at high frequency region, GOAC3 electrode presented a little lowered electrode/electrolyte interfacial charge transfer resistance, the Rct of GOAC3 electrode was estimated to be 1.19 Ω which was smaller than that of GH (2.62 Ω)40 This result implies that the introduction of activated carbon material OAC into graphene hydrogel facilitated the ions transfer, which is caused by the high specific area and more space for ion storage and shifting in the porous structure.
Fig. 5e shows the GCD test result of GOAC3 electrode at different current densities of 0.5–10 A g−1. The results display the nearly triangular shape, indicating that GOAC3 electrode performs the standard double layer behavior with high coulombic efficiency. At different current densities from 0.5 A g−1 to 10 A g−1, the corresponding specific capacitances of GOAC3 electrode were 389.5 F g−1, 375.7 F g−1, 311.8 F g−1, 299.7 F g−1, 285 F g−1 and 266 F g−1, respectively, indicating a prominent rate capability of 68.3%. Moreover, as shown in Fig. 5f, the CV curves of the GOAC3 electrode at different scan rates showed slightly deformed rectangle shapes, which could be attributed to the oxygen-containing functional group of OAC and graphene sheets.
3.3 Capacitive performance and cycling stability
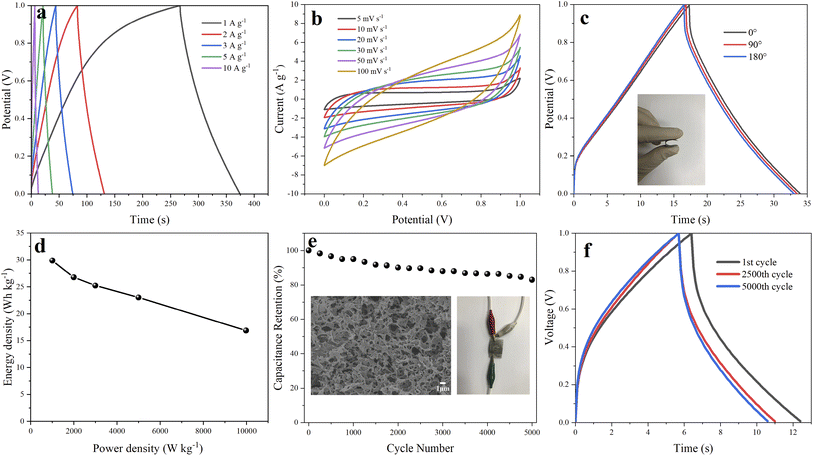
As shown in the inset of Fig. 6e, the GOAC3 hydrogel was cut into small rounds and pressed on rectangle 316 L stainless steel fabrics (2 × 3 cm), two of GOAC3 electrodes were fixed in parallel with PVA/H2SO4 electrolyte as separator. And the obtained flexible supercapacitor device was tested in two-electrode system. From the GCD curves (Fig. 6a) at current densities of 1–10 A g−1, GOAC3 achieves high gravimetric specific capacitances of 215.2 F g−1, 193.6 F g−1, 181.8 F g−1, 166 F g−1 and 122 F g−1 with a mass loading of 0.005 g (mass of single electrode material), respectively. The mild decrease of the capacitive retention in gel electrolyte compared with that in aqueous electrolyte can be attributed to the higher internal resistance and slower ions diffusion in gel electrolyte. From the CV curves (Fig. 6b), all CV curves present a quasi-rectangular shape, indicating the ultrafast and reversible capacitive response. Also, the shape of CV curves is well preserved even at the high scan rate of 100 mV s−1, suggesting the excellent rate capability and low contact resistance.47 As shown in Fig. 6c, the GCD performance of the supercapacitor with GOAC3 electrode remain insensitive with the bending action, indicating the device assembled is flexible enough for the general application without folding. Moreover, the structure morphology of GOAC3 after cycle tests was analyzed inserted in Fig. 6e. Most of the pore walls still cross-linked strongly. However, the pores partly happened to collapse or stack, leading gradually decreased electrode/electrolyte contact area, which might be responsible for the decayed performance upon cycling. Fig. 6d demonstrates the relationship between the energy density and power density. The energy density of the flexible solid-state device reaches 29.9 W h kg−1 at a power density of 1000.4 W kg−1, and maintains 16.9 W h kg−1 even at a higher power density of 9973.7 W kg−1. The performance of cycle life of supercapacitors is important for its practical application. Fig. 6e and f shows the testing results after charge/discharge cycles. It can be seen that the device assembled in this work displays a good cycling stability, and the capacitance retained about 83% after 5000 charge/discharge tests with a high current density of 10 A g−1.4. Conclusions
In summary, the Chitosan-based Oxygen-doped activated carbon/graphene composites were successfully constructed via a simple hydrothermal method for high-performance supercapacitor. The unique interconnected 3D networks based on integration of OAC and GH were found to present favorable features in the synergetic improvements of pore structure, surface area and charge transfer, which enables the composite hydrogels to display good electrochemical properties as supercapacitor electrodes. The GOAC3 displayed the excellent performance of specific capacitance of 375.7 F g−1 at a current density of 1 A g−1 and rate capability of 68.3%. The supercapacitor assembled with GOAC3 exhibited a good cycling stability with about 83% capacitance retention over 5000 charge/discharge cycles. The results in this work indicates that the combination of biomass-derived heteroatom-doped porous carbon and graphene shows a great potential to be used as advanced energy storage materials.Conflicts of interest
There are no conflicts to declare.Acknowledgements
This work was supported by the Fundamental Research Funds for Central Universities (BJFU-2021ZY28), the National Natural Science Foundation of China (no 61874111), Scientific and Technological Innovation Projects of Shandong Province (2019JZZY020223) and Hebei Province Central Finance Forest and Grass Science and Technology Promotion Demonstration Project (JI-TG [2022]004).Notes and references
- M. S. Whittingham, Proc. IEEE, 2012, 100, 1518–1534 CAS.
- M. Liu, M. Shi, W. Lu, D. Zhu, L. Li and L. Gan, Chem. Eng. J., 2017, 313, 518–526 CrossRef CAS.
- M. A. Azam, N. Dorah, R. N. A. R. Seman, N. S. A. Manaf and T. I. T. Kudin, Mater. Tech., 2014, 30, A14–A17 CrossRef.
- Y. Li, B. Guan, A. Maclennan, Y. Hu, D. Li, J. Zhao, Y. Wang and H. Zhang, Electrochim. Acta, 2017, 241, 395–405 CrossRef CAS.
- C. Karaman, O. Karaman, N. Atar and M. L. Yola, Phys. Chem. Chem. Phys., 2021, 23, 12807–12821 RSC.
- R. Liu, D. Wen, X. Zhang, D. Wang, Q. Yang, B. Yuan and W. Lü, Mater. Res. Express, 2018, 5, 065504 CrossRef.
- S. Saini, P. Chand and A. Joshi, Journal of Energy Storage, 2021, 39, 102646 CrossRef.
- X. Liu, S. Zou, K. Liu, C. Lv, Z. Wu, Y. Yin, T. Liang and Z. Xie, J. Power Sources, 2018, 384, 214–222 CrossRef CAS.
- D. Yang and C. Bock, J. Power Sources, 2017, 337, 73–81 CrossRef CAS.
- Y. Tian, Z. Yu, L. Cao, X. L. Zhang, C. Sun and D.-W. Wang, J. Energy Chem., 2021, 55, 323–344 CrossRef.
- C. Liu, Z. Yu, D. Neff, A. Zhamu and B. Z. Jang, Nano Lett., 2010, 10, 4863–4868 CrossRef CAS PubMed.
- S. P. Lee, G. A. M. Ali, H. H. Hegazy, H. N. Lim and K. F. Chong, Energy Fuels, 2021, 35, 4559–4569 CrossRef CAS.
- Y. Wang, Y. Wu, Y. Huang, F. Zhang, X. Yang, Y. Ma and Y. Chen, The Journal of Physical Chemistry C, 2011, 115, 23192–23197 CrossRef CAS.
- X. Song, Y. Chen, M. Rong, Z. Xie, T. Zhao, Y. Wang, X. Chen and O. S. Wolfbeis, Angew. Chem., Int. Ed. Engl., 2016, 55, 3936–3941 CrossRef CAS.
- F. Li, X. Wang and R. Sun, J. Mater. Chem. A, 2017, 5, 20643–20650 RSC.
- W. Zhang, Z. Chen, X. Guo, K. Jin, Y. Wang, L. Li, Y. Zhang, Z. Wang, L. Sun and T. Zhang, Electrochim. Acta, 2018, 278, 51–60 CrossRef CAS.
- X. Shi, S. Zhang, X. Chen, T. Tang and E. Mijowska, Carbon, 2020, 157, 55–63 CrossRef CAS.
- M. P. Down and C. E. Banks, ACS Appl. Energy Mater., 2018, 1, 891–899 CrossRef CAS.
- L. Wang, X. Ye, P. Zhao, H. Jiang, Y. Zhu, Z. Wan, G. Rao, S. You, G. Zeng, J. Fu and C. Jia, Appl. Surf. Sci., 2019, 467–468, 949–953 CrossRef CAS.
- S. Kumar, G. Saeed, L. Zhu, K. N. Hui, N. H. Kim and J. H. Lee, Chem. Eng. J., 2021, 403 Search PubMed.
- H. Zhao, T. Jiao, L. Zhang, J. Zhou, Q. Zhang, Q. Peng and X. Yan, Sci. China Mater., 2015, 58, 811–818 CrossRef CAS.
- J. Bai, R. Wang, M. Ju, J. Zhou, L. Zhang and T. Jiao, Cell Rep. Phys. Sci., 2021, 2, 100623 CrossRef CAS.
- J. Bai, R. Wang, X. Wang, S. Liu, X. Wang, J. Ma, Z. Qin and T. Jiao, Sci. China Mater., 2021, 64(4), 942–952 CrossRef CAS.
- J. Collins, T. Ngo, D. Qu and M. Foster, Carbon, 2013, 57, 174–183 CrossRef CAS.
- W. Zhou, S. Lei, S. Sun, X. Ou, Q. Fu, Y. Xu, Y. Xiao and B. Cheng, J. Power Sources, 2018, 402, 203–212 CrossRef CAS.
- M. Chen, D. Yu, X. Zheng and X. Dong, Journal of Energy Storage, 2019, 21, 105–112 CrossRef.
- Z.-Y. Yu, L.-F. Chen, L.-T. Song, Y.-W. Zhu, H.-X. Ji and S.-H. Yu, Nano Energy, 2015, 15, 235–243 CrossRef CAS.
- L. Xia, H. Huang, Z. Fan, D. Hu, D. Zhang, A. S. Khan, M. Usman and L. Pan, Mater. Des., 2019, 182 Search PubMed.
- Y. Gao, J. Zhang, X. Luo, Y. Wan, Z. Zhao, X. Han and Z. Xia, Nano Energy, 2020, 72 CAS.
- S. A. Evlashin, F. S. Fedorov, P. V. Dyakonov, Yu. M. Maksimov, A. A. Pilevsky, K. I. Maslakov, Yu. O. Kuzminova, Yu. A. Mankelevich, E. N. Voronina, S. A. Dagesyan, V. A. Pletneva, A. A. Pavlov, M. A. Tarkhov, I. V. Trofimov, V. L. Zhdanov, N. V. Suetin and I. S. Akhatov, J. Phys. Chem. Lett., 2020, 11, 4859–4865 CrossRef CAS.
- H. Ababneh and B. H. Hameed, Int. J. Biol. Macromol., 2021, 186, 314–327 CrossRef CAS PubMed.
- J. Chen, B. Yao, C. Li and G. Shi, Carbon, 2013, 64, 225–229 CrossRef CAS.
- J. Yu, J. Wu, H. Wang, A. Zhou, C. Huang, H. Bai and L. Li, ACS Appl. Mater. Interfaces, 2016, 8, 4724–4729 CrossRef CAS PubMed.
- C. Su, C. Pei, B. Wu, J. Qian and Y. Tan, Small, 2017, 13, 1702809 Search PubMed.
- L. M. Malard, M. A. Pimenta, G. Dresselhaus and M. S. Dresselhaus, Phys. Rep., 2009, 473, 51–87 CrossRef CAS.
- R. Al-Gaashani, A. Najjar, Y. Zakaria, S. Mansour and M. A. Atieh, Ceram. Int., 2019, 45, 14439–14448 CrossRef CAS.
- T.-X. Shang, M.-Y. Zhang and X.-J. Jin, RSC Adv., 2014, 4, 39037–39044 RSC.
- X. Zhang, J. Zhao, X. He, Q. Li, C. Ao, T. Xia, W. Zhang, C. Lu and Y. Deng, Carbon, 2018, 127, 236–224 CrossRef CAS.
- B. Qian, G. Wang, Z. Ling, Q. Dong, T. Wu, X. Zhang and J. Qiu, Adv. Mater. Interfaces, 2015, 2, 16 Search PubMed.
- X. Zhang, X. Cui, C. Lu, H. Li, Q. Zhang, C. He and Y. Yang, Chem. Eng. J., 2020, 401, 126031 CrossRef CAS.
- Y. Song, Z. Li, K. Guo and T. Shao, Nanoscale, 2016, 8, 15671–15680 RSC.
- C. Shi, L. Hu, K. Guo, H. Li and T. Zhai, Adv. Sustainable Syst., 2017, 1, 1600011 CrossRef.
- L. Xu, X. Dun, J. Zou, Y. Li, M. Jia, L. Cui, J. Gao and X. Jin, J. Electrochem. Soc., 2018, 165, A2217–A2224 CrossRef CAS.
- C. Zhu, W. Zhang, G. Li, C. Li and X. Qin, J. Alloys Compd., 2021, 862 Search PubMed.
- L. Xu, R. Shi, H. Li, C. Han, M. Wu, C.-P. Wong, F. Kang and B. Li, Carbon, 2018, 127, 459–468 CrossRef CAS.
- X. Zhang, J. Zhang, Y. Chen, K. Cheng, J. Yan, K. Zhu, K. Ye, G. Wang, L. Zhou and D. Cao, J. Colloid Interface Sci., 2019, 536, 291–299 CrossRef CAS PubMed.
- X. Zhang, H. Li, W. Zhang, Z. Huang, C. Tsui, C. Lu, C. He and Y. Yang, Electrochim. Acta, 2019, 301, 55–62 CrossRef CAS.
| This journal is © The Royal Society of Chemistry 2022 |

