DOI:
10.1039/D2RA03968K
(Paper)
RSC Adv., 2022,
12, 25623-25632
Adsorption of polycyclic aromatic hydrocarbons over CuZnFeAl–LDH modified by sodium dodecyl sulfate†
Received
28th June 2022
, Accepted 24th August 2022
First published on 9th September 2022
Abstract
Polycyclic aromatic hydrocarbons (PAHs) have received extensive attention due to being highly toxic, mutagenic, and carcinogenic organic pollutants. As a result, a series of adsorbents have been designed and developed to solve the problem. In this paper, CuZnFeAl–S has been explored as a highly efficient adsorbent for PAHs. First, CuZnFeAl–LDH was prepared using a coprecipitation method and then calcined at 500 °C to obtain CuZnFeAlO. Finally, CuZnFeAl–S was prepared by modifying CuZnFeAlO with sodium dodecyl sulfate (SDS). The physical and chemical properties of the adsorbents were characterized by XRD, N2 adsorption–desorption, SEM, ICP, FT-IR, TG-DSC, and IGC; subsequently their adsorption performance was investigated. The results show that the surface properties of CuZnFeAl–S changed from hydrophilic to hydrophobic after SDS modification, which enhanced the adsorption of PAHs obviously. The removal of naphthalene and phenanthrene on CuZnFeAl–S reached 97.3% and 90.3%, respectively. And the adsorption process of naphthalene and phenanthrene conforms to Langmuir adsorption and Freundlich adsorption, respectively. Besides, the adsorption thermodynamics indicate that the adsorption of PAHs was a spontaneous exothermic reaction. The highly efficient PAH adsorption performance of CuZnFeAl–S is the synergistic result of various molecule interactions, such as hydrogen bonding, π–π interactions, and electrostatic attraction.
1. Introduction
Polycyclic aromatic hydrocarbons (PAHs) are typical persistent organic pollutants with high toxicity, mutagenicity, carcinogenicity and hydrophobicity.1,2 Sixteen PAHs have been identified as priority pollutants by the US Environmental Protection Agency on account of their threat to health and the environment.3 In recent years, many materials have been developed for the adsorption of PAHs, including layered double hydroxide (LDH),4,5 activated carbon,6,7 biochar,8,9 graphene10 and montmorillonite.11
Hydrotalcite-like compounds (HTLcs) are typical alkali metal adsorbents with a common type of layered material consisting of positively charged lamellae and exchangeable interlayer anions. HTLcs are widely used in the field of adsorption because of their large specific surface area and adjustable laminate, which are easy to modify.12 Composite metal oxide, obtained after calcination at 250–500 °C, possesses a unique “memory effect.” Layered double oxide has a large specific surface area and thermodynamic stability.13,14 The topological effect of cationic laminates can accommodate high molecular weight organic/inorganic anions between the layers. HTLcs modified by a surfactant enhance hydrophobicity, making them suitable for the adsorption of substances, such as organic pollutants in the environment.15 Huang et al. evaluated the effect of Ni–Fe LDH catalyzing bisphenol A under optimized conditions, and finally achieved 56% and 68% removal of TOC and COD.4 Dai et al. applied CuNiAl–LDH in the reaction of hydroxylation of phenol, and the conversion of phenol could reach 62.8% under the optimal reaction conditions.5 Kuang et al. found that activated carbon modified by sodium dodecyl sulfate (SDS) can significantly improve the adsorption performance of methylene blue, and the modified activated carbon is twice as good as the activated carbon. The high adsorption capacity can be attributed to the hydrophobic group of the surfactant, which is expected to bind to the hydrophobic surface of activated carbon.16 Demissie et al. studied adsorbents based on fresh agglomerates of Al30 nanoclusters modified with SDS (SDS–PAC30) to simultaneously remove multiple synthetic dyes and suspensions from water. Under optimal conditions, the dye removal extent is over 95%, and the turbidity removal extent is over 98%.17 In addition, the surface properties of materials are generally reflected by specific surface area and surface dispersion components, and IGC can reflect the surface properties parameters of materials.18 IGC provides a value of γsd, which is similar to the measured value of the contact angle, but can more accurately reflect wettability.19 The specific composition of surface energy is related to the sites and functional groups of polar molecules, so it is considered that the surface wettability can be modified.20 The smaller the surface dispersion component is, the better the stability of the material is. When the material is used as an adsorbent, it is more conducive to adsorb some other substances.
The purpose of this study was to investigate the adsorption of PAHs from an aqueous solution using CuZnFeAl–LDH and its modified materials. The successful modification of CuZnFeAl–LDH benefits from the memory properties of the material. The LDH intercalated with SDS can effectively increase the layer spacing, change the surface properties of the adsorption material, change its surface from hydrophilic to hydrophobic, and enhance the adsorption effect of hydrophobic organic compounds.21 The solubility of low molecular weight PAHs in water is much greater than that of high molecular weight PAHs,22 so low molecular weight bicyclic naphthalene and tricyclic phenanthrene were selected as model compounds to explore the adsorption effect of modified LDH. LDH intercalated with SDS was investigated considering the reaction kinetics and adsorption equilibrium.
2. Experimental methods
2.1 Preparation and modification of adsorbents
CuZnFeAl–LDH was prepared using the coprecipitation method. First, solution A contained 150 mL of 0.012 mol L−1 Cu(NO3)2, 0.048 mol L−1 Zn(NO3)2, 0.010 mol L−1 Fe(NO3)3 and 0.010 mol L−1 Al(NO3)3. Solution B contained 150 mL of 0.15 mol L−1 NaOH and 0.10 mol L−1 Na2CO3. At 60 °C, solution A and solution B were dropped into the reaction flask and maintained at pH 9–10. The reaction was allowed to proceed for 6 h, followed washing with deionized water until neutral and drying for 8 h at 60 °C. The resultant adsorbent was recorded as CuZnFeAl–LDH.
CuZnFeAl–LDH was calcined for 6 h at 500 °C to obtain CuZnFeAlO. 0.5 mol L−1 SDS and CuZnFeAlO were added into a 100 mL three-necked flask stirring 24 h, following filtering and washing to obtain CuZnFeAl–S.
2.2 Characterizations
XRD analysis was performed on a Bruker D8 Advance powder X-ray diffractometer using Cu Kα radiation (λ = 0.154 nm) at 40 kV and 200 mA, a scanning rate of 20° min−1 and 2θ ranging from 0° to 80°. Brunauer–Emmett–Teller (BET) and nitrogen physical adsorption–desorption parameters of the sample were determined by nitrogen adsorption data obtained with a Micromeritics ASAP 2020 analyzer, and the pretreatment was degassing for 2 h at 200 °C. The metal content in the sample was determined using inductively coupled plasma atomic emission spectrometry on a PerkinElmer ICP-OES optima 3000 instrument. The morphologies of the adsorbents were observed by SEM using Hitachi S-4800 instruments. Fourier transform infrared (FT-IR) spectra were obtained on a nexus 870 FT-IR spectrometer. An STA 499 F3-type synchronous thermal analyzer was used to determine the thermal stability of the sample. The measurement range was from 60 to 800 °C, rising at a rate of 10 °C min−1. Inverse gas chromatography (IGC, GC-9860) technology was used to measure the surface dispersion energy component (γsd).
2.3 Adsorption tests
A certain amount of adsorbents was added to a 1000 mL beaker, solution containing 500 mL of solution at certain concentrations of naphthalene and phenanthrene. Samples were taken every 5 minute and were extracted with equal volumes of cyclohexane and dichloromethane. The supernatant was analyzed using gas chromatography with an external standard method. The column was an Rtx-1701. The analysis conditions for naphthalene are as follows: the initial temperature was 50 °C, which was applied for 1 min. Then, the temperature was increased to 180 °C at 20 °C min−1 for 2 min. The gasification chamber temperature was 120 °C and the detector temperature was 205 °C. The analysis conditions for phenanthrene: the inlet temperature was set to 260 °C, and the initial column temperature was set to 80 °C. After 1 min, the temperature was increased to 200 °C at 20 °C min−1, where it was maintained for 2 min.
The equation for calculating the removal (Rem):
| |
 | (1) |
The equation for calculating the adsorption capacity:
| |
 | (2) |
c0: initial concentration of solution (mg L
−1),
ct: concentration of solution at adsorption time
t (mg L
−1),
m: mass of adsorbent (mg),
V: volume of solution (L)
2.4 Adsorption kinetics
To investigate the adsorption kinetics of naphthalene and phenanthrene solutions on the adsorbent CuZnFeAl–S, a pseudo-first-order kinetic model (3) was used to fit and analyze the kinetic data.| |
k = [ln![[thin space (1/6-em)]](https://www.rsc.org/images/entities/char_2009.gif) qe − ln(qe − qt)]/t qe − ln(qe − qt)]/t
| (3) |
qt is the adsorption capacity at time t in the solution (mg g−1), qe is the adsorption capacity at adsorption equilibrium (mg g−1), t is the adsorption time, and k is the adsorption kinetic constant.| |
 | (4) |
ce is the concentration in the solution at adsorption equilibrium (mg L−1), Kf, n is the Freundlich constant, Qmax is the maximum adsorption capacity (mg g−1), and b is the Langmuir constant related to adsorption capacity (L mg−1).
2.5 Adsorption thermodynamics
The relationship between adsorption temperature and capacity was explored. The thermodynamic parameters ΔG, ΔH and ΔS were obtained using the following eqn (6)–(8).| |
ΔG = −RT![[thin space (1/6-em)]](https://www.rsc.org/images/entities/char_2009.gif) ln ln![[thin space (1/6-em)]](https://www.rsc.org/images/entities/char_2009.gif) KD KD
| (7) |
| |
 | (8) |
qe is the equilibrium adsorption capacity of the adsorbent (mg g−1), ce is the equilibrium concentration (mg L−1), R is the gas molar constant, and T is the reaction temperature (K).
2.6 IGC analysis
Using N2 as the carrier gas, n-alkanes (n-hexane, n-heptane, n-octane and n-nonane) were used to determine hydrotalcite and surface dispersion components under a series of surface coverages. The carrier gas flow was 30 mL min−1, the detector temperature was 200 °C, the vaporization chamber temperature was 120 °C and the column temperature range was 80–110 °C. Preparation of the chromatographic column: a stainless steel column was selected as the chromatographic column, with a length of 15 cm and an inner diameter of 0.2 cm. The chromatographic column was cleaned with acetone, filled with CuZnFeAl–LDH, CuZnFeAlO and CuZnFeAl–S after drying, and aged with N2 for 2 h at 180 °C.
The IGC technique involves the passage of several solvent probes with different properties under infinite dilution on a steel column containing the material to be measured. The time required for different probes to pass through the chromatographic column is directly related to the surface characteristics of the material.
| |
 | (9) |
| |
RT![[thin space (1/6-em)]](https://www.rsc.org/images/entities/char_2009.gif) ln(Vn) = (γsd)0.52αN(γdl)0.5 + C ln(Vn) = (γsd)0.52αN(γdl)0.5 + C
| (10) |
tr is the retention time of probe molecule,
t0 is the air retention time,
T is the column temperature,
F is the carrier gas flow rate,
J is the James–Martin pressure correction factor,
TC is the indoor ambient temperature,
R is the ideal gas constant, and
C is the constant related to the stationary phase,
γsd is the dispersive component of solid surface energy,
γdl is the dispersive component of liquid surface energy, and
N is Avogadro constant,
α is the cross-sectional area of the probe molecule.
3. Results and discussion
3.1 Structural characterizations
The XRD patterns of the adsorbents are shown in Fig. 1. Characteristic peaks appear in the (003), (006), (009), (015), (018), (110) and (113) planes, confirming the formation of the hydrotalcite layered structure (JCPDS 089-0460).24 The spacing of the CuZnFeAl–LDH (003) plane (d003) is about 0.76 nm, which is consistent with the ionic radius of CO32−. This result indicates that carbonate acts as the main anion between the layers due to the presence of Na2CO3 in the synthesis. After calcination at 500 °C, the peak of CuZnFeAlO appeared at 2θ = 56.62° is that of spinel ZnFe2O4 (JCPDS no. 22-1012).25 Besides, the characteristic peak at 2θ = 31.70°, 47.46°, 62.54° and 68.06°, corresponding to the hexagonal planar ZnO (JCPDS no. 36-1451).26 Furthermore, characteristic peaks corresponding to CuO were also found. It is worth noticing that no diffraction peaks assigned to Al2O3 can be observed, which means that the Al2O3 phase is amorphous.27 After SDS intercalation of CuZnFeAl–LDH, the (003) peak shifted to a smaller angle. The layer spacing of layered materials can be calculated using the Bragg equation. The crystal plane spacing d003 of CuZnFeAl–S increases to 2.63 nm, indicating that DS− has been successfully inserted into the interlayer.28 The chain length of the SDS molecule is 2.08 nm,29 and the angle of SDS insertion into the LDH interlayer calculated using trigonometry is 65°.
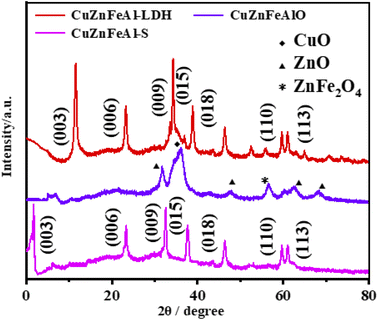 |
| | Fig. 1 XRD patterns of adsorbents. | |
Fig. 2 shows that CuZnFeAl–LDH presents a flake structure, which is relatively regular and has less surface impurities, which is consistent with the characterization results of XRD, indicating that LDH was successfully synthesized. After calcining, CuZnFeAlO (Fig. 2(b)) did not show a fixed morphology because the laminate collapsed and the particle size decreased during roasting, resulting in partial agglomeration. Fig. 2(c) shows the CuZnFeAl–S obtained after intercalation modification, the layered structure and the carbon on the surfactant are connected to form a fluffy structure.30
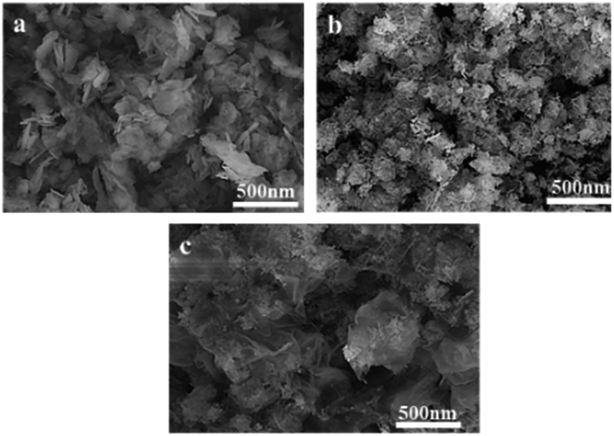 |
| | Fig. 2 SEM patterns of adsorbents. (a) CuZnFeAl–LDH (b) CuZnFeAlO (c) CuZnFeAl–S. | |
Fig. 3 shows the N2 adsorption–desorption isotherms of the adsorbents, and the type IV isotherm with an H3 hysteresis loop under relative pressures of 0.4–1.0, which indicates that the material is a mesoporous structure.31 Table 1 shows the specific surface area and element analysis data of the three adsorbents. The ICP results showed that the metal element content of the adsorbents before and after modification was close to the theoretical value. The specific surface area test results show that the specific surface area and pore volume of the CuZnFeAlO obtained after calcination increase significantly. This may be due to the collapse of part of the laminate during the calcination process, the decrease of the grain size, however the increase of the specific surface area and pore volume, which are consistent with the SEM. However, the specific surface area of CuZnFeAl–S is between CuZnFeAl–LDH and CuZnFeAlO, which may be caused by the use of SDS intercalation to cause part of the surface pores of CuZnFeAlO to be blocked by SDS.
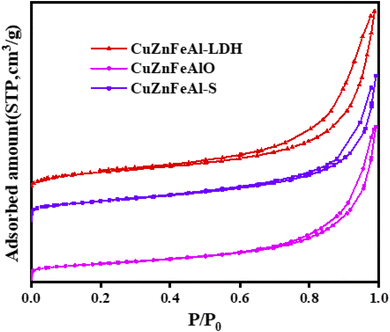 |
| | Fig. 3 N2 adsorption–desorption isotherms of different adsorbents. | |
Table 1 The specific surface area and element analysis of the adsorbenta
| Samples |
(Cu/Zn/Fe/Al) molar ratios |
SBET/m2 g−1 |
VT/cm3 g−1 |
| SBET-BET surface area, VT-total pore volume, P/P0 = 0.990. |
| CuZnFeAl–LDH |
15.15/60.50/12.21/12.14 |
91 |
0.46 |
| CuZnFeAlO |
14.86/61.49/11.89/11.76 |
125 |
0.87 |
| CuZnFeAl–S |
15.02/60.53/12.27/12.18 |
103 |
0.52 |
FT-IR spectra (Fig. 4) show two broad bands around 3460 and 1648 cm−1, attributed to the stretching vibration and the bending vibration of interlayer water molecules,32 the spectral band of CuZnFeAlO is narrowed, indicating that part of the hydroxyl groups is effectively removed after calcination. The vibrational peak appearing around 1388 cm−1 is caused by the asymmetric stretching vibration of carbonate. The peak intensity of CuZnFeAl–S is lower, indicating a lower content of interlayer pillar ions CO32−. The peaks at 2935 and 2857 cm−1 are caused by the stretching vibration of the C–H bond in νCH3, the vibration peaks at 1233, 1060 and 983 cm−1 are caused by –SO3.33 The results show that SDS was successfully introduced into CuZnFeAlO, which indicates that SDS successfully entered the LDH interlayer.34 At the same time, these changes prove the geometric perturbation of functional groups (–SO3). The existence of the S![[double bond, length as m-dash]](https://www.rsc.org/images/entities/char_e001.gif) O bond indicates that there is a hydrogen bond between LDH and the sulfate groups, which is electrostatically bound to the metal on the surface of LDH, i.e., S
O bond indicates that there is a hydrogen bond between LDH and the sulfate groups, which is electrostatically bound to the metal on the surface of LDH, i.e., S![[double bond, length as m-dash]](https://www.rsc.org/images/entities/char_e001.gif) O⋯H–O–M (M = Cu, Zn, Fe or Al).35
O⋯H–O–M (M = Cu, Zn, Fe or Al).35
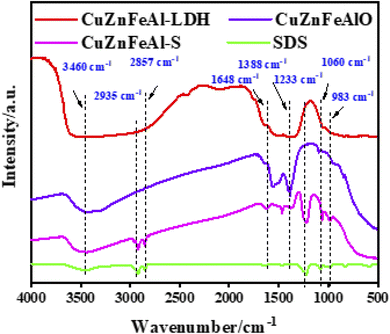 |
| | Fig. 4 FT-IR spectra of adsorbents. | |
After a series of probe molecules reached adsorption–desorption equilibrium on the surface of various hydrotalcites, the retention time of the probe molecules was measured, and Vn of the probe molecules in the stationary phase was calculated using eqn (9).23 γsd was obtained by eqn (10) and RT![[thin space (1/6-em)]](https://www.rsc.org/images/entities/char_2009.gif) ln(Vn) − 2αNγsd. The results are shown in Table 2, the measured γsd is low, indicating that the physical adsorption of PAHs in the LDH adsorption solution occurs.36 As shown in Fig. 5, it can be seen that the adsorbents show a good linear relationship. With the increase in temperature, the value of γsd decreases, indicating that the distance between the probe molecule and adsorbent decreases with the increase in temperature, and that γsd is inversely proportional to the sixth power of molecular spacing. During the drying process, the adjacent particles gather together due to hydrogen bonding. When interacting with the probe molecule, polarization increases the ability of the probe to polarize. Compared with CuZnFeAl–LDH, the γsd of CuZnFeAl–S decreased, which may be CuZnFeAl–LDH laminate is rich in hydroxyl groups, strong polarity, and easy to polarize probe molecules. SDS-modified LDH changes hydrotalcite from hydrophilic to hydrophobic. Meanwhile, according to Dorris and Gray,37 the theory shows that the modified LDH reduces the contribution of a single methylene on the surface of hydrotalcite to the adsorption free energy. Surfactant modification makes the surface of hydrotalcite almost covered by SDS, and the modified LDH γsd decreases greatly with the increase in temperature, indicating that the modified LDH surface γsd is more sensitive to the change in temperature.
ln(Vn) − 2αNγsd. The results are shown in Table 2, the measured γsd is low, indicating that the physical adsorption of PAHs in the LDH adsorption solution occurs.36 As shown in Fig. 5, it can be seen that the adsorbents show a good linear relationship. With the increase in temperature, the value of γsd decreases, indicating that the distance between the probe molecule and adsorbent decreases with the increase in temperature, and that γsd is inversely proportional to the sixth power of molecular spacing. During the drying process, the adjacent particles gather together due to hydrogen bonding. When interacting with the probe molecule, polarization increases the ability of the probe to polarize. Compared with CuZnFeAl–LDH, the γsd of CuZnFeAl–S decreased, which may be CuZnFeAl–LDH laminate is rich in hydroxyl groups, strong polarity, and easy to polarize probe molecules. SDS-modified LDH changes hydrotalcite from hydrophilic to hydrophobic. Meanwhile, according to Dorris and Gray,37 the theory shows that the modified LDH reduces the contribution of a single methylene on the surface of hydrotalcite to the adsorption free energy. Surfactant modification makes the surface of hydrotalcite almost covered by SDS, and the modified LDH γsd decreases greatly with the increase in temperature, indicating that the modified LDH surface γsd is more sensitive to the change in temperature.
Table 2 γsd values of adsorption versus temperature
| γsd (mJ m−2) |
383.15 K |
373.15 K |
363.15 K |
353.15 K |
| CuZnFeAl–S |
15.87 |
19.38 |
24.85 |
29.50 |
| CuZnFeAlO |
28.43 |
31.31 |
32.25 |
35.69 |
| CuZnFeAl–LDH |
35.56 |
34.29 |
37.09 |
39.16 |
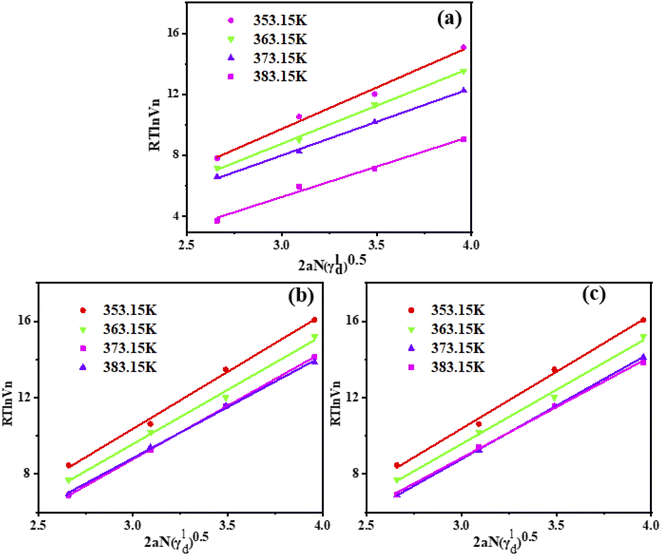 |
| | Fig. 5 Changes of RT![[thin space (1/6-em)]](https://www.rsc.org/images/entities/char_2009.gif) ln ln![[thin space (1/6-em)]](https://www.rsc.org/images/entities/char_2009.gif) Vn on adsorbent surface with the number of carbon atoms contained in n-alkanes at different temperatures. (a) CuZnFeAl–S (b) CuZnFeAlO (c) CuZnFeAl–LDH. Vn on adsorbent surface with the number of carbon atoms contained in n-alkanes at different temperatures. (a) CuZnFeAl–S (b) CuZnFeAlO (c) CuZnFeAl–LDH. | |
In Fig. 6(a), the TG curve shows two weight-loss segments, corresponding to the exothermic peak in the DSC curve. The peak value around 160 °C is mainly caused by the removal of LDH interlayer water or physically adsorbed water, and the weight loss in this process is about 13.6%. 160–350 °C is the second stage of decomposition weight loss, which is mainly due to the thermal decomposition of hydroxyl laminate and interlayer CO32− in LDH,38 including the second absorption peak at 373 °C in the DSC diagram. These results are consistent with those of XRD and FT-IR, which indicates that carbonate is a compensating anion between the laminates. CuZnFeAl–LDH begins to decompose beyond 600 °C, the layered structure is completely destroyed and mixed oxides are formed. Fig. 6(c) shows the TG-DSC curve of CuZnFeAl–S. The interlayer organic combustion phenomenon occurred above 160 °C, which proved that the decomposition of SDS begins with the cleavage of the C–O bond. The thermal decomposition of surfactant anion intercalated CuZnFeAl–LDH involves the combustion of the organic phase and the release of heat. The thermal decomposition behavior is related to the properties of interlayer anions. In the range of 200–500 °C is the main weight-loss stage of the sample, which is mainly due to the removal of organic anions and the combustion of carbon chain. The endothermic peak appears in the range of 600–700 °C, which is due to the decomposition of sulfate formed by SDS decomposition. The introduction of surfactant leads to a decrease in thermal stability and more thermal weight loss.
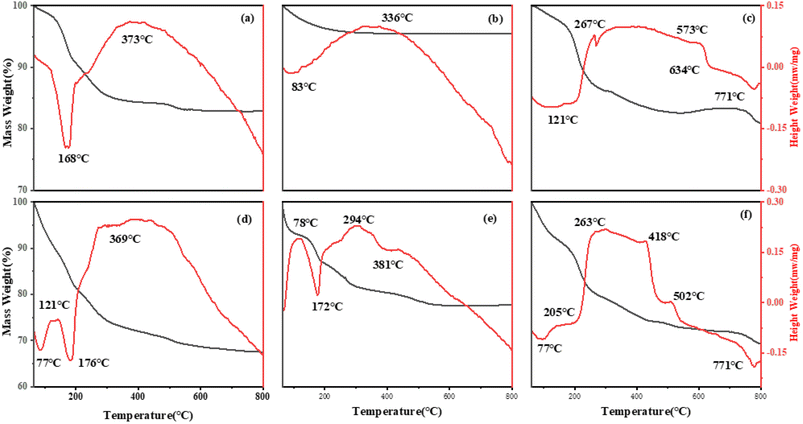 |
| | Fig. 6 TG-DSC patterns of adsorbents adsorbed before (a) CuZnFeAl–LDH (b) CuZnFeAlO (c) CuZnFeAl–S and adsorbed after (d) CuZnFeAl–LDH (e) CuZnFeAlO (f) CuZnFeAl–S. | |
Fig. 6(d)–(f), respectively, show the TG-DSC curves of the naphthalene loss process on CuZnFeAl–LDH, CuZnFeAlO and CuZnFeAl–S, the weight-loss peak generally appears from 280 to 430 °C, which is higher than the boiling point of naphthalene. Specifically, the weight-loss peak is the peak formed by the desorption of PAHs with the increase of temperature after the adsorption on the adsorbent surface. In addition, there is no obvious peak shape, indicating that the desorption process is continuous and the desorption product is single.
3.2 Adsorption performance of adsorbents
Fig. 7(a) shows the relationship of the removal of 10 mg L−1 naphthalene solution with time by adsorbents. It is found that CuZnFeAl–LDH reached adsorption equilibrium in a short time, and the removal of naphthalene basically does not change after 2.0 h. At this time, the removal of naphthalene is 20.9%. CuZnFeAlO and CuZnFeAl–S reached adsorption equilibrium in about 5.5 h, and the removal of naphthalene was 90.1% and 94.2%, respectively. The specific binding sites of CuZnFeAl–S with anionic functional groups provide effective adsorption fields for target pollutants, which have the advantages of a large number of functional groups per unit mass of adsorbent and good dispersibility.
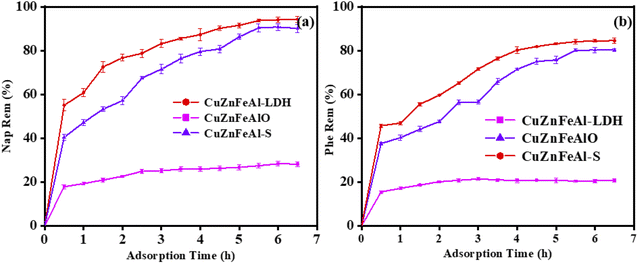 |
| | Fig. 7 The adsorption capacity of (a) naphthalene and (b) phenanthrene on adsorbents. Catalysts concentration: 0.8 g L−1, reaction temperature: 25 °C, pH = 6.8. | |
Compared with CuZnFeAl–LDH, the removal of naphthalene by CuZnFeAl–S was increased by 4.5 times. CuZnFeAl–LDH with the special layered hydroxyl structure makes the hydrotalcite have good hydrophilicity and is not easy to adsorb naphthalene in water. This phenomenon explains the change of surface properties from hydrophilic to hydrophobic, which increases its affinity for hydrophobic compounds such as PAHs.39 Fig. 7(b) shows the highest removal of phenanthrene in solution on CuZnFeAl–S is 84.5%, and the removal of phenanthrene in solution on modified CuZnFeAl–S is 4.1 times higher than that of 20.7% before modification.
With the increase of adsorbent dosage, the removal of naphthalene in the solution also gradually increases (Fig. 8(a)). When the amount of adsorbent was 1.0 g L−1, the amount of adsorbent continued to increase, and the change in the degree of naphthalene removal was not obvious. Simultaneously, the removal of naphthalene and phenanthrene can reach 97.3% and 90.3%, respectively. It can be seen that with the increase of the initial concentration of naphthalene and phenanthrene (from 10 mg L−1 to 25 mg L−1), the removal of naphthalene by the adsorbent gradually decreases, the removal of naphthalene decreases from 97.3% to 87.6% (Fig. 8(c)), and the removal of phenanthrene decreases from 90.3% to 75.6% (Fig. 8(d)).
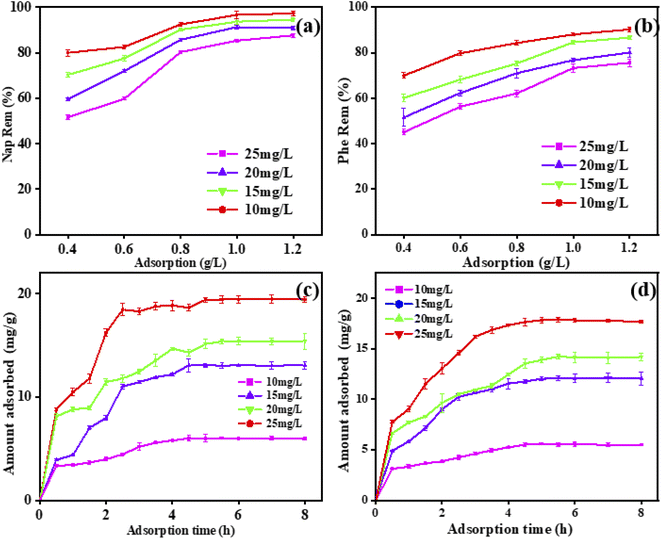 |
| | Fig. 8 Different dosage of adsorption removal rate of (a) naphthalene and (b) phenanthrene. The effect of time on the adsorption capacity of naphthalene (c) and phenanthrene (d). | |
3.3 Adsorption kinetics study
The adsorption of naphthalene (Fig. 9(a)) and phenanthrene (Fig. 9(c)) by adsorbents conforms to the first-order kinetic model. According to Table 3, the fitting of CuZnFeAl–S and CuZnFeAlO also conforms to the pseudo-first-order dynamic model. The adsorption kinetic constant k of CuZnFeAl–S is the largest, indicating the fastest adsorption rate. The adsorption isotherms were processed by the Langmuir monolayer adsorption model and the Freundlich multilayer adsorption model.40 According to the results of the Langmuir single-layer adsorption model and Freundlich multilayer adsorption model in Fig. 9(b) and (d), the two adsorption models fit the experimental date. The adsorption process of naphthalene was consistent with Langmuir adsorption, and the maximum adsorption capacity of naphthalene was 23.55 mg g−1. The adsorption process of phenanthrene was dominated by Freundlich adsorption, and the maximum adsorption capacity of phenanthrene was 25.36 mg g−1. Enhancement of the adsorption performance on CuZnFeAl–S may be the synergistic effect of hydrogen bonding and electrostatic interactions exhibited by the surface interlayer adsorption process (Table 4).41
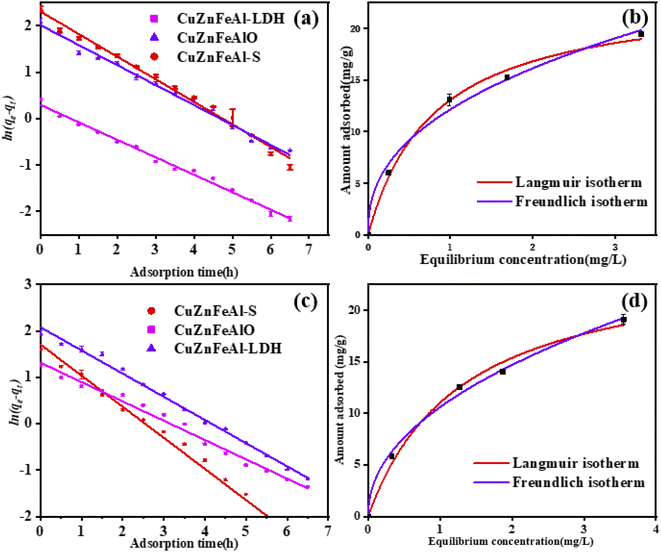 |
| | Fig. 9 Pseudo-first-order dynamics model of (a) naphthalene and (b) phenanthrene on three adsorbents. (b) Adsorption isotherm of (c) naphthalene and (d) phenanthrene on CuZnFeAl–S. | |
Table 3 Adsorption isotherm of naphthalene and phenanthrene
| Adsorbent |
Naphthalene |
Phenanthrene |
| Kinetic equation |
R2 |
Kinetic equation |
R2 |
| CuZnFeAl–LDH |
y = −0.38x + 0.30 |
0.994 |
y = −0.42x + 1.31 |
0.992 |
| CuZnFeAlO |
y = −0.43x + 2.02 |
0.991 |
y = −0.50x + 2.08 |
0.991 |
| CuZnFeAl–S |
y = −0.49x + 2.31 |
0.990 |
y = −0.67x + 1.705 |
0.981 |
Table 4 Adsorption isotherm of naphthalene and phenanthrene
| |
Langmuir isotherm |
Freundlich isotherm |
| Qmax (mg g−1) |
b (L mg−1) |
R2 |
Kf (g1−n g−1 L−n) |
n |
R2 |
| Naphthalene |
23.55 |
1.25 |
0.996 |
12.15 |
2.45 |
0.992 |
| Phenanthrene |
25.36 |
0.77 |
0.993 |
10.61 |
2.13 |
0.997 |
3.4 Adsorption thermodynamics study
Fig. S1(a) and (b)† shows the adsorption performance of naphthalene and phenanthrene with temperature (from 293.15 K to 323.15 K), and Fig. S2(a) and (b)† describes the relationship between the equilibrium adsorption capacity and the equilibrium concentration on CuZnFeAl–S, respectively. As can be seen from Table 5, ΔG, ΔS and ΔH are negative, which indicates that the adsorption of naphthalene and phenanthrene on CuZnFeAl–S is a spontaneous exothermic reaction. As the temperature rises, entropy changes gradually slows down as ΔG decreases. ΔG is between −20 and 0 kJ mol−1, manifesting that the adsorption is physical adsorption,36 which is consistent with the results of IGC. ΔS has a negative value, which reflects that the disorder degree of adsorbate at the interface between solid and liquid decreases in the process of adsorption. For the same adsorption material, the ΔH of naphthalene during adsorption is even smaller, implying that naphthalene is easier to adsorb on the surface of CuZnFeAl–S, which is consistent with the experimental results of adsorption kinetics, which further proves that CuZnFeAl–S has a strong adsorption capacity for naphthalene.
Table 5 Thermodynamic parameters of the adsorption process on CuZnFeAl–S at different temperatures
| PAHs |
T (K) |
ΔG (kJ mol−1) |
ΔH (kJ mol−1) |
ΔS (J mol−1 K−1) |
| Naphthalene |
293 |
−7.95 |
−51.77 |
−149.07 |
| 303 |
−6.88 |
|
|
| 313 |
−5.02 |
|
|
| 323 |
−3.59 |
|
|
| Phenanthrene |
293 |
−6.85 |
−43.74 |
−126.37 |
| 303 |
−5.27 |
|
|
| 313 |
−4.15 |
|
|
| 323 |
−3.01 |
|
|
3.5 Mechanism research
Surfactant-intercalated CuZnFeAl–LDH has a layered structure, with the main laminate composed of metal and interlayer guest surfactant anions. They form a close structure through the interaction of covalent bonds and hydrogen bonds, the ordered aggregation of surfactants forms a hydrophobic region between the layers. The existence of this hydrophobic partition phase enables this material to partition and adsorb hydrophobic organics in water. High molecular weight organic anions can enter the interlayer of LDH, such as DS− whose structure contains an –OSO3 bond.42
Organic molecules are distributed into the organic phase formed between layers through the partition mechanism.43 Anionic surfactants intercalate into the interlayer to form a tightly packed hydrophobic microenvironment between the CuZnFeAl–LDH layers, which can significantly enhance the adsorption of PAHs. PAHs and surfactants can also increase the adsorption of PAHs on CuZnFeAl–S by hydrogen bonding, π–π interactions, and electrostatic attraction.44–47 Therefore, the adsorption of PAHs on CuZnFeAl–S is the result of comprehensive action.
4. Conclusions
The surface properties of the adsorbent CuZnFeAl–LDH were successfully changed from hydrophilic to hydrophobic by roasting and SDS intercalation, to increase the adsorption capacity for PAHs. Compared with CuZnFeAl–LDH, the adsorption of naphthalene and phenanthrene by CuZnFeAl–S was 4.5 and 4.1 times higher, respectively. The adsorption kinetics study showed that the adsorption of CuZnFeAl–S conformed to the pseudo-first-order kinetic equation. The results of adsorption thermodynamic experiments showed that the adsorption capacity increased with the increase in reaction temperature. The adsorption of PAHs and surfactants is the result of diverse factors.
Author Contributions
Boqing Liu and Jingjing Cao performed the experiments, analyzed the data and wrote the manuscript. Haiming He, Yu Shi performed the experiments. You Jiang analyzed the data, and wrote the manuscript. Shichang Yan and Songsong Xu provided helpful discussions. Jinhua Liang and Xiaoqian Ren conceived the idea, analyzed the data, and revised the manuscript. All authors have given approval to the final version of the manuscript.
Conflicts of interest
The authors declare no competing financial interest.
Notes and references
- U. Shanker, V. Jassal and M. Rani, J. Environ. Manage., 2017, 204, 337–348 CrossRef CAS PubMed.
- K. Urbancova, D. Lankova, P. Rossner, A. Rossnerova, V. Svecova, M. Tomaniova, M. Veleminsky Jr, R. J. Sram, J. Hajslova and J. Pulkrabova, Sci. Total Environ., 2017, 577, 212–219 CrossRef CAS PubMed.
- A. Al Shra'ah, P. E. Georghiou, R. Helleur, S. L. MacQuarrie, Y. Zhao and M. Mkandawire, ACS Omega, 2018, 3(3), 3554–3561 CrossRef.
- Y. Huang, T. Yang, M. Liang, Y. Wang, Z. Xu, D. Zhang and L. Li, Chemosphere, 2019, 235, 143–152 CrossRef CAS PubMed.
- R. Dai, B. Liu, Y. Zhang, J. N. Pedersen, X. Zhang, M. Dong and Z. Guo, J. Environ. Chem. Eng., 2021, 9(6), 106390 CrossRef CAS.
- D. Eeshwarasinghe, P. Loganathan and S. Vigneswaran, Chemosphere, 2019, 223, 616–627 CrossRef CAS PubMed.
- A. Kumar and H. Gupta, Environ. Technol. Innovation, 2020, 20, 101080 CrossRef CAS.
- X. X. Zhou, L. Shi, T. Moghaddam, B. M. Z. Chen, S. P. Wu and X. Z. Yuan, J. Hazard. Mater., 2022, 425, 128003 CrossRef CAS.
- J. H. F. de Jesus, G. D. Cunha, E. M. C. Cardoso, A. S. Mangrich and L. P. C. Romao, J. Environ. Manage., 2017, 200, 186–195 CrossRef CAS PubMed.
- T. T. Song, W. J. Tian, J. Zhao, K. L. Qiao, M. Y. Zou and M. L. Chu, J. Taiwan Inst. Chem. Eng., 2021, 125, 168–175 CrossRef CAS.
- W. J. Dai, P. Wu, D. Liu, J. Hu, Y. Cao, T. Z. Liu, C. P. Okoli, B. Wang and L. Li, Chemosphere, 2020, 251, 126074 CrossRef CAS PubMed.
- Y. Yang, L. Yan, J. Li, J. Li, T. Yan, M. Sun and Z. Pei, Appl. Surf. Sci., 2019, 492, 487–496 CrossRef CAS.
- L. Wu, X. Ding, Z. Zheng, Y. Ma, A. Atrens, X. Chen, Z. Xie, D. Sun and F. Pan, Appl. Surf. Sci., 2019, 487, 558–568 CrossRef CAS.
- J. Kuljiraseth, A. Wangriya, J. M. C. Malones, W. Klysubun and S. Jitkarnka, Appl. Catal., B, 2019, 243, 415–427 CrossRef CAS.
- R. Rojas, F. Bruna, C. P. de Pauli, M. Angeles Ulibarri and C. E. Giacomelli, J. Colloid Interface Sci., 2011, 359(1), 136–141 CrossRef CAS PubMed.
- Y. Kuang, X. Zhang and S. Zhou, Water, 2020, 12(2), 587 CrossRef.
- H. Demissie, G. An, R. Jiao, T. Ritigala, S. Lu and D. Wang, Sep. Purif. Technol., 2021, 259 Search PubMed.
- G. Fatemeh, T. Martin, G. Zahra, M. Somayeh and V. Mohammadtaghi, Electrochem, 2020, 1(4), 367–387 CrossRef.
- P. H. Harding and J. C. Berg, J. Adhes. Sci. Technol., 1997, 11(4), 471–493 CrossRef CAS.
- C. Niu, W. Xia and Y. Peng, Fuel, 2018, 228, 290–296 CrossRef CAS.
- T. A. C. Balbino, C. R. Bellato, A. D. da Silva, J. D. M. Neto and S. O. Ferreira, Appl. Clay Sci., 2020, 193 Search PubMed.
- H. Jia, J. Zhao, L. Li, X. Li and C. Wang, Appl. Catal., B, 2014, 154, 238–245 CrossRef.
- T. V. M. Sreekanth, P. K. Basivi, P. C. Nagajyothi, G. R. Dillip, J. Shim, T. J. Ko and K. Yoo, J. Chromatogr. A, 2018, 1580, 134–141 CrossRef CAS PubMed.
- H. Wang, M. Jing, Y. Wu, W. Chen and Y. Ran, J. Hazard. Mater., 2018, 353, 53–61 CrossRef CAS PubMed.
- R. Yu, J. Zhao, Z. Zhao and F. Cui, J. Hazard. Mater., 2020, 390, 121998 CrossRef CAS PubMed.
- A. A. A. Ahmed, Z. A. Talib, M. Z. bin Hussein and A. Zakaria, J. Alloys Compd., 2012, 539, 154–160 CrossRef CAS.
- G. Cui, X. Meng, X. Zhang, W. Wang, S. Xu, Y. Ye, K. Tang, W. Wang, J. Zhu, M. Wei, D. G. Evans and X. Duan, Appl. Catal., B, 2019, 248, 394–404 CrossRef CAS.
- H. Boutahala, M. Zaghouane-Boudiaf, C. Tiar, L. Arab and F. Garin, Chem. Eng. J., 2011, 173(1), 36–41 CrossRef.
- H. T. Zhao and K. L. Nagy, J. Colloid Interface Sci., 2004, 274(2), 613–624 CrossRef CAS PubMed.
- Z. Wang, T. Sun, T. Luo, X. Shi, H. Lin and H. Zhang, J. Hazard. Mater., 2020, 400 Search PubMed.
- Z. Peng, Y. Zou, S. Xu, W. Zhong and W. Yang, ACS Appl. Mater. Interfaces, 2018, 10(26), 22190–22200 CrossRef CAS PubMed.
- M. Adachi-Pagano, C. Forano and J. P. Besse, Chem. Commun., 2000,(1), 91–92 RSC.
- J. Liu, L. Zhong, Y. Zewen, Y. Liu, X. Meng, W. Zhang, H. Zhang, G. Yang and W. Shaojie, Colloids Surf., A, 2022, 642 Search PubMed.
- M. Zhang, C. Zhao, J. Li, L. Xu, F. Wei, D. Hou, B. Sarkar and Y. S. Ok, J. Hazard. Mater., 2019, 373, 678–686 CrossRef CAS PubMed.
- M. Chen, Y. Cai, M. Zhang, L. Yu, F. Wu, J. Jiang, H. Yang, R. Bi and Y. Yu, Appl. Clay Sci., 2021, 211 CAS.
- L. Qin, W.-f. Liu, X.-g. Liu, Y.-z. Yang, C.-j. Cui and L.-a. Zhang, Carbon, 2021, 174, 757 CrossRef.
- G. M. Dorris and D. G. Gray, J. Colloid Interface Sci., 1980, 77(2), 353–362 CrossRef CAS.
- F. Wang and Z. Guo, J. Alloys Compd., 2018, 767, 382–391 CrossRef CAS.
- F. Bruna, R. Celis, M. Real and J. Cornejo, J. Hazard. Mater., 2012, 225, 74–80 CrossRef PubMed.
- C. Valderrama, J. L. Cortina, A. Farran, X. Gamisans and C. Lao, J. Hazard. Mater., 2007, 310(1), 35–46 CAS.
- S. Lei, S. Wang, B. Gao, Y. Zhan, Q. Zhao, S. Jin, G. Song, X. Lyu, Y. Zhang and Y. Tang, J. Colloid Interface Sci., 2020, 577, 181–190 CrossRef CAS PubMed.
- L. Dong, S. Li, Y. Jin, B. Hu and G. Sheng, Appl. Surf. Sci., 2021, 567 Search PubMed.
- X. Ruan, S. Huang, H. Chen and G. Qian, Appl. Clay Sci., 2013, 72, 96–103 CrossRef CAS.
- P. S. Tourinho, V. Koci, S. Loureiro and C. A. M. van Gestel, Environ. Pollut., 2019, 252, 1246–1256 CrossRef CAS PubMed.
- T. Huffer and T. Hofmann, Environ. Pollut., 2016, 214, 194–201 CrossRef PubMed.
- J.-W. Zhang, A. D. Nur’aini, Y.-C. Wang, N. D. Hai, D. V. Minh and H.-P. Chao, J. Environ. Chem. Eng., 2022, 10(3), 108014 CrossRef CAS.
- Z. Jiang, H. Yu, X. Liu, Z. Zheng, J. Shen, H. Zhang and X. Bai, New J. Chem., 2022, 46(23), 11266–11276 RSC.
|
| This journal is © The Royal Society of Chemistry 2022 |
Click here to see how this site uses Cookies. View our privacy policy here.  Open Access Article
 *c and
Xiaoqian Ren
 *a
*a


![[thin space (1/6-em)]](https://www.rsc.org/images/entities/char_2009.gif) qe − ln(qe − qt)]/t
qe − ln(qe − qt)]/t

![[thin space (1/6-em)]](https://www.rsc.org/images/entities/char_2009.gif) ln
ln![[thin space (1/6-em)]](https://www.rsc.org/images/entities/char_2009.gif) KD
KD


![[thin space (1/6-em)]](https://www.rsc.org/images/entities/char_2009.gif) ln(Vn) = (γsd)0.52αN(γdl)0.5 + C
ln(Vn) = (γsd)0.52αN(γdl)0.5 + C
![[double bond, length as m-dash]](https://www.rsc.org/images/entities/char_e001.gif) O bond indicates that there is a hydrogen bond between LDH and the sulfate groups, which is electrostatically bound to the metal on the surface of LDH, i.e., S
O bond indicates that there is a hydrogen bond between LDH and the sulfate groups, which is electrostatically bound to the metal on the surface of LDH, i.e., S![[double bond, length as m-dash]](https://www.rsc.org/images/entities/char_e001.gif) O⋯H–O–M (M = Cu, Zn, Fe or Al).35
O⋯H–O–M (M = Cu, Zn, Fe or Al).35![[thin space (1/6-em)]](https://www.rsc.org/images/entities/char_2009.gif) ln(Vn) − 2αNγsd. The results are shown in Table 2, the measured γsd is low, indicating that the physical adsorption of PAHs in the LDH adsorption solution occurs.36 As shown in Fig. 5, it can be seen that the adsorbents show a good linear relationship. With the increase in temperature, the value of γsd decreases, indicating that the distance between the probe molecule and adsorbent decreases with the increase in temperature, and that γsd is inversely proportional to the sixth power of molecular spacing. During the drying process, the adjacent particles gather together due to hydrogen bonding. When interacting with the probe molecule, polarization increases the ability of the probe to polarize. Compared with CuZnFeAl–LDH, the γsd of CuZnFeAl–S decreased, which may be CuZnFeAl–LDH laminate is rich in hydroxyl groups, strong polarity, and easy to polarize probe molecules. SDS-modified LDH changes hydrotalcite from hydrophilic to hydrophobic. Meanwhile, according to Dorris and Gray,37 the theory shows that the modified LDH reduces the contribution of a single methylene on the surface of hydrotalcite to the adsorption free energy. Surfactant modification makes the surface of hydrotalcite almost covered by SDS, and the modified LDH γsd decreases greatly with the increase in temperature, indicating that the modified LDH surface γsd is more sensitive to the change in temperature.
ln(Vn) − 2αNγsd. The results are shown in Table 2, the measured γsd is low, indicating that the physical adsorption of PAHs in the LDH adsorption solution occurs.36 As shown in Fig. 5, it can be seen that the adsorbents show a good linear relationship. With the increase in temperature, the value of γsd decreases, indicating that the distance between the probe molecule and adsorbent decreases with the increase in temperature, and that γsd is inversely proportional to the sixth power of molecular spacing. During the drying process, the adjacent particles gather together due to hydrogen bonding. When interacting with the probe molecule, polarization increases the ability of the probe to polarize. Compared with CuZnFeAl–LDH, the γsd of CuZnFeAl–S decreased, which may be CuZnFeAl–LDH laminate is rich in hydroxyl groups, strong polarity, and easy to polarize probe molecules. SDS-modified LDH changes hydrotalcite from hydrophilic to hydrophobic. Meanwhile, according to Dorris and Gray,37 the theory shows that the modified LDH reduces the contribution of a single methylene on the surface of hydrotalcite to the adsorption free energy. Surfactant modification makes the surface of hydrotalcite almost covered by SDS, and the modified LDH γsd decreases greatly with the increase in temperature, indicating that the modified LDH surface γsd is more sensitive to the change in temperature.
![[thin space (1/6-em)]](https://www.rsc.org/images/entities/char_2009.gif) ln
ln![[thin space (1/6-em)]](https://www.rsc.org/images/entities/char_2009.gif) Vn on adsorbent surface with the number of carbon atoms contained in n-alkanes at different temperatures. (a) CuZnFeAl–S (b) CuZnFeAlO (c) CuZnFeAl–LDH.
Vn on adsorbent surface with the number of carbon atoms contained in n-alkanes at different temperatures. (a) CuZnFeAl–S (b) CuZnFeAlO (c) CuZnFeAl–LDH.


