 Open Access Article
UiO-66-NH2 based fluorescent sensing for detection of tetracyclines in milk†
Xiaohui Wang * and
Xufeng Wang
State Key Laboratory of Food Nutrition and Safety, Tianjin University of Science and Technology, Tianjin 300457, China. E-mail: xhw2022tjin@163.com
First published on 17th August 2022
Abstract
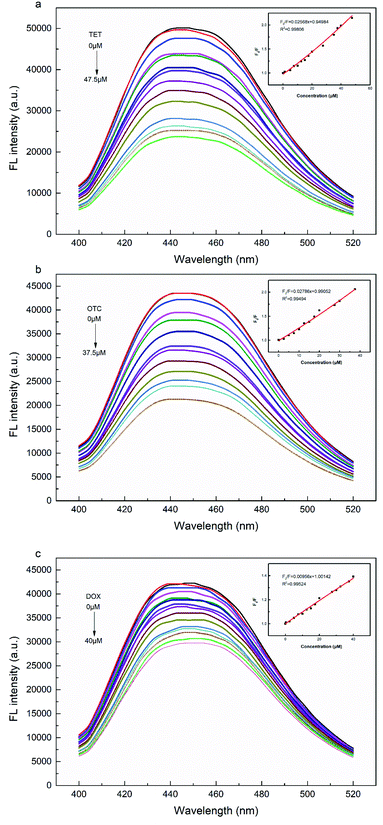
In this work, a fluorescent sensor based on a zirconium-based metal organic framework was prepared for the detection of tetracyclines (TCs) in milk. The UiO-66-NH2 fluorescent sensor was synthesized by a simple microwave-assisted method with 2-aminoterephthalic acid and zirconium chloride as precursors. In the presence of target TCs, the synergistic effect of the inner filter effect (IFE) and photo-induced electron transfer (PET) was responsible for the fluorescence quenching of UiO-66-NH2, and the fluorescence sensor showed a rapid fluorescence quenching response (5 min) to target TCs. The proposed UiO-66-NH2 sensor had good sensitivity and selectivity, and under the optimal conditions possessed detection limits of 0.449, 0.431, and 0.163 μM for tetracycline (TET), oxytetracycline (OTC), and doxycycline (DOX), respectively. Besides, the UiO-66-NH2 sensor was successfully applied to the quantitative detection of TCs in milk samples with reasonable recoveries of 93.26–115.17%, and the detection results achieved from the as-fabricated fluorescence sensing assay were consistent with those of high-performance liquid chromatography (HPLC), indicating the potential applicability of the UiO-66-NH2 sensor for detecting TCs in actual food samples.
1. Introduction
As common broad-spectrum antibacterial agents, tetracyclines (TCs), including tetracycline (TET), oxytetracycline (OTC), and doxycycline (DOX), are extensively used in both humans and animals to prevent and treat bacterial infections caused by both Gram-positive and Gram-negative bacteria because of the favourable antibacterial effect, minor side effects, good absorption, and relative low cost.1–3 In addition, TCs are also employed as feed additives in animal husbandry to promote growth and enhance the feed-to-weight ratio.4–6 However, the rampant use of TCs in veterinary medicine may result in their residues in animal origin food, such as milk,7 meat,8,9 and eggs,10 which would be a threat to human health.11–14 Moreover, consumption of foodstuffs containing TC residues for long periods will lead to the spread of resistant bacteria strains through the food chain and cause other adverse reactions, such as allergic syndromes, kidney damage, and hepatotoxicity.15–19 In order to reduce the negative effects of TCs and protect the health of consumers, the Commission Regulation (EU) no. 37/2010 has set a maximum residue limit (MRL) of 100 ppb for TCs in milk matrix.16,20 And, the MRL for TCs in milk defined by the Food and Drug Administration (FDA) in US is 676 nM (300 ng mL−1).7To date, the methods of TCs detection in food industry mainly include high performance liquid chromatography (HPLC),14,21–23 liquid chromatography-tandem mass spectrometry (LC-MS/MS),24 capillary electrophoresis (CEP),25,26 enzyme-linked immunoassay (ELISA),27–29 microbiological method,30,31 and electrochemistry analysis.32,33 However, these analytical approaches always have some defects in detection, such as long detection time, complex sample pre-processing procedure, expensive experimental instrument, trained professional technology, low sensitivity and specificity, or poor reproducibility of experimental results, limiting their practical application in dairy products.34 Among them, HPLC is the most commonly used method with good selectivity and sensitivity, but often requires cumbersome sample preparation. ELISA has the advantages of simple pre-treatment and low cost, but it always takes time and usually suffers from low sensitivity and even the possibility of false positive results. Although CEP has short analysis time and easy operation, it inevitably still has the problems of poor reusability and low sensitivity. Microbiological assay is facile and the cost is the lowest, but it subjects to its inferior specificity and sensitivity. Despite of the outstanding sensitivity and selectivity, electrochemical analysis is difficult to be applied for the repeated detection of trace TCs. Consequently, the development of simple, rapid, sensitive, and reliable methods for the determination of TCs residues in milk is of great significance.
In recent years, fluorescent sensing method has been exploited and utilized in the detection of TCs owing to its advantages of easy operation, low-cost, fast response and high sensitivity.35 According to different fluorescent materials, such as organic dyes,36 quantum dots (QDs),37 metal nanoparticles (MNPs),38 carbon dots (CDs),39 upconversion nanoparticles (UCNPs),40 silicon nanodots (SiNDs),41 and molybdenum disulfide nanoplates (MoS2 NPs),42 a series of fluorescent sensors for TCs detection have been established. Nevertheless, the wide application of above-mentioned materials may be affected by their inherent deficiencies. Organic dyes usually suffer from hindrances of short fluorescence time, low solubility and poor stability. Conventional QDs have the disadvantages of complex and harsh synthesis process, high toxicity and bad biocompatibility. MNPs (especially precious metal nanoparticles) possess the drawbacks of low stability and high cost. SiNDs have intrinsic advantages, e.g., great stability, minimal toxicity, and favourable biocompatibility, but when it comes to photoluminescence (PL) efficiency, they still fall behind the direct band-gap-based QDs. For MoS2 NPs, the preparation of high quantum yield and well water-soluble fluorescent MoS2 materials is still a challenge. The tedious operation procedures and low product yield limit the application of UCNPs. In contrast, CDs have the merits of low cost and cytotoxicity, good biocompatibility and high photo stability, but they are too small to separate and purify. As a result, the further improvements are required before these materials can be extensively used in actual samples.
Compared with other fluorescent materials, fluorescent metal–organic frameworks (FMOFs) is a new fast-developing type of crystalline materials, which have the virtues of simple synthesis, permanent porosity, adjustability, and structural diversity of metal organic frameworks (MOFs).43,44 In addition, FMOFs can also generate fluorescent signals visible to the naked eye, and the development of fluorescence spectroscopy is quite mature.45 Therefore, FMOFs have a wide range of applications in various targets sensors, e.g., explosive sensors, gas sensors, biomolecule sensors, humidity sensors, temperature sensors, volatile organic compounds (VOC) sensors, and ion sensors.44 At present, multiple synthetic techniques, including conventional solution reaction, solvothermal method, diffusion method and post-synthetic modification (PSM) strategy, have been developed and utilized for the synthesis of MOFs.46,47 Of these, conventional solution reaction is simple and fast, but the synthesized MOF compounds are often unstable. Although large size single crystals can be obtained by diffusion method, the low yield and long reaction time limit the widespread application of this method. PSM enables the MOF to have better functional groups and active sites in order to achieve excellent functional properties, but the post modification reaction of MOF often requires the participation of liquid or solution, and this reaction process is difficult to monitor. Compared with other methods, solvothermal method is conducive to the single crystal growth of MOF products, which is the main reason why solvothermal method is widely used. For all that, it usually takes a long reaction time (half a day to several days). It is worth noting that this deficiency can be improved by solvothermal synthesis with microwave-assisted heating method.48,49 Considering the virtues of short synthesis time, energy saving, high yield and relatively uniform crystal size, microwave-assisted synthesis assay is expected to become a common synthesis method of MOFs.48
Up to now, the reported luminescent forms of FMOFs are mainly summarized as follows: (i) organic ligand-based luminescence; (ii) lanthanide ions luminescence; (iii) charge-transfer luminescence; and (iv) guest-induced luminescence, which offers a strong theoretical basis for fluorescence sensing.46 Even so, owing to the reversibility of coordinate bonds, the stability of FMOFs, especially water stability, is still a problem to be solved.44 With the foundation of hard/soft acid/base (HSAB) theory, stable MOF can be composed of tetravalent metal ion Zr4+ and carboxylate-based ligands.50 Among various metal organic frameworks, zirconium (Zr)-based MOFs have good development prospects in fluorescence sensing due to their excellent stability, structural diversity, and fascinating characteristics.51 Besides, the stability of FMOFs and the sensitivity of the detection system will be well improved by introducing functional groups (such as amino groups).47,52–54 It has been reported that the amino groups introduced in the materials can combine with TCs by hydrogen bonding interaction, leading to fluorescence quenching through electron transfer between the analyte molecule and the fluorescence sensor.7 UiO-66-NH2, one of the Zr-based MOFs, has been used for the fluorescence detection of fluoride ion and the adsorption of mercury in aqueous solution because of its highly stability in water and even in mild acid-base environment.55–57 Therefore, amino functionalized Zr-MOF (UiO-66-NH2) was selected to detect TCs in milk in this research considering its stability toward water and organic solvents. Simultaneously, microwave-assisted synthesis method was chosen to synthesize the UiO-66-NH2 in this work. As far as we know, there has been no report on detection of TCs in milk based on UiO-66-NH2 fluorescence sensor.
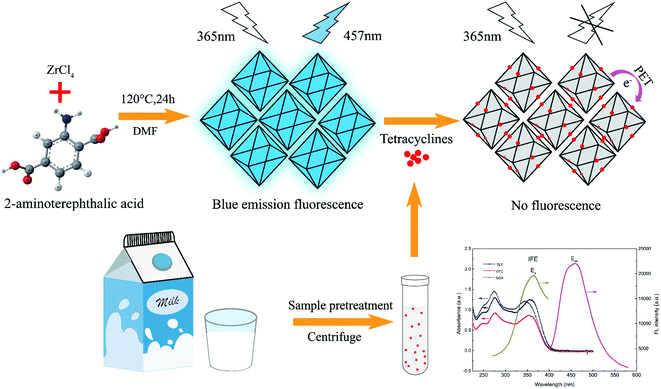
In this paper, we used a facile microwave-assisted synthesis method to prepare UiO-66-NH2 fluorescent sensor for detecting TCs residues in milk. The UiO-66-NH2, synthesized through utilizing Zr4+ as metal centre and 2-aminoterephthalic acid (ATA) as organic linker, contained abundant –NH2 on its surface, which increased its stability in water and provided a binding site for target TCs (Fig. 1). The as-prepared UiO-66-NH2 possessed good fluorescence performance, and could be quenched by TCs because of photo-induced electron transfer (PET) (the electron transfer from ATA organic ligand to TCs) and inner filter effect (IFE). Moreover, the hydrogen bond interaction between amino groups on UiO-66-NH2 and hydroxyl groups of TCs enabled the fluorescence sensor to detect TCs specifically from a series of interference factors (antibiotics, ions and amino acids). Eventually, due to high sensitivity and excellent selectivity, the established fluorescence sensing analysis method was successfully applied to detect TCs in actual milk samples with desirable results.
2. Experimental section
2.1. Reagents and materials
Zirconium chloride (ZrCl4, 98%) was obtained from Beijing Yinuokai Technology Co., Ltd (Beijing, China). N,N-Dimethylformamide (DMF), ethyl alcohol (EtOH), Zn(NO3)2·6H2O, AlCl3·6H2O, MgCl2·6H2O, MnCl2·4H2O, KCl, CaCl2, and NaCl were from SinopharmChemical Reagent Co., Ltd (Shanghai, China). 2-Aminoterephthalic acid (ATA, 98%), tetracycline (TET), doxycycline (DOX), oxytetracycline (OTC), ampicillin (AMP), amoxicillin (AMX), chloramphenicol (CM), cysteine (Cys), tyrosine (Tyr), phenylalanine (Phe), serine (Ser), arginine (Arg), and histidine (His) were purchased from Shanghai Macklin Biochemical Co., Ltd (Shanghai, China), and the chemical structural formulas of TCs were displayed in Fig. S1.† All chemical reagents used were of analytical grade and did not require further purification. During the entire study, doubly deionized water (DDW, 18.2 MΩ cm−1) obtained by a Milli-Q water purification system was used. The fresh milk sample applied in the experiment was purchased from a local supermarket.2.2. Instruments
The morphology of UiO-66-NH2 was observed by the scanning electron microscopy (SEM, Hitachi, Japan) and transmission electron microscope (TEM, JEOL, Japan). The Fourier transform infrared spectroscopy (FT-IR) spectra were acquired using a Tensor-37 FT-IR spectrophotometer (Bruker, Germany), and the X-ray photoelectron spectroscopy (XPS) was carried out by an Axis Ultra DLD X-ray photoelectron spectrometer (Kratos, England). UV-vis absorption spectra were obtained by an ultraviolet spectrophotometer (Victoria, Australia), and the fluorescence spectra were recorded on a Lumina fluorescence spectrophotometer (Thermo, USA). The results obtained from the UiO-66-NH2 sensor was validated by HPLC (LC-20AB, Shimadzu, Japan).2.3. Synthesis of UiO-66-NH2
UiO-66-NH2 was prepared according to the previous study with a little modification.57 First, 669 mg (2.87 mmol) of ZrCl4 and 500 mg (2.76 mmol) of 2-aminoterephthalic acid (ATA) were dissolved in 60 mL of DMF. Next, the mixture solutions were ultra-sonicated for 30 min at room temperature. Then, the mixture was transferred to a 100 mL stainless steel Teflon-lined autoclave and heated at 120 °C for 24 h in an oven. After being cooled to room temperature, the resulting solid was collected by centrifugation and then dispersed in 24 mL of absolute ethyl alcohol. Subsequently, the dispersion was transferred to a microwave-assisted heating device and maintained at 100 °C for 30 min. Finally, the resulting solid product was centrifuged and dried in a vacuum-drying oven at 70 °C overnight.2.4. Fluorescence sensing experiment of TCs
The typical experimental procedure for fluorescence detection of TCs was as follows. Firstly, the stock solutions of TET, OTC and DOX were separately prepared, and diluted to the required concentrations before the experiment. Secondly, TCs standard solutions with various concentrations were respectively mixed with 0.1 mg mL−1 UiO-66-NH2 solution (v/v, 1![[thin space (1/6-em)]](https://www.rsc.org/images/entities/char_2009.gif) :
:![[thin space (1/6-em)]](https://www.rsc.org/images/entities/char_2009.gif) 1) at ambient temperature in a centrifuge tube, with the final TET concentrations of 1.25, 5, 7.5, 10, 12.5, 15, 17.5, 20, 27.5, 35, 37.5, 40, 47.5 μM, DOX concentrations of 0.25, 2.5, 5, 7.5, 10, 12.5, 15, 17.5, 20, 27.5, 30, 32.5, 37.5, 40 μM, and OTC concentrations of 0.25, 2.5, 5, 7.5, 10, 12.5, 15, 17.5, 20, 27.5, 30, 37.5 μM, and the concentration of UiO-66-NH2 in the mixture was 0.05 mg mL−1. Sequentially, the above reaction systems (pH = 8) were incubated at room temperature for 5 min in the dark, and the fluorescence spectra from 400 to 520 nm under the excitation at 365 nm were recorded. Furthermore, the mixture of UiO-66-NH2 solution and deionized water (v/v, 1
1) at ambient temperature in a centrifuge tube, with the final TET concentrations of 1.25, 5, 7.5, 10, 12.5, 15, 17.5, 20, 27.5, 35, 37.5, 40, 47.5 μM, DOX concentrations of 0.25, 2.5, 5, 7.5, 10, 12.5, 15, 17.5, 20, 27.5, 30, 32.5, 37.5, 40 μM, and OTC concentrations of 0.25, 2.5, 5, 7.5, 10, 12.5, 15, 17.5, 20, 27.5, 30, 37.5 μM, and the concentration of UiO-66-NH2 in the mixture was 0.05 mg mL−1. Sequentially, the above reaction systems (pH = 8) were incubated at room temperature for 5 min in the dark, and the fluorescence spectra from 400 to 520 nm under the excitation at 365 nm were recorded. Furthermore, the mixture of UiO-66-NH2 solution and deionized water (v/v, 1![[thin space (1/6-em)]](https://www.rsc.org/images/entities/char_2009.gif) :
:![[thin space (1/6-em)]](https://www.rsc.org/images/entities/char_2009.gif) 1) was set as the control group. All the fluorescence experiments were performed in parallel three times.
1) was set as the control group. All the fluorescence experiments were performed in parallel three times.
2.5. Selectivity for TCs
To study the selectivity of the proposed fluorescence method for the detection of TCs, the following selective experiments were carried out. Several possible interferences (AMP, AMX, CM, Cys, Tyr, Phe, Ser, Arg, His, Al3+, Mg2+, Mn2+, Ca2+, Zn2+, Na+, and K+) were added to UiO-66-NH2 solution respectively in the presence of TCs (50 μM). After incubation for 5 min at ambient temperature, the fluorescence intensity of each mixed system was measured.2.6. Detection of TCs in milk
Milk samples bought from local supermarket were selected for actual sample analysis to verify the feasibility of the established fluorescence sensing method. According to the pre-treatment procedure in the previous work,18,58,59 in brief, 1% (v/v) trichloroacetic acid (10%, w/v) and chloroform were first added to the milk sample (5 mL), and vortically mixed for 2 min to precipitate proteins and dissolve other organic substances in the milk matrix. Secondly, the mixture was centrifuged at 11![[thin space (1/6-em)]](https://www.rsc.org/images/entities/char_2009.gif) 000 rpm for 15 min to remove the deposit after being sonicated for 15 min. Finally, the supernatant was filtered through a 0.22 μM microporous membrane to remove the lipids, and the filtrate was diluted to a final volume of 10 mL for further analysis according to the procedure in section 2.4. In the recovery experiment, the spiked samples containing standard TCs solutions of 0, 5, 20, and 40 μM were achieved by the standard addition method, and then the pre-processing was carried out according to the above steps.
000 rpm for 15 min to remove the deposit after being sonicated for 15 min. Finally, the supernatant was filtered through a 0.22 μM microporous membrane to remove the lipids, and the filtrate was diluted to a final volume of 10 mL for further analysis according to the procedure in section 2.4. In the recovery experiment, the spiked samples containing standard TCs solutions of 0, 5, 20, and 40 μM were achieved by the standard addition method, and then the pre-processing was carried out according to the above steps.
2.7. Validation by HPLC
Additionally, to validate the reliability of the fluorescence analysis results, traditional HPLC was also used to detect TCs in spiked samples. The HPLC experiment could be successfully completed using oxalic acid (0.01 M)/acetonitrile/methanol (77/18/5, v/v/v) as the mobile phase with a flow-rate of 1.0 mL min−1 at 40 °C through a Thermo Scientific-C18 analytical column (4.6 mm × 250 mm, 5 μm). The ultraviolet detector wavelength was set at 350 nm, and the injection volume of each sample was 20 μL.3. Results and discussion
3.1. Characterization
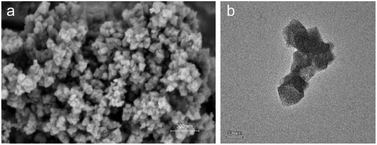
SEM and TEM were performed to present the surface morphology of UiO-66-NH2. Fig. 2 showed that the as-prepared UiO-66-NH2 had nearly octahedron-like appearance with the average edge length of approximately 100 nm.60,61 FT-IR spectra of UiO-66-NH2 and ligand 2-aminoterephthalic acid were exhibited in Fig. 3a. In the high frequency region, the characteristic peaks at 3373 cm−1 and 3492 cm−1 were assigned to the symmetric and asymmetric stretching bands of N–H bonding in amine moieties, respectively.7,57,62,63 Compared with FT-IR spectrum of ATA, after the introduction of tetravalent zirconium ions, the aforementioned characteristic doublet of stretching vibration in UiO-66-NH2 shifted to lower wavenumber, indicating that the distribution of amines in MOF was unordered.57,64 Clearly, the wide absorption band in the region of 2500–3300 cm−1 (–COOH) disappeared, signifying that the ATA connected to the UiO-66-NH2 framework was completely deprotonated.53,65 In the lower frequency region, the unique C–N stretching absorption in aromatic amines was observed at 1258 cm−1. In addition, the –OCO stretching peaks were obtained at 1658 and 1385 cm−1, proving the formation of dehydroxylation phase in UiO-66-NH2 after the coordination between ATA and Zr4+.57,62 The peaks at 768, 661, and 489 cm−1 corresponded to the bending vibration of O–H and C–H mixing with Zr–O bond.56 The above characterization results indicated that UiO-66-NH2 was successfully achieved.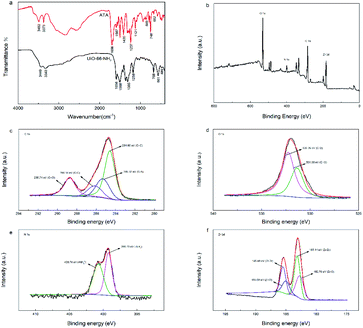 | ||
| Fig. 3 FT-IR spectra of ATA, and UiO-66-NH2 (a), and XPS spectra of survey (b), C 1s (c), O 1s (d), N 1s (e) and Zr 3d (f) for the UiO-66-NH2. | ||
The element compositions and surface chemical states of UiO-66-NH2 were analysed using XPS (Fig. 3b–f). As shown in Fig. 3b, peaks corresponding to O 1s, C 1s, N 1s, and Zr 3d were obviously identified in survey spectrum, indicating that UiO-66-NH2 was primarily composed of C, O, N and Zr. Fig. 3c illustrated the C 1s spectrum could be decomposed into four peaks, owing to the C![[double bond, length as m-dash]](https://www.rsc.org/images/entities/char_e001.gif) C (284.60 eV), C–N (285.32 eV), C–C (286.14 eV) and C
C (284.60 eV), C–N (285.32 eV), C–C (286.14 eV) and C![[double bond, length as m-dash]](https://www.rsc.org/images/entities/char_e001.gif) O bonds (288.74 eV) in UiO-66-NH2, respectively.60,66 For the O 1s spectrum (Fig. 3d), peaks with binding energy of 531.36 eV and 532.26 eV were attributed to C
O bonds (288.74 eV) in UiO-66-NH2, respectively.60,66 For the O 1s spectrum (Fig. 3d), peaks with binding energy of 531.36 eV and 532.26 eV were attributed to C![[double bond, length as m-dash]](https://www.rsc.org/images/entities/char_e001.gif) O and C–O bonds, respectively.61,67 As presented in Fig. 3e, the peaks located at 399.23 eV and 400.73 eV in N 1s spectrum were respectively assigned to amino groups (–NH2) and protonated amine (–NH3+) groups.60,61 In Fig. 3f, the Zr 3d peak could be further divided into four peaks. The characteristic peaks at 182.70 eV and 185.00 eV corresponded to the Zr–O bonds, and the specific peaks at 183.14 eV and 185.48 eV belonged to the Zr–Zr bonds.60,66–68
O and C–O bonds, respectively.61,67 As presented in Fig. 3e, the peaks located at 399.23 eV and 400.73 eV in N 1s spectrum were respectively assigned to amino groups (–NH2) and protonated amine (–NH3+) groups.60,61 In Fig. 3f, the Zr 3d peak could be further divided into four peaks. The characteristic peaks at 182.70 eV and 185.00 eV corresponded to the Zr–O bonds, and the specific peaks at 183.14 eV and 185.48 eV belonged to the Zr–Zr bonds.60,66–68
3.2. Fluorescence (FL) stability of UiO-66-NH2
The fluorescence emission spectra of UiO-66-NH2 under different excitation wavelengths (310–400 nm) were recorded in Fig. 4a. At different excitation wavelengths, the maximum emission intensities were displayed at 457 nm, showing good excitation independence. The emission peak at 457 nm of UiO-66-NH2 under the optimal excitation wavelength of 365 nm was independent of the excitation wavelength, which might reduce the interference of automatic fluorescence in the detection process.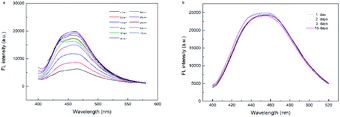 | ||
| Fig. 4 (a) Fluorescence emission spectra of UiO-66-NH2 at different excitation wavelengths. (b) Fluorescence (FL) stability of UiO-66-NH2 for 15 days in room temperature. | ||
Moreover, the fluorescence response of UiO-66-NH2-aqueous solution during room temperature storage was repeatedly detected. As presented in Fig. 4b, there was no remarkable fluorescence change within 15 days, indicating that the synthesized UiO-66-NH2 had desirable photo stability. In addition, UiO-66-NH2 showed good fluorescence stability in the pH range from 6.0 to 10.0 with negligible fluorescence change (Fig. S2†).
3.3. Optimization of experimental parameters
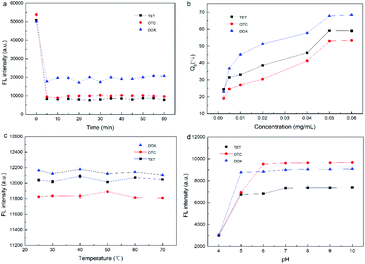
In order to improve the analytical performance of the UiO-66-NH2 fluorescence sensor system, a series of experimental parameters (the concentration of UiO-66-NH2, the temperature and pH of the reaction system, and the incubation time) were optimized.
 | (1) |
In summary, the UiO-66-NH2 concentration of 0.05 mg mL−1, incubation time of 5 min, room temperature and pH of 8.0 were adopted as the optimal experimental conditions.
3.4. Fluorescence detection of TCs and calibration curve
The fluorescence response of UiO-66-NH2 sensor system to different concentrations of TCs was explored in detail. According to the obtained spectra (Fig. 6), it was found that the fluorescence intensity of UiO-66-NH2 gradually declined with the increase of TCs concentration from 0 to 50 μM, indicating that the established fluorescence sensor system has a high sensitivity. Fluorescence quenching could be described by Stern–Volmer eqn (2):
 | (2) |
 | (3) |
3.5. Possible fluorescence sensing mechanism
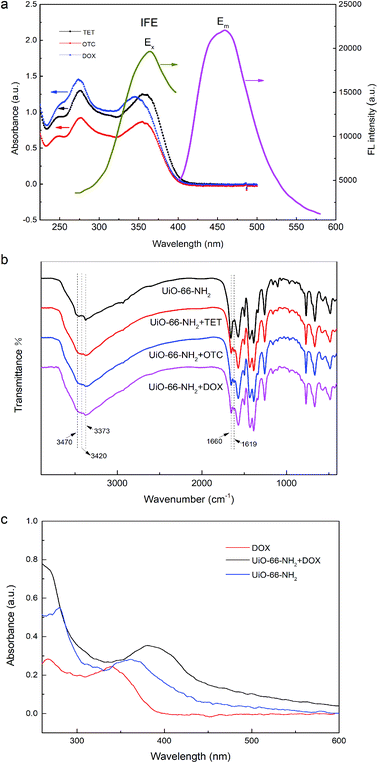
In general, the fluorescence quenching mechanisms between analytes and sensors were mainly related to three processes: inner filter effect (IFE), fluorescence resonance energy transfer (FRET), and photo-induced electron transfer (PET).7,36,69,70 Considering that there was almost no effective overlap between the UV absorption band of TCs and the emission band of UiO-66-NH2 (Fig. 7a), the FRET mechanism was excluded.71,72 However, noticeably, the excitation spectrum of UiO-66-NH2 partially overlapped with UV-vis absorption spectra of TCs (Fig. 7a), which manifested the possibility of IFE. As previously reported, the fluorescence lifetime of the fluorophore remains unchanged if IFE occurs, while it reduces as the result of energy transfer during FRET process.72–74 Accordingly, we took the fluorescence lifetime as an important index to further explain the quenching mechanism and the decay curves of UiO-66-NH2 and UiO-66-NH2 + TCs were portrayed in Fig. S3.† There was no significant change in the fluorescence lifetime of UiO-66-NH2 before and after the addition of TCs, which further verified that the fluorescence quenching mechanism induced by TCs was IFE rather than FRET. The strong absorption of TCs effectively suppressed the excitation energy absorption of UiO-66-NH2 at the excitation wavelength of 370 nm, resulting in low populated emissive state of UiO-66-NH2, and the fluorescence of UiO-66-NH2 was significantly quenched after the addition of target TCs.7,70 Moreover, the FT-IR spectra of UiO-66-NH2 + TCs were also displayed in Fig. 7b. After introduction of TCs, the characteristic peaks of –NH2 at 3373 cm−1 and 3470 cm−1 weakened, and a new wide absorption peak of O–H appeared at 3420 cm−1, showing the hydrogen bond interaction between the amino group on the surface of UiO-66-NH2 and the hydroxyl group on TCs.7,65 In addition, the weakening of –C![[double bond, length as m-dash]](https://www.rsc.org/images/entities/char_e001.gif) O stretching absorption at 1660 cm−1, the formation of a new absorption peak at 1619 cm−1, and the red shift of the UV absorption spectrum of the UiO-66-NH2 after the addition of TCs (Fig. 7c) further indicated that a new complex was formed by the interaction between TCs and UiO-66-NH2.7 Thus, a driving force was generated for the electron transfer from –NH2 on UiO-66-NH2 to –CO–/–OH of TCs, explaining the fluorescence quenching phenomenon.7,36,75,76 These results proved that IFE and PET were responsible for the luminescence quenching of UiO-66-NH2.
O stretching absorption at 1660 cm−1, the formation of a new absorption peak at 1619 cm−1, and the red shift of the UV absorption spectrum of the UiO-66-NH2 after the addition of TCs (Fig. 7c) further indicated that a new complex was formed by the interaction between TCs and UiO-66-NH2.7 Thus, a driving force was generated for the electron transfer from –NH2 on UiO-66-NH2 to –CO–/–OH of TCs, explaining the fluorescence quenching phenomenon.7,36,75,76 These results proved that IFE and PET were responsible for the luminescence quenching of UiO-66-NH2.
3.6. Selectivity of UiO-66-NH2 system
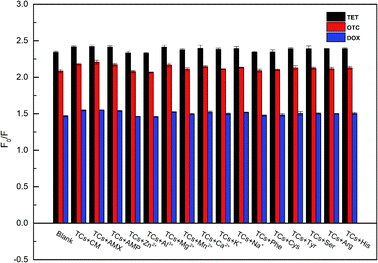
In the actual detection process, the possible coexisting substances in milk might affect the accuracy of the experimental results. Hence, to verify the selectivity of the established fluorescence sensing method, some other antibiotics (including chloramphenicol, amoxicillin and ampicillin), amino acids (tyrosine, serine, arginine, histidine, cysteine, and phenylalanine) and metal ions (Zn2+, Al3+, Mg2+, Mn2+, Ca2+, K+, and Na+) were each added to the UiO-66-NH2 system in the presence of TCs. As demonstrated in Fig. 8, compared with TCs (blank, 50 μM), the effects of these interfering substances on the fluorescence of UiO-66-NH2 system were negligible, even if the concentrations of potential molecule and ion interfering substances were 5 times and 30 times higher than those of TCs, respectively. All the results illustrated that the UiO-66-NH2 system had an excellent selectivity and a high specific recognition for the assay of TCs in complex matrix.3.7. Precision detection of the developed fluorescence assay
The intra- and inter-day precision parameters were evaluated using the TCs standard solutions at three concentrations of 5, 20 and 40 μM. The results showed that the relative standard deviations (RSDs) ranged from 0.63% to 3.40% and from 0.75% to 3.29% (n = 6), respectively (Table S1†) (see ESI†). Therefore, this method has good accuracy and stability, which proves the feasibility of detecting TCs.3.8. Analysis in practical samples
To further evaluate the practicability of UiO-66-NH2 sensor in milk, spiking and recovery studies were carried out. No TCs were detected in milk samples purchased from local supermarkets (Fig. S4b†). A series of TCs standard solutions with different concentrations (0, 5, 20, 40 μM) were added to milk to obtain the blank and spiked samples. After pre-treatment, the above samples were analysed by the developed fluorescence sensing method, and the actual detection concentrations of the spiked samples were determined with the standard curves and regression equations. As clearly presented in Table S2,† the recoveries of TCs ranged from 93.26% to 115.17%, and the relative standard deviations (RSDs, n = 3) were in the range of 0.50–2.92%. At the same time, the traditional high performance liquid chromatography (HPLC) method was applied to validate the reliability of the proposed fluorescence sensing method and the results were consistent with that determined by fluorescence assay (Table S2†).As seen from the chromatogram in Fig. S4a,† the retention times of TET, OTC and DOX were 5.40, 6.58 and 26.28 min, respectively. There was a linear relationship between the HPLC method and fluorescence assay, which was shown in Fig. S5,† and the correlation coefficient (R2) was 0.99483, illustrating that the accuracy of the proposed fluorescence method was equivalent to that of HPLC method. Therefore, above results indicated that the developed. UiO-66-NH2 sensor was reliable and accurate to detect TCs in actual milk samples.
To our knowledge, there was no report on the detection of TCs in milk with UiO-66-NH2 fluorescent sensor. The comparison between this method and existing approaches was presented in Table 1. It was found that the established assay in this paper had different advantages in linear detection range and detection limit. The linearity range of the proposed methodology was similar to that of surface-enhanced Raman spectroscopy (SERS) method, but the detection limit was relatively low. Furthermore, although the sensitivity of the proposed method was not as sensitive as electrochemical method, and the LOD and linear range were equivalent to many other fluorescence methods, the developed approach was easy and simple to operate. In view of the satisfactory recovery, low detection limit, wide linear range, and simplicity of operation, the established UiO-66-NH2 sensing method could be applicable for TCs determination in practical samples.
| Method | Sample | Analyte | Linear range (μM) | LOD (μM) | Recovery (%) | Ref. |
|---|---|---|---|---|---|---|
| a MCPE: modified carbon paste electrode; SbFE: antimony film electrode; SERS: surface enhanced Raman spectroscopy; NRs: nanorods; SiQDs: silicon quantum dots; MOFs: metal–organic frameworks; NAC: N-acetyl-L-cysteine; Ag NCs: silver nanoclusters; MRFNs: Maillard reaction fluorescent nanoparticles; CDs: carbon dots; BNQD: boron nitride quantum dot; S dots: sulfur quantum dots and calcium ion. | ||||||
| Fluorescent sensor of UiO-66-NH2 | Milk | TET/OTC/DOX | 0–7.5/0–7.5/0–40 | 0.449/0.431/0.163 | 93.26–115.17 | This study |
| Electrochemistry, based on MCPE | Urine/serum | DOX | 0.1–10000/0.122–10000 | 0.10/0.12 | 98.1–99.37 | 77 |
| Electrochemistry based on SbFE | Honey | TET | 0.40–3.00 | 0.15 | 91.46–105.54 | 78 |
| SERS | Duck meat | TET | 9–56 | 2.52 | 101–108 | 9 |
| Mesoporous fluorescent sensor based on ZnO NRs | Water | TET | 2.0–120 | 1.27 | 102.37–103.51 | 79 |
| Fluorescent probe based on SiQDs | Milk | OTC | 2–20 | 0.43 | 98.8–100.5 | 80 |
| Fluorescent sensor of Zn-MOF | Sea water | TET | 1–75 | 0.234 | 98.3–102.3 | 81 |
| Fluorescent sensor of NAC@Ag NCs | Milk | TET | 1.12–230 | 0.47 | 98.2–102 | 19 |
| Fluorescent probe of MRFNs | Water | TET | 0.67–67 | 0.579 | 92.88–102 | 17 |
| Fluorescent probe based CDs | Water/milk/pork | OTC | 0–40 | 0.41 | 93.9–105 | 4 |
| Ratiometric fluorescent sensor based on BNQD-Eu3+ | Milk/beef | TET/OTC/DOX | 0–50 | 0.019/0.104/0.028 | 88.46–113.47 | 18 |
| Ratiometric fluorescent probe of S dots/Ca2+ | Milk/fish | DOX | 0.5–25 | 0.19 | 91–110 | 82 |
| Fluorescent sensor based on CDs@MOF (Eu) | Simulated biological system | DOX | 0–60 | 0.36 | 93.95–102.28 | 83 |
4. Conclusions
In this study, a simple microwave-assisted synthesis method was used to fabricate a zirconium-based fluorescent metal–organic framework UiO-66-NH2 sensor for the detection of TCs in milk. At the excitation wavelength of 365 nm, UiO-66-NH2 has a strong and stable fluorescence emission intensity at the wavelength of 457 nm. Based on the PET (electron transfer from the ligand of UiO-66-NH2 to –CO–/–OH on TCs) and IFE mechanisms, the fluorescence sensor showed rapid fluorescence quenching response (5 min) to target TCs, and exhibited a good selectivity and sensitivity with a linearity range of 0–47.5 μM and low detection limits (0.449 μM for TET, 0.431 μM for OTC, and 0.163 μM for DOX, lower than the maximum residue limit of 676 nM for TCs in milk defined by the FDA in US). Besides, the prepared UiO-66-NH2 sensor was successfully utilized in the quantitative detection of TCs in milk samples, coupled with reasonable recoveries (93.26–115.17%) and low RSD values. The accuracy and reliability of UiO-66-NH2 sensing assay were also verified by HPLC method. This paper may provide a new and promising approach for accurately, rapidly, sensitively, and selectively detecting TCs in complicated matrix samples.Author contributions
All authors contributed to the study conception and design. Xiaohui Wang developed the idea of the study, presided over the design and coordination of the research, and completed the manuscript. Xufeng Wang contributed to the acquisition and interpretation of data. All authors provided critical review and Xiaohui Wang substantially revised the manuscript. All authors read and approved the final manuscript.Conflicts of interest
There are no conflicts to declare.Acknowledgements
This work was supported by the Tianjin Research Innovation Project for Postgraduate Students (project no. 2019YJSB011).Notes and references
- I. Chopra and M. Roberts, Microbiol. Mol. Biol. Rev., 2001, 65, 232 CrossRef CAS PubMed.
- A. K. Sarmah, M. T. Meyer and A. B. A. Boxall, Chemosphere, 2006, 65, 725–759 CrossRef CAS PubMed.
- N. Kemper, Ecol. Indic., 2008, 8, 1–13 CrossRef CAS.
- Y. Z. Fu, L. Huang, S. J. Zhao, X. J. Xing, M. H. Lan and X. Z. Song, Spectroc. Acta Pt. A-Molec. Biomolec. Spectr., 2021, 246, 6 Search PubMed.
- X. G. Hu, Q. X. Zhou and Y. Luo, Environ. Pollut., 2010, 158, 2992–2998 CrossRef CAS PubMed.
- L. L. Ji, W. Chen, L. Duan and D. Q. Zhu, Environ. Sci. Technol., 2009, 43, 2322–2327 CrossRef CAS PubMed.
- C. H. Li, L. Zhu, W. X. Yang, X. He, S. L. Zhao, X. S. Zhang, W. Z. Tang, J. L. Wang, T. L. Yue and Z. H. Li, J. Agric. Food Chem., 2019, 67, 1277–1283 CrossRef CAS PubMed.
- F. Cetinkaya, A. Yibar, G. E. Soyutemiz, B. Okutan, A. Ozcan and M. Y. Karaca, Food Addit. Contam., Part B, 2012, 5, 45–49 CrossRef CAS PubMed.
- J. H. Zhao, P. Liu, H. C. Yuan, Y. J. Peng, Q. Hong and M. H. Liu, J. Spectrosc., 2016, 2016, 6 Search PubMed.
- J. Song, Z. H. Zhang, Y. Q. Zhang, C. Feng, G. N. Wang and J. P. Wang, Anal. Methods, 2014, 6, 6459–6466 RSC.
- S. H. Abou-Raya, A. R. Shalaby, N. A. Salama, W. H. Emam and F. M. Mehaya, J. Food Drug Anal., 2013, 21, 80–86 CAS.
- V. Gaudin, Biosens. Bioelectron., 2017, 90, 363–377 CrossRef CAS PubMed.
- B. M. Marshall and S. B. Levy, Clin. Microbiol. Rev., 2011, 24, 718–733 CrossRef CAS.
- A. Onal, Food Chem., 2011, 127, 197–203 CrossRef.
- R. Q. Fan, S. S. Tang, S. L. Luo, H. Liu, W. J. Zhang, C. J. Yang, L. D. He and Y. Q. Chen, Molecules, 2020, 25, 12 Search PubMed.
- A. Khataee, R. Jalili, M. Dastborhan, A. Karimi and A. E. F. Azar, Spectroc. Acta Pt. A-Molec. Biomolec. Spectr., 2020, 242, 7 Search PubMed.
- X. J. Si, H. L. Wang, T. H. Wu and P. Wang, RSC Adv., 2020, 10, 43256–43261 RSC.
- K. R. Yang, P. Jia, J. J. Hou, T. Bu, X. Y. Sun, Y. N. Liu and L. Wang, ACS Sustainable Chem. Eng., 2020, 8, 17185–17193 CrossRef CAS.
- Y. Zhang, M. Lv, P. F. Gao, G. M. Zhang, L. H. Shi, M. J. Yuan and S. M. Shuang, Sens. Actuators, B, 2021, 326, 13 Search PubMed.
- A. Motorina, O. Tananaiko, I. Kozytska, V. Raks, R. Badia, M. E. Diaz-Garcia and V. N. Zaitsev, Sens. Actuators, B, 2014, 200, 198–205 CrossRef CAS.
- L. Bovanova and E. Brandsteterova, J. Chromatogr. A, 2000, 880, 149–168 CrossRef CAS.
- X. J. Lai, J. Liu, X. Xu, J. Li, B. J. Zhang, L. J. Wei, H. P. Cai and X. L. Cheng, J. Sep. Sci., 2020, 43, 398–405 CrossRef CAS PubMed.
- S. Lebedinets, C. Vakh, K. Cherkashina, A. Pochivalov, L. Moskvin and A. Bulatov, J. Chromatogr. A, 2020, 1615, 8 CrossRef PubMed.
- L. Wang, B. X. Yang, X. S. Zhang and H. G. Zheng, Food Anal. Methods, 2017, 10, 2001–2010 CrossRef.
- I. S. Ibarra, J. A. Rodriguez, J. M. Miranda, M. Vega and E. Barrado, J. Chromatogr. A, 2011, 1218, 2196–2202 CrossRef CAS PubMed.
- G. F. Mu, H. T. Liu, L. N. Xu, L. H. Tian and F. Luan, Food Anal. Methods, 2012, 5, 148–153 CrossRef.
- J. Adrian, F. Fernandez, F. Sanchez-Baeza and M. P. Marco, J. Agric. Food Chem., 2012, 60, 3837–3846 CrossRef CAS PubMed.
- N. Pastor-Navarro, A. Maquieira and R. Puchades, Anal. Bioanal. Chem., 2009, 395, 907–920 CrossRef CAS PubMed.
- G. Wang, H. C. Zhang, J. Liu and J. P. Wang, Anal. Biochem., 2019, 564, 40–46 CrossRef PubMed.
- H. Koike, M. Kanda, H. Hayashi, Y. Matsushima, T. Nakajima, S. Yoshikawa, Y. Ohba, M. Hayashi, C. Nagano, K. Sekimura, K. Otsuka, T. Hashimoto and T. Sasamoto, Food Addit. Contam., Part B, 2021, 14, 66–73 CrossRef CAS PubMed.
- K. D. Pham, G. Degand, S. Danyi, G. Pierret, P. Delahaut, D. T. Vu, G. Maghuin-Rogister and M. L. Scippo, Anal. Chim. Acta, 2010, 672, 30–39 CrossRef PubMed.
- M. Kurzawa and A. Kowalczyk-Marzec, J. Pharm. Biomed. Anal., 2004, 34, 95–102 CrossRef CAS PubMed.
- A. Wong, M. Scontri, E. M. Materon, M. R. V. Lanza and M. Sotomayor, J. Electroanal. Chem., 2015, 757, 250–257 CrossRef CAS.
- Z. T. Wu, Y. B. Zhou, H. Y. Huang, Z. Su, S. M. Chen and M. C. Rong, Sens. Actuators, B, 2021, 332, 8 CrossRef.
- T. L. Wang, Q. S. Mei, Z. H. Tao, H. T. Wu, M. Y. Zhao, S. Wang and Y. Q. Liu, Biosens. Bioelectron., 2020, 148, 7 Search PubMed.
- Y. Q. Zhang, X. H. Wu, S. Mao, W. Q. Tao and Z. Li, Talanta, 2019, 204, 344–352 CrossRef CAS PubMed.
- W. Y. Li, J. C. Zhu, G. C. Xie, Y. K. Ren and Y. Q. Zheng, Anal. Chim. Acta, 2018, 1022, 131–137 CrossRef CAS PubMed.
- H. L. Tan and Y. Chen, Sens. Actuators, B, 2012, 173, 262–267 CrossRef CAS.
- J. H. Guo, W. J. Lu, H. L. Zhang, Y. T. Meng, F. F. Du, S. M. Shuang and C. Dong, Sens. Actuators, B, 2021, 330, 8 CrossRef.
- Q. Ouyang, Y. Liu, Q. S. Chen, Z. M. Guo, J. W. Zhao, H. H. Li and W. W. Hu, Food Control, 2017, 81, 156–163 CrossRef CAS.
- W. Wei, J. He, Y. Y. Wang and M. J. Kong, Talanta, 2019, 204, 491–498 CrossRef CAS PubMed.
- P. Jia, T. Bu, X. Y. Sun, Y. N. Liu, J. H. Liu, Q. Z. Wang, Y. H. Shui, S. W. Guo and L. Wang, Food Chem., 2019, 297, 7 CrossRef PubMed.
- Z. C. Hu, B. J. Deibert and J. Li, Chem. Soc. Rev., 2014, 43, 5815–5840 RSC.
- W. P. Lustig, S. Mukherjee, N. D. Rudd, A. V. Desai, J. Li and S. K. Ghosh, Chem. Soc. Rev., 2017, 46, 3242–3285 RSC.
- L. E. Kreno, K. Leong, O. K. Farha, M. Allendorf, R. P. Van Duyne and J. T. Hupp, Chem. Rev., 2012, 112, 1105–1125 CrossRef CAS PubMed.
- Y. J. Cui, Y. F. Yue, G. D. Qian and B. L. Chen, Chem. Rev., 2012, 112, 1126–1162 CrossRef CAS PubMed.
- Z. Yin, S. Wan, J. Yang, M. Kurmoo and M. H. Zeng, Coord. Chem. Rev., 2019, 378, 500–512 CrossRef CAS.
- Z. Ni and R. I. Masel, J. Am. Chem. Soc., 2006, 128, 12394–12395 CrossRef CAS PubMed.
- X. F. Wang, Y. B. Zhang, H. Huang, J. P. Zhang and X. M. Chen, Cryst. Growth Des., 2008, 8, 4559–4563 CrossRef CAS.
- S. Yuan, L. Feng, K. C. Wang, J. D. Pang, M. Bosch, C. Lollar, Y. J. Sun, J. S. Qin, X. Y. Yang, P. Zhang, Q. Wang, L. F. Zou, Y. M. Zhang, L. L. Zhang, Y. Fang, J. L. Li and H. C. Zhou, Adv. Mater., 2018, 30, 35 Search PubMed.
- Y. Bai, Y. B. Dou, L. H. Xie, W. Rutledge, J. R. Li and H. C. Zhou, Chem. Soc. Rev., 2016, 45, 2327–2367 RSC.
- Y. N. Dou, L. Guo, G. L. Li, X. X. Lv, L. Xia and J. You, Microchem. J., 2019, 146, 366–373 CrossRef CAS.
- T. Lu, L. C. Zhang, M. X. Sun, D. Y. Deng, Y. Y. Su and Y. Lv, Anal. Chem., 2016, 88, 3413–3420 CrossRef CAS PubMed.
- Z. H. Xiang, C. Q. Fang, S. H. Leng and D. P. Cao, J. Mater. Chem. A, 2014, 2, 7662–7665 RSC.
- M. Kandiah, M. H. Nilsen, S. Usseglio, S. Jakobsen, U. Olsbye, M. Tilset, C. Larabi, E. A. Quadrelli, F. Bonino and K. P. Lillerud, Chem. Mater., 2010, 22, 6632–6640 CrossRef CAS.
- Y. F. Zhao, D. F. Wang, W. Wei, L. Z. Cui, C. W. Cho and G. P. Wu, Environ. Sci. Pollut. Res., 2021, 28, 7068–7075 CrossRef CAS.
- H. L. Zhu, J. P. Huang, Q. Y. Zhou, Z. W. Lv, C. Y. Li and G. Hu, J. Lumin., 2019, 208, 67–74 CrossRef CAS.
- C. Y. Sun, R. F. Su, J. X. Bie, H. J. Sun, S. N. Qiao, X. Y. Ma, R. Sun and T. H. Zhang, Dyes Pigm., 2018, 149, 867–875 CrossRef CAS.
- J. Xu, X. K. Shen, L. Jia, T. Zhou, T. L. Ma, Z. Q. Xu, J. L. Cao, Z. J. Ge, N. Bi, T. F. Zhu, S. L. Guo and X. H. Li, J. Hazard. Mater., 2018, 342, 158–165 CrossRef CAS PubMed.
- X. Fang, S. B. Wu, Y. H. Wu, W. Yang, Y. L. Li, J. Y. He, P. D. Hong, M. X. Nie, C. Xie, Z. J. Wu, K. S. Zhang, L. T. Kong and J. H. Liu, Appl. Surf. Sci., 2020, 518, 10 CrossRef.
- L. Liu, W. Cui, C. Lu, A. B. Zain, W. Zhang, G. X. Shen, S. Q. Hu and X. Y. Qian, J. Environ. Manage., 2020, 268, 9 Search PubMed.
- C. M. Li, J. P. Huang, H. L. Zhu, L. L. Liu, Y. M. Feng, G. Hu and X. B. Yu, Sens. Actuators, B, 2017, 253, 275–282 CrossRef CAS.
- K. Y. A. Lin, Y. T. Liu and S. Y. Chen, J. Colloid Interface Sci., 2016, 461, 79–87 CrossRef CAS PubMed.
- P. Karthik, A. Pandikumar, M. Preeyanghaa, M. Kowsalya and B. Neppolian, Microchim. Acta, 2017, 184, 2265–2273 CrossRef CAS.
- Y. R. Du, X. Q. Li, H. J. Zheng, X. J. Lv and Q. Jia, Anal. Chim. Acta, 2018, 1001, 134–142 CrossRef CAS PubMed.
- Z. Q. Yang, X. W. Tong, J. N. Feng, S. He, M. L. Fu, X. J. Niu, T. P. Zhang, H. Liang, A. Ding and X. C. Feng, Chemosphere, 2019, 220, 98–106 CrossRef CAS PubMed.
- Y. Pan, X. Z. Yuan, L. B. Jiang, H. Wang, H. B. Yu and J. Zhang, Chem. Eng. J., 2020, 384, 16 Search PubMed.
- X. Y. He, F. Deng, T. T. Shen, L. M. Yang, D. Z. Chen, J. F. Luo, X. B. Luo, X. Y. Min and F. Wang, J. Colloid Interface Sci., 2019, 539, 223–234 CrossRef CAS PubMed.
- S. Chen, Y. L. Yu and J. H. Wang, Anal. Chim. Acta, 2018, 999, 13–26 CrossRef CAS PubMed.
- Y. Zhou, Q. Yang, D. N. Zhang, N. Gan, Q. P. Li and J. Cuan, Sens. Actuators, B, 2018, 262, 137–143 CrossRef CAS.
- G. W. Chen, F. L. Song, X. Q. Xiong and X. J. Peng, Ind. Eng. Chem. Res., 2013, 52, 11228–11245 CrossRef CAS.
- J. Y. Zhang, R. H. Zhou, D. D. Tang, X. D. Hou and P. Wu, TrAC, Trends Anal. Chem., 2019, 110, 183–190 CrossRef CAS.
- L. Han, Y. Z. Fan, M. Qing, S. G. Liu, Y. Z. Yang, N. B. Li and H. Q. Luo, ACS Appl. Mater. Interfaces, 2020, 12, 47099–47107 CrossRef CAS PubMed.
- H. L. Tan, X. Y. Wu, Y. H. Weng, Y. J. Lu and Z. Z. Huang, Anal. Chem., 2020, 92, 3447–3454 CrossRef CAS PubMed.
- L. Zhang and L. Chen, ACS Appl. Mater. Interfaces, 2016, 8, 16248–16256 CrossRef CAS PubMed.
- L. Chen, D. H. Liu, L. M. Zheng, S. M. Yi and H. He, Anal. Bioanal. Chem., 2021, 413, 4227–4236 CrossRef CAS PubMed.
- T. A. Ali, G. G. Mohamed, A. Z. El-Sonbati, M. A. Diab and A. M. Elkfass, Russ. J. Electrochem., 2018, 54, 1081–1095 CrossRef CAS.
- G. Krepper, G. D. Pierini, M. F. Pistonesi and M. S. Di Nezio, Sens. Actuators, B, 2017, 241, 560–566 CrossRef CAS.
- Z. P. Zhou, K. Lu, X. Wei, T. F. Hao, Y. Q. Xu, X. D. Lv and Y. F. Zhang, RSC Adv., 2016, 6, 71061–71069 RSC.
- H. E. Satana Kara, B. Demirhan and B. Er Demirhan, Turk. J. Chem., 2020, 44, 1713–1722 CrossRef CAS PubMed.
- B. Zhu, Z. Zong, X. Zhang, D. M. Zhang, L. S. Cui, C. F. Bi and Y. H. Fan, Appl. Organomet. Chem., 2020, 34, 11 Search PubMed.
- Y. R. Zhuang, B. X. Lin, Y. Yu, Y. M. Wang, L. Zhang, Y. J. Cao and M. L. Guo, Food Chem., 2021, 356, 8 CrossRef PubMed.
- X. Fu, R. Lv, J. Su, H. Li, B. Y. Yang, W. Gu and X. Liu, RSC Adv., 2018, 8, 4766–4772 RSC.
Footnote |
| † Electronic supplementary information (ESI) available. See https://doi.org/10.1039/d2ra04023a |
| This journal is © The Royal Society of Chemistry 2022 |

