 Open Access Article
Creative Commons Attribution 3.0 Unported Licence
Enhanced photocatalytic performance of carbon fiber paper supported TiO2 under the ultrasonic synergy effect†
Lei Zhanga,
Jiahui Zhanga,
Hui Sun *ac,
Weiwei Xia
 a,
Junhui Hea and
Jie Han
 b
b
aSchool of Physics Science and Technology, Yangzhou University, Yangzhou, Jiangsu 225002, P.R. China
bSchool of Chemistry and Chemical Engineering, Yangzhou University, Yangzhou, Jiangsu 225002, P. R. China
cNational Laboratory of Solid State Microstructures and Department of Physics, Nanjing University, Nanjing, 210093, P. R. China. E-mail: hsun@yzu.edu.cn
First published on 15th August 2022
Abstract
In the present work, TiO2 rutile nanorods and anatase nanoflakes have been grown on carbon fiber paper (CFP) by the hydrothermal method. Their photoelectrochemical properties and photocatalytic performances have been investigated. The introduction of CFP is found to improve visible light absorption intensity and effective surface areas apparently, and also make TiO2 photocatalysts easier to recycle from aqueous waste. An ultrasonic field was employed during the process of photocatalysis. Sono-photocatalytic efficiency is found to be enhanced significantly in comparison with those of photocatalysis and sonocatalysis, which indicates a positive ultrasonic synergy effect. The scavenger experiments reveal that superoxide radicals (˙O2−) and hydroxyl (˙OH) are the predominant active species during the dye degradation sono-photocatalytic process assisted by CFP-supported TiO2 catalysts. To investigate the ultrasonic synergy photocatalytic effect, the generated amount of reactive oxygen species (ROS) was detected and quantitatively evaluated under visible light, ultrasound, and the combined condition of visible light and ultrasound. As a result, the present work provides an efficient way to improve photocatalytic performance and to realize easy recovery of photocatalyst, which will be helpful for better design of advanced photocatalysts for practical applications.
Introduction
With rapid population growth and industrialization, the consumption of fossil fuels brings about more and more serious environmental contamination.1–3 Especially, wastewater contamination is threatening food security, human health, and economic development, so it is urgent to solve these problems with environmentally friendly, low-cost and highly-efficient methods. Photocatalysis can degrade organic pollutants into harmless substances with mild conditions and a simple process and has been considered to be an ideal technology to treat water contamination.4–7 At present, titanium dioxide (TiO2) is widely accepted as a promising photocatalytic material due to its low cost, high chemical inertness and supreme photocatalytic performance. However, TiO2 itself shows poor absorption of visible light and rapid recombination of photoinduced electrons and holes, which results in a lower photocatalytic efficiency.8–11 Thus, two solutions were suggested to improve its photocatalytic performance, i.e. to expand its spectral response region or to increase its utilization efficiency of photogenerated charges.12–14To construct different types of heterostructures, such as Schottky junctions, p–n junctions, type-II and z-scheme heterostructures etc. is generally considered to be the most effective way to improve the separation of photoinduced carriers.15–18 Meanwhile, an external field introduced in the process of photocatalysis, such as electric, thermal, magnetic, and ultrasonic field, can greatly favor the photoinduced carrier separation, improve the charge transport, and enhance photocatalytic efficiency. Ultrasonic fields, as a frequently applied noncontact field, is of obvious advantages and is suitable for some nonlaboratory applications.19,20 For instance, the joint application of both UV and ultrasound (US) was reported for the photocatalytic reaction of zeolite-loaded MgO nanoparticles (NPs) toward wastewater, the cavitation effect was observed which produces a hot spot phenomenon and accelerates the generation of free and highly reactive radicals that can attack the dye molecules directly.21 For the degradation reaction of N-doped TiO2 toward antibiotic ciprofloxacin by photocatalysis, sonocatalysis, and sono-photocatalysis, it was found that the simultaneous application of ultrasonic wave and visible light is much more effective than the one used alone.22 The microbubble produced by ultrasonic cavitation effect can bring about a violent microflow and shock wave, which will cause a rapid acceleration of the catalyst NPs and improve mass transfer between the liquid phase and the catalyst surface to avoid the accumulation of pollutants and intermediates.23–28 All of these factors will favor to improve photocatalytic performance greatly.
Nevertheless, a problem so called secondly contamination of photocatalysts arises in degrading process for aqueous waste, which should not be neglected. As is well known, photocatalysts with the small size and large BET surface area can help to improve the photocatalytic efficiency due to enough surface reactive sites and sufficient activity. Such small-sized particles however are not easy to collect from the wastewater, which causes difficulty for a simple recyclability of the photocatalysts. Fortunately, carbon fiber papers (CFPs) have been introduced as a substrate to grow photocatalysts, which can solve the problem mentioned above.29–33 Firstly, CFPs as the catalyst support, can be easily recycled from aqueous waste. Secondly, they can supply a larger surface area for the adsorption of organic reactants and more active sites for photocatalysis. Thirdly, CFPs are conductive, and they may accept photogenerated electrons from TiO2, which favors the separation of electron–hole pairs and significantly enhancing photocatalytic performance. Besides, TiO2 grown on CFPs could be easily built into photoelectrochemical (PEC) cells, which can keep work in a self-powered mode.34–37 However, fewer visible-light self-powered photodetectors with visible-light response has been reported before. It is still a challenge to fabricate an efficient PEC-type TiO2 photodetector with larger light response region and surface area to facilitate charge and mass transfer. Finally, CFPs are flexible and stable under corrosive conditions, which are very important in the practical application of catalysts.
In this work, carbon fiber papers were utilized as substrates to grow TiO2 nanostructures, so as to enhance visible light absorption. Sine both the crystalline phases and morphologies of TiO2 greatly affect the PEC and photocatalytic properties. Therefore, both rutile TiO2 nanorods (NRs) and anatase TiO2 nanoflakes (NFs) on CFPs were synthesized via the hydrothermal route. Their PEC performances were investigated to discuss the transfer rate of carriers, effective active surface area, and energy band structures of both TiO2 samples. And their photocatalytic performances were evaluated by degrading process for organic pollutants under visible light irradiation. To improve the photocatalytic efficiency, ultrasonic field was applied in the photocatalytic process, which is so-called sono-photocatalysis and exhibits much more superior photocatalytic efficiency than photocatalysis and sonocatalysis, and their mechanism will be discussed below. The results suggest that ultrasonic synergy is a promising approach for significant improvement in photocatalytic performance and practical application in environmental purification.
Experimental
Materials
Commercial carbon fiber papers were purchased from FuelCellStore. Tetrabutyl titanate Ti(OC4H9)4 (≥98%), hydrochloric acid HCl (36 ∼ 38%), and hydrofluoric acid HF (40%) were purchased from Sinopharm Chemical Reagent Company and used without further purification.Preparation for rutile and anatase phases TiO2 on the CFPs
At first step, tetrabutyl titanate Ti(OC4H9)4 (0.4–0.8 mL) was slowly added into HCl (15–16 mL, 5 M) solution and stirred for 30 min. For preparation of anatase phase TiO2, additional 0.3 mL of hydrofluoric acid (HF) was mixed in. The above solution was transferred into the 50 mL teflon-lined stainless-steel autoclave, where CFPs were immersed. The hydrothermal synthesis was conducted at 180 °C for 10–18 h, subsequently the autoclave was cooled to room temperature naturally. The rutile TiO2 NRs denoted as TiO2(R) was obtained after 18 h heat treatment, and the anatase TiO2 NFs denoted as TiO2(A) was gained after 10 h heat treatment. Finally, all samples were washed with deionized water and ethanol for three times, and dried at 70 °C for 12 h.The evaluation of catalytic activity and reactive oxygen species concentration
The photocatalytic performance of all the samples was evaluated by the photodegrading rhodamine B (RhB) under visible light illumination of a 400 W metal halide lamp. Before irradiation, 50 mg photocatalyst powders were dispersed in 50 mL RhB solution (5 mg L−1), and the mixed solution was kept in the darkness and stirred for 30 min to reach an adsorption–desorption equilibrium. In the process of photodegradation, 4 mL suspension was taken out at every 30 min interval, followed by centrifugation to separate the photocatalyst powders. The concentration of the filtrates was determined by measuring the absorption peak intensity at 554 nm with a UV-vis spectrophotometer. The photocatalytic properties of the samples were investigated by photodegrading organic pollutants, such as rhodamine B (RhB: 5 mg L−1), Methyl orange (MO: 5 mg L−1), and ofloxacin (OFLX: 20 mg L−1) aqueous solutions under visible light irradiation of a 400 W metal halide lamp with the wavelength from 380 to 800 nm. The CFP-supported TiO2 samples with dimensions of 2 × 1.5 cm2 were evaluated by the photocatalysis in 50 mL pollutant solutions. Before photocatalytic reaction, the samples and dye solutions were stirred in the dark for 30 min to achieve the adsorption–desorption equilibrium. During the visible light irradiation, about 4 mL of dye solutions were taken out every several minutes to analyzed their concentrations by UV-2700 UV-visible spectrophotometer. The spectra were scanned and analyzed to determine the concentration of pollutants according to the intensity at 554 nm for RhB, at 460 nm MO, and at 288 nm for OFLX. By putting the photocatalytic reactor into the ultrasonic pool with ∼28 kHz frequency and ∼90 W power, the ultrasonic was applied to promote photocatalytic activities, i.e. sono-photocatalysis. The reaction temperature was maintained around 25 °C by adding a small amount of zero-degree water frequently.The quantity of reactive oxygen species (ROS) generated under the irradiation of ultrasonic only and visible light only, as well as both ultrasonic and visible light was evaluated by the oxidation-extraction photometry (OEP) method. The typical process was described as follows. The TiO2 samples with dimensions of 2 × 1.5 cm2 firstly were put into 50 mL of 1,5-diphenylcarbohydrazide (DPCI, 1 × 10⁻³ mol L−1) solutions to evaluate the production of ROS under visible light, ultrasonic, and both visible light and ultrasonic. Every 20 min, 5 mL of DPCI solution was taken exactly and extracted with mixed solvent of benzene and carbon tetrachloride (volume ratio = 1![[thin space (1/6-em)]](https://www.rsc.org/images/entities/char_2009.gif) :
:![[thin space (1/6-em)]](https://www.rsc.org/images/entities/char_2009.gif) 1), forming diphenylcarbonzone (DPCO) extraction liquids. By using UV-2700 UV-visible spectrophotometer, the concentration of ROS was determined according to the spectra of DPCO extraction liquids whose typical absorption peak at 563 nm. Furthermore, the concentration of ˙OH and ˙O2− oxygen radicals was determined by terephthalic acid photoluminescence (TA-PL) and blue tetrazolium (NBT) transformation, respectively. TA can react with ˙OH radicals, and display a specific fluorescence emission maximum at 425 nm. Thus, the amount of ˙OH radicals can be determined by measuring the fluorescence intensity of the peak at 425 nm on a fluorescence spectrophotometer (Hitachi F-4500, Japan). NBT was applied to detect ˙O2− due to their reaction production exhibits a maximum absorbance at 259 nm, and the amount of generated ˙O2− over catalysts can be measured according to the reduction of NBT on UV-2700 UV-visible spectrophotometer. The quantification experiments of ˙OH and ˙O2− were carried out as follows: 2 × 1.5 cm2 of CFP-supported TiO2 samples was put in 50 mL TA (0.5 × 10⁻³ M) solution or NBT (0.025 × 10⁻³ M) solution, and was exposed to the irradiation of sole visible light, sole ultrasonic, and both visible light and ultrasonic. About 4 mL of the above suspension solution was taken and analyzed every 20 min. The quantification tests of reactive oxygen species were also carried out at 25 °C.
1), forming diphenylcarbonzone (DPCO) extraction liquids. By using UV-2700 UV-visible spectrophotometer, the concentration of ROS was determined according to the spectra of DPCO extraction liquids whose typical absorption peak at 563 nm. Furthermore, the concentration of ˙OH and ˙O2− oxygen radicals was determined by terephthalic acid photoluminescence (TA-PL) and blue tetrazolium (NBT) transformation, respectively. TA can react with ˙OH radicals, and display a specific fluorescence emission maximum at 425 nm. Thus, the amount of ˙OH radicals can be determined by measuring the fluorescence intensity of the peak at 425 nm on a fluorescence spectrophotometer (Hitachi F-4500, Japan). NBT was applied to detect ˙O2− due to their reaction production exhibits a maximum absorbance at 259 nm, and the amount of generated ˙O2− over catalysts can be measured according to the reduction of NBT on UV-2700 UV-visible spectrophotometer. The quantification experiments of ˙OH and ˙O2− were carried out as follows: 2 × 1.5 cm2 of CFP-supported TiO2 samples was put in 50 mL TA (0.5 × 10⁻³ M) solution or NBT (0.025 × 10⁻³ M) solution, and was exposed to the irradiation of sole visible light, sole ultrasonic, and both visible light and ultrasonic. About 4 mL of the above suspension solution was taken and analyzed every 20 min. The quantification tests of reactive oxygen species were also carried out at 25 °C.
PEC measurements
The PEC and electrochemical measurements were performed in 0.1 M Na2SO4 (pH = 7, 25 °C) solution using an electrochemical workstation (CHI 660E, China) with a platinum foil, a saturated Ag/AgCl were served as the counter electrode and reference electrode, respectively. The TiO2 nanorods and nanoflakes grown on CFPs with the effective area of 1 × 1 cm2 were used as the working electrode and placed in three-electrode cell. A 150 W Xe lamp with 420 nm cut-off filter (CEL-S500) was employed as the visible light source.Characterization
The crystal structures of both samples were investigated by an X-ray diffractometer (XRD, XRD-7000, Japan). Field emission scanning electron microscopy (SEM, S-4800II, Japan) was used to observe their morphology. UV-visible absorption spectroscopy was recorded with a UV–Vis–NIR spectrophotometer (Carry 5000, USA).Results and discussion
Fig. 1 shows the X-ray diffraction (XRD) patterns and SEM images of rutile phase TiO2 (TiO2(R)) NRs and anatase phase TiO2 (TiO2(A)) NFs. Here, C (111) diffraction peak can be obviously seen due to the CFP as a substrate. The diffraction peaks of TiO2 in rutile (see PDF card no. 21-1276) and anatase (see PDF card no. 84-1285) can be indexed in good agreement. Both the samples are identified to be randomly oriented polycrystalline and single phases without obvious impurities. The morphologies and microstructures for both samples were examined by SEM measurements. The SEM and magnified SEM photographs of in Fig. 1(b) and (c) show the nanorod microstructure of rutile TiO2(R), while Fig. 1(e) and (f) display the nanoflake morphology of anatase phase TiO2(A). For TiO2(R), its nanorod is of approximately 500 nm in diameter and is vertical to the surface of the carbon fiber. For TiO2(A), its nanoflake is vertically grown on the carbon fiber as well, with thickness of 600–800 nm and a diameter of 5–8 μm. Both nanorods and nanoflakes are found to be distributed densely and uniformly.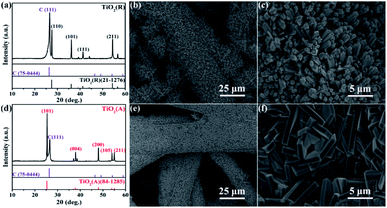 | ||
| Fig. 1 XRD patterns of (a) TiO2(R) and (d) TiO2(A), and low and high magnification SEM images of TiO2(R) nanorods (b and c) and TiO2(A) nanoflakes (e and f) grown on CFPs. | ||
Fig. 2(a) suggests UV-vis absorption spectra of both samples with the corresponding plot of (αhν) − hν2 plot shown in Fig. 2(b). And the UV-vis absorption spectra of single CFPs were also given in Fig. 2(a). It is clearly seen that both TiO2 samples show intense absorption in the range from UV to visible light, due to the visible light absorption of CFPs.38,39 The absorption band edge of TiO2 (R) NRs locates at ∼400 nm (Fig. 2(a)), and the corresponding energy gap is evaluated to be ∼2.90 eV (Fig. 2(b)) according to Kubelka–Munk (KM) equation,40 whereas the absorption band edge of TiO2 (A) NFs is at ∼370 nm (Fig. 2(a)), which indicates the energy gap is ∼3.06 eV (Fig. 2(b)). Therefore, the introduction of CFPs substrate increase visible light absorption apparently and meanwhile brings about a narrow band gap, which favors to promote photocatalytic reaction.
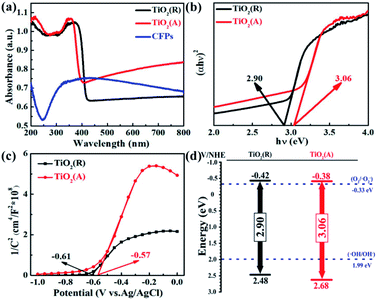 | ||
| Fig. 2 (a) UV-vis spectra, (b) the corresponding plot of (αhν)2 − hν, (c) Mott–Schottky plots, and (d) proposed energy band diagram for both TiO2 samples. | ||
To determine the semiconductor type for both TiO2 samples, Mott–Schottky (MS) curves were obtained from the electrochemical impedance spectroscopy measurement as displayed in Fig. 2(c), where ND and NA denote the concentration of donor and acceptor, and Efb refers to flat band potential. The MS equation can be described as:41
 | (1) |
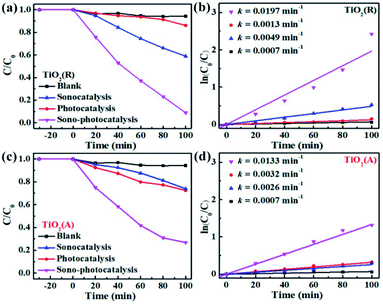
To evaluate the catalytic performance for both TiO2 samples, rhodamine B (RhB) dye degradation experiments were carried out under the irradiation of visible light only (photocatalysis), ultrasonic wave only (sonocatalysis), and both visible light and ultrasonic wave simultaneously (sono-photocatalysis). Fig. 3(a) shows the variation of the concentration of RhB over time under above three conditions. And the corresponding curves of ln(C0/C)-t according to the Lambert–Beer theory is presented in Fig. 3(b). The blank control test without catalyst was performed as well under the irradiation of both light and ultrasonic wave to demonstrate the stability of RhB. In absence of TiO2 catalyst, almost no decomposition for RhB is observed, which indicates the self-degradation of RhB is negligible under both light and ultrasonic wave. After illumination of visible light for 100 min, about 27.5% RhB pollutant was found to be degraded by TiO2(A) NFs, much larger than that of TiO2(R) NRs (13.9%), since TiO2(A) NFs exhibits much stronger absorption for visible light than TiO2(R) NRs. The photocatalytic performances for both TiO2 samples seem to be unsatisfactory. For comparison, the photocatalytic properties for both TiO2 phases reported by others are displayed in Table S1.† The catalyst dose of the CFP-supported TiO2 with areas of 2 × 1.5 cm2 is estimated to be 15 mg, corresponding to the approximate concentration ∼0.3 g L−1. The details for photodegradation experiments under ultraviolet light are listed in Table S1.† Above results indicate that the present CFP-supported TiO2(A) NFs show better photocatalytic performances.
After 100 min ultrasonic irradiation, the RhB degradation ratios is about 41.2% for TiO2(R) NRs and 24.8% for TiO2(A) NFs, respectively, which can be likely ascribed to the difference of acoustic cavitation effects. Both TiO2 samples are found to exhibit remarkable improvement in catalytic performance and reaction rate k under the co-excitation of visible light and ultrasonic. The sono-photocatalytic k value of TiO2(R) NRs is 15.2 times as large as photocatalytic k, and is 4 times as large as sonocatalytic k value, which is superior than that reported in Table S1.† Whereas, sono-photocatalytic k vale of TiO2(A) NFs increases to 3.2 and 4.1 times higher than those of photocatalysis and sonocatalysis, respectively.
Both the TiO2 samples were further investigated by degrading other pollutants under different external excitations. Anionic methyl orange (MO) dye and antibiotic ofloxacin (OFLX) were chosen as the objective pollutants, as shown in Fig. S1.† The sono-photocatalytic k values for TiO2(R) NRs and TiO2(A) NFs in MO degradation is about 0.0091 min−1 and 0.0072 min−1, respectively, which are much larger than the corresponding photocatalytic k and sonocatalytic k value. Similarly, sono-photocatalysis for both samples in OFLX degradation also exhibits the largest reaction rate k, in comparison with those of sonocatalysis and photocatalysis. The catalytic performances for both TiO2 samples in the degradation of above three pollutants are summarized in Fig. 4. The catalytic efficiency toward pollutant is found to be improved apparently under combined irradiation of visible light and ultrasonic wave as compared to individual illumination. The synergy index (SI) can be quantitatively evaluated by following equation:20
 | (2) |
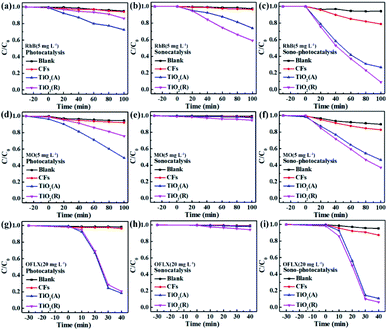 | ||
| Fig. 4 Photocatalytic, sonocatalytic, and sono-photocatalytic degradation for both TiO2 samples toward different pollutants. | ||
Cyclic experiments are usually utilized to evaluate the stability of catalysts. Here RhB is chosen as a target pollutant in the cyclic experiments of TiO2. Fig. 5 gives the sono-photocatalytic efficiency over cycles and the corresponding XRD patterns of TiO2 before and after cyclic experiments. Less than 5% decrease in degradation efficiency is observed and the XRD patterns keep almost same after fifth reaction, which proves that both TiO2 samples are of excellent chemical stability.
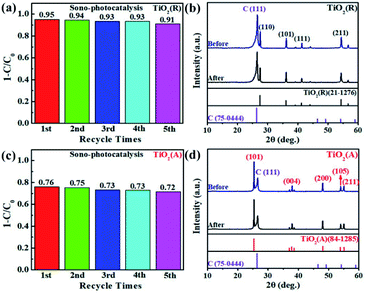 | ||
| Fig. 5 (a and c) Cyclic plots for sono-photocatalytic degradation plots of RhB by TiO2 samples, and (b and d) corresponding XRD patterns before and after cyclic experiments. | ||
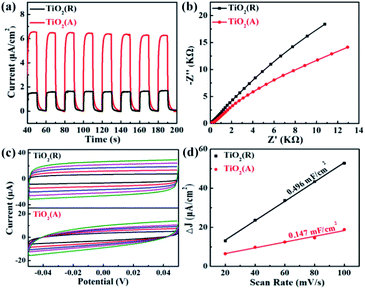
The transfer rate of carriers is known to be closely related with PEC properties. The transient photocurrent measurement for both TiO2 PEC detector was carried out using a continuous visible-light pulse with on-off interval of 10 s. The ignorable variation of photocurrent after 10 cycles of on-off illumination switching was observed as shown in Fig. 6(a). The maximal photocurrent of TiO2(A) NFs is found to be approximately 6.5 μA cm−2, which is nearly 4.1 times as large as ∼1.6 μA cm−2 for TiO2(R) NRs, which illustrates that TiO2(A) NFs has higher photoinduced carrier density and more efficient separation of charge carriers than TiO2(R) NRs.45 TiO2(A) NFs photodetector shows an excellent and reproducible photosensitivity performance, which may improve photocatalytic performance. To investigate the charge transfer and separation at photoanodes, the electrochemical impedance spectroscopy (EIS) has been carried out as presented in Fig. 6(b). The smaller radius of the semicircle at high frequency for TiO2(A) NFs indicates the lower charge-transfer resistance, which implies the faster charge transfer and separation.46 Due to higher photocurrent density and smaller charge-transfer resistance for TiO2(A) NFs exhibits better photocatalytic performance in agreement with the results shown in Fig. 3. Furthermore, to estimate the effective active surface area, cyclic voltammetry (CV) measurement was performed at various scan rate −0.05 ∼ 0.05 V vs. Ag/AgCl region, as illustrated in Fig. 6(c). The effective active surface area that is a close correlation with catalytic performance was evaluated by means of electrochemical double layer capacitance (EDLC).47 The current densities dependence on scan rate was shown in Fig. 6(d). The EDLC values of TiO2(R) NRs and TiO2(A) NFs were calculated to be 0.496 and 0.147 mF cm−2, respectively, which indicates that TiO2(R) NRs possesses much larger active surface area and more active sites than TiO2(A) NFs.
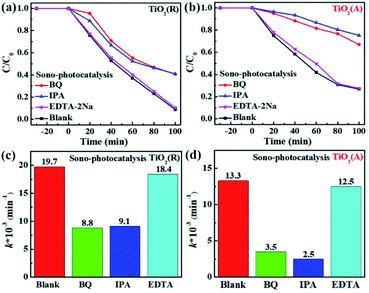
In order to understand the mechanism of sonocatalytic dynamic process and explore the role of active species in sono-photocatalysis, free radical trapping experiment has been performed. Benzoquinone (BQ), disodium ethylenediaminetetraacetate (EDTA-2Na) and iso-propyl alcohol (IPA) were adopted as scavengers for superoxide radicals (˙O2−), holes (h+), and hydroxyl (˙OH), respectively. Fig. 7 displays the sono-photocatalytic degradation of RhB dependent on time with and without the scavengers over both TiO2(R) NRs and TiO2(A) NFs. After adding EDTA-2Na, the degradation of RhB was almost unchanged, whereas BQ and IPA suppress the degradation efficiency greatly. As shown in Fig. 7(c and d), reaction rate constant k decreases rapidly after trapping ˙O2− or ˙OH radicals, which implies that ˙O2− and ˙OH radicals are two predominant active species during RhB sono-photocatalytic process. The sono-photocatalytic process can be described as following reactions:24
| catalyst + hν → e− + h+ | (3) |
| h+ + H2O → ˙OH + H+ | (4) |
| O2 + e− → ˙O2 | (5) |
| ˙O2− + e− + 2H+ → H2O2 | (6) |
| H2O2 → ˙OH + ˙OH | (7) |
| RhB + ˙O2− + OH → intermediates → CO2 + H2O | (8) |
As shown above, ˙OH can be formed by reaction (4) and reaction (7).48 Suppose that holes h+ was the main source for ˙OH, the degradation efficiency then will be significantly inhibited after adding EDTA-2Na as the hole scavenger. On the contrary, trapping holes will seriously slowed down the sono-photocatalytic degradation rate. The capture for ˙O2− radicals will dramatically reduce the photocatalytic efficiency as well. It can be concluded that ˙OH is formed by the dominant two-step reaction of ˙O2−. Holes play little role in dye degradation as well as the production of ˙OH.
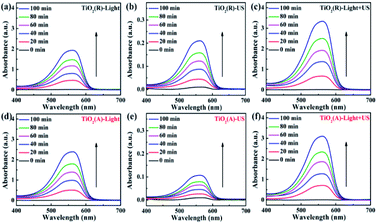
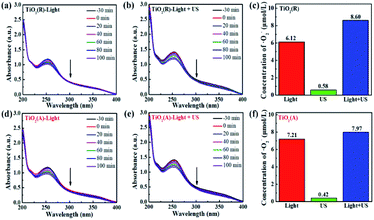
To elucidate the synergistic effects for ultrasonic wave in sono-photocatalytic process, the reactive oxygen species (ROS) production experiments were conducted based on oxidation-extraction photometry (OEP) method. In this method, 1,5-diphenylcarbohydrazide (DPCI) can be oxidized by ROS into diphenylcarbonzone (DPCO), and DPCO shows maximum absorption at 563 nm. The ROS quantity can be determined by UV-vis absorption spectrum of DPCO.25,27,28 Fig. 8 shows the UV-vis absorption spectrum of DPCO extract liquids after 100 min illumination of sole visible light, sole ultrasonic, as well as both light and ultrasonic. For either case, the intensity of DPCO absorption peak increases with the increase of time, suggesting the generated ROS increases with the increasing time, suggesting that the ROS generation increases with time. For both TiO2 samples, the intensity for DPCO absorption peak increases significantly under coexisting visible light and ultrasonic wave, compared with the cases under visible light or under ultrasonic wave. For a clear comparison, the UV-vis spectra of DPCO with and without TiO2 samples under 100 min illumination of sole visible light, sole ultrasonic, as well as both light and ultrasonic wave are presented in Fig. S2.† Therefore, synergistic effect of ultrasonic wave obviously favors to generate more ROS and to enhance the photocatalytic properties as discussed above.
There exists obvious difference in ROS experiment for TiO2(R) NRs and TiO2(A) NFs. TiO2(A) NFs can generate more ROS species than TiO2(R) NRs under the irradiation of visible light, therefore exhibits the higher photocatalytic efficiency. As discussed above, TiO2(A) NFs shows better visible light absorption, higher photogenerated carrier density, and more efficient separation of charge carriers, which will bring about higher photocatalytic efficiency compared with TiO2(R) NRs. To clarify the role of ultrasonic wave, the schematic diagram of TiO2 photocatalytic enhancement under the ultrasonic synergy effect was depicted in Fig. 9. Seen in the left plot of Fig. 9, electrons stimulated by visible light transfer from valence band (VB) to conduction band (CB), whereas some of them will recombine with holes, which is the reason for inhibited photocatalytic efficiency. Ultrasonic irradiation not only favors to light absorption in a wider wavelength range, but also produces “hot spots” due to cavitation effect, both of which can also promote electrons transition from VB to CB.24,27,28 Consequently, under the irradiation of both visible light and ultrasonic wave, more electron–hole pairs will be generated. These electrons and holes can react with the O2 dissolved in solution and H2O absorbed on the catalyst respectively, to produce ˙O2− and ˙OH radicals and to degrade dyes. Therefore, sono-photocatalytic efficiency is much higher than those photocatalysis and sonocatalysis. It was also noticed that TiO2(R) NRs is able to generate more ROS radicals under ultrasonic irradiation, which leads to a better sonocatalytic efficiency than TiO2(A) NFs. As discussed in PEC properties, TiO2(R) NRs possesses much larger effective active surface and more active sites than TiO2(A) NFs, which can improve ultrasound function and sonocatalytic activity. For both TiO2 samples, the amounts of ROS radicals under combined light and ultrasonic illumination are much greater than the sum of those under individual illumination of light and ultrasonic wave, which may be attributed to so-called synergy effect. In above discussion, a positive synergy effect has been demonstrated by the evaluation for SI value based on the co-contribution of photocatalysis and sonocatalysis. To compare the ultrasonic synergetic effect for different crystal phase TiO2 samples, the UV-vis spectra of DPCO after 100 min catalytic reaction under the different condition and corresponding intensity of DPCO peak are presented in Fig. S2.† After 100 min illumination of both visible light and ultrasonic wave, TiO2(R) NRs produces 7.4% ROS radicals more than that of TiO2(A) NFs, showing stronger sono-photocatalytic ability. In addition to the cavitation effect, ultrasound can promote mass transfer between the liquid phase and the catalyst surface as well, then catalytic reaction is accelerated.49 TiO2(R) NRs is of more effective surface areas and more active sites for catalytic reaction, therefore exhibiting better sono-photocatalytic performance than TiO2(A) NFs.
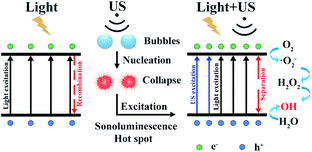 | ||
| Fig. 9 Schematic diagram of TiO2 for photocatalytic enhancement under the ultrasonic synergy effect. | ||
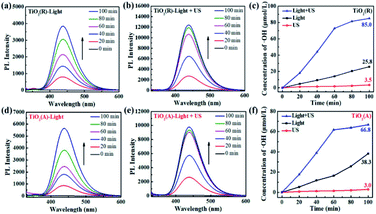
The results for scavenger experiments displayed in Fig. 7 indicate that ˙O2− and ˙OH play dominant role in pollutant degradation process. The formation rate of ˙O2− and ˙OH species have been investigated to understand the sono-photocatalytic mechanism. NBT and TA-PL transformation are known to be good method to evaluate better the generated amount of ˙O2− and ˙OH species, which were performed under the conditions of sole visible light, sole ultrasound, and visible light with ultrasound.50 Fig. 10(a–e) show the absorption intensity spectra of NBT for both TiO2 samples under visible light and visible light with ultrasonic irradiation. The absorption intensity was found to decreases more obviously under case of light plus ultrasonic wave, which means larger ˙O2− concentration. To compare the yield of ˙O2− under different conditions, the bar chart of the concentration of ˙O2− for both TiO2 samples are displayed in Fig. 10(c and f). Under illumination of the light plus ultrasonic wave, the ˙O2− concentration are evaluated to be 8.60 μmol L−1 for TiO2(R) NRs and 7.97 μmol L−1 for TiO2(A) NFs, former is more effective for ˙O2− generation.
Fig. 11(a–e) show the fluorescence intensity vs. wavelength of TA under different condition. The fluorescence intensity of TA is found to increase apparently due to the synergy effect of ultrasound. There exists a relationship between fluorescence intensity and ˙OH concentration can be described as follows:50
 | (9) |
Conclusions
Compared with commercial TiO2 powders, the TiO2 nanostructures rooted on CFPs show obvious advantages. The usage of CFPs can provide large surface areas and ensure enough light absorption and dye molecule adsorption, providing a good conductive channel for carrier transport and improving the photoresponse. The other advantage is the easy recovery as a photocatalyst when degrading aqueous waste. The PEC properties as well as photocatalytic performance for both TiO2 samples are investigated to degrade organic pollutants under visible light irradiation were performed. TiO2(A) NFs is found to show higher photocatalytic efficiency than TiO2(R) NRs, which may be ascribed to its better light absorption. Whereas, TiO2(R) NRs is found to exhibit better sonocatalytic performance than TiO2(A) NFs, which may be attributed to its larger surface areas. Moreover, the catalytic efficiency is found to be enhanced remarkably under the case of visible light plus ultrasonic wave, in comparison with the case of light or ultrasonic wave, which indicates there exist a positive ultrasonic synergy effect. Such positive synergistic effect of ultrasonic wave may provide an effective way to improve photocatalytic efficiency significantly.Conflicts of interest
There are no conflicts to declare.Acknowledgements
This work was supported by the National Science Foundation of China (Grant No. 51402256 and Grant No.11374227), Innovation Technology Platform Project (YZ2020268) jointly built by Yangzhou City and Yangzhou University, and Innovative Science and Technology Platform Project of Cooperation between Yangzhou City and Yangzhou University, China (No. YZ202026307).Notes and references
- H. Fujito, H. Kunioku, D. Kato, H. Suzuki, M. Higashi, H. Kageyama and R. Abe, J. Am. Chem. Soc., 2016, 138, 2082–2085 CrossRef CAS PubMed.
- K. M. Lee, C. W. Lai, K. S. Ngai and J. C. Juan, Water Res., 2016, 88, 428–448 CrossRef CAS PubMed.
- Z. Lu, J. Peng, M. Song, Y. Liu, X. Liu, P. Huo, H. Dong, S. Yuan, Z. Ma and S. Han, Chem. Eng. J., 2019, 360, 1262–1276 CrossRef CAS.
- L. Tang, Y. Ouyang, K. Sun and B. Yu, RSC Adv., 2022, 12, 19736–19740 RSC.
- G. Ren, H. Han, Y. Wang, S. Liu, J. Zhao, X. Meng and Z. Li, Nanomaterials, 2021, 11, 11071804 Search PubMed.
- E. Shakir, Z. Zahraw and A. H. M. J. Al-Obaidy, Egypt. J. Pet., 2017, 26, 95–102 CrossRef.
- Z. Xing, J. Zhang, J. Cui, J. Yin, T. Zhao, J. Kuang, Z. Xiu, N. Wan and W. Zhou, Appl. Catal. B Environ., 2018, 225, 452–467 CrossRef CAS.
- H. Abdullah, M. M. R. Khan, H. R. Ong and Z. Yaakob, J. CO2 Util., 2017, 22, 15–32 CrossRef CAS.
- I. Ali, M. Suhail, Z. A. Alothman and A. Alwarthan, RSC Adv., 2018, 8, 30125–30147 RSC.
- L. Li, J. Yan, T. Wang, Z. J. Zhao, J. Zhang, J. Gong and N. Guan, Nat. Commun., 2015, 6, 5881 CrossRef PubMed.
- L. Pan, M. Ai, C. Huang, L. Yin, X. Liu, R. Zhang, S. Wang, Z. Jiang, X. Zhang, J. J. Zou and W. Mi, Nat. Commun., 2020, 11, 418 CrossRef CAS PubMed.
- Q. Wu, S. Chai, H. Yang, Z. Gao, R. Zhang, L. Wang and L. Kang, Sep. Purif. Technol., 2020, 253, 117388 CrossRef CAS.
- H. Yin, Y. Cao, T. Fan, M. Zhang, J. Yao, P. Li, S. Chen and X. Liu, Sci. Total Environ., 2021, 754, 141926 CrossRef CAS PubMed.
- Z. Zhang, W. Wang, L. Wang and S. Sun, ACS. Appl. Mater. Inter., 2012, 4, 593–597 CrossRef CAS PubMed.
- X. Li, B. Kang, F. Dong, Z. Zhang, X. Luo, L. Han, J. Huang, Z. Feng, Z. Chen, J. Xu, B. Peng and Z. Wang, Nano Energy, 2021, 81, 105671 CrossRef CAS.
- Y. Wang, Q. Wang, X. Zhan, F. Wang, M. Safdar and J. He, Nanoscale, 2013, 5, 8326–8339 RSC.
- F. Q. Zhou, J. C. Fan, Q. J. Xu and Y. L. Min, Appl. Catal. B Environ., 2017, 201, 77–83 CrossRef CAS.
- Z. Zhuang, Y. Li, Z. Li, F. Lv, Z. Lang, K. Zhao, L. Zhou, L. Moskaleva, S. Guo and L. Mai, Angew. Chem., Int. Ed., 2018, 57, 496–500 CrossRef CAS PubMed.
- Q. Lei, S. Yang, D. Ding, J. Tan, J. Liu and R. Chen, J. Mater. Chem. A., 2021, 9, 2491–2525 RSC.
- X. Li, W. Wang, F. Dong, Z. Zhang, L. Han, X. Luo, J. Huang, Z. Feng, Z. Chen, G. Jia and T. Zhang, ACS Catal., 2021, 11, 4739–4769 CrossRef CAS.
- G. Zhang, A. Song, Y. Duan and S. Zheng, Micropor. Mesopor. Mat., 2018, 255, 61–68 CrossRef CAS.
- A. V. Karim and A. Shriwastav, Chem. Eng. J., 2020, 392, 124853 CrossRef CAS.
- M. Gągol, A. Przyjazny and G. Boczkaj, Chem. Eng. J., 2018, 338, 599–627 CrossRef.
- Y. Guo, C. Cheng, J. Wang, Z. Wang, X. Jin, K. Li, P. Kang and J. Gao, J. Hazard. Mater., 2011, 192, 786–793 CrossRef CAS PubMed.
- L. L. He, X. P. Liu, Y. X. Wang, Z. X. Wang, Y. J. Yang, Y. P. Gao, B. Liu and X. Wang, Ultrason. Sonochem., 2016, 33, 90–98 CrossRef CAS PubMed.
- Y. Son, M. Lim, J. Khim and M. Ashokkumar, Ind. Eng. Chem. Res., 2011, 51, 232–239 CrossRef.
- J. Wang, Y. Guo, B. Liu, X. Jin, L. Liu, R. Xu, Y. Kong and B. Wang, Ultrason. Sonochem., 2011, 18, 177–183 CrossRef CAS PubMed.
- M. Zou, Y. Kong, J. Wang, Q. Wang, Z. Wang, B. Wang and P. Fan, Spectrochim. Acta. A., 2013, 101, 82–90 CrossRef CAS PubMed.
- W. Chen, X. Feng, D. Zhang, F. Lu, H. Wang, J. Tan, Q. Xu, Y. Liu, Z. Cao and X. Su, RSC Adv., 2022, 12, 19974–19980 RSC.
- D. Kong, H. Wang, Z. Lu and Y. Cui, J. Am. Chem. Soc., 2014, 136, 4897–4900 CrossRef CAS PubMed.
- T. Ma, J. Ran, S. Dai, M. Jaroniec and S. Qiao, Angew. Chem., Int. Ed., 2015, 54, 4646–4650 CrossRef CAS PubMed.
- W. Wang, R. Yang, T. Li, S. Komarneni and B. Liu, Compos. Part. B., 2021, 205, 108512 CrossRef CAS.
- B. Zhang, F. Kang, J. M. Tarascon and J. K. Kim, Prog. Mater. Sci., 2016, 76, 319–380 CrossRef CAS.
- W. Guo, C. Xu, X. Wang, S. Wang, C. Pan, C. Lin and Z. L. Wang, J. Am. Chem. Soc., 2012, 134, 4437–4441 CrossRef CAS PubMed.
- W. Guo, F. Zhang, C. Lin and Z. L. Wang, Adv. Mater., 2012, 24, 4761–4764 CrossRef CAS PubMed.
- N. Li, L. Han, H. Zhang, J. Huang, X. Luo, X. Li, Y. Wang, W. Qian and Y. Yang, Nano Res. DOI:10.1007/s12274-022-4588-8.
- M. Volokh, G. Peng, J. Barrio and M. Shalom, Angew. Chem., Int. Ed., 2019, 58, 6138–6151 CrossRef CAS PubMed.
- R. Beranek, Adv. Phys. Chem., 2011, 2011, 1–20 CrossRef.
- A. Kumar, P. Choudhary, A. Kumar, P. H. C. Camargo and V. Krishnan, Small, 2022, 18, 2101638 CrossRef CAS PubMed.
- L. Lu, R. Shan, Y. Shi, S. Wang and H. Yuan, Chemosphere, 2019, 222, 391–398 CrossRef CAS PubMed.
- J. Shi, J. Chen, G. Li, T. An and H. Yamashita, Catal. Today, 2017, 281, 621–629 CrossRef CAS.
- L. Li, K. Zhang, W. Jin, W. Xia, J. He and X. Zeng, Int. J. Hydrogen Energy, 2022, 47, 10594–10602 CrossRef CAS.
- X. Wang, X. Wang, J. Huang, S. Li, A. Meng and Z. Li, Nat. Commun., 2021, 12, 4112 CrossRef CAS PubMed.
- W. Xia, H. Qian, X. Zeng, J. Dong, J. Wang and Q. Xu, J. Phys. Chem. C, 2017, 121, 19036–19043 CrossRef CAS.
- X. Cheng, H. Liu, Q. Chen, J. Li and X. Yu, J. Alloy. Compd., 2013, 566, 120–124 CrossRef CAS.
- S. A. M. Samsuri, M. Y. A. Rahman and A. A. Umar, Ionics, 2017, 23, 1897–1902 CrossRef CAS.
- S. Sheng, K. Ye, Y. Gao, K. Zhu, J. Yan, G. Wang and D. Cao, J. Colloid. Interf. Sci., 2021, 602, 325–333 CrossRef CAS PubMed.
- C. Hu, H. Huang, F. Chen, Y. Zhang, H. Yu and T. Ma, Adv. Funct. Mater., 2019, 30, 1908168 CrossRef.
- M. T. Taghizadeh and R. Abdollahi, Ultrason. Sonochem., 2011, 18, 149–157 CrossRef CAS PubMed.
- E. Lin, Z. Kang, J. Wu, R. Huang, N. Qin and D. Bao, Appl. Catal. B Environ., 2021, 285, 119823 CrossRef CAS.
Footnote |
| † Electronic supplementary information (ESI) available. See https://doi.org/10.1039/d2ra04240a |
| This journal is © The Royal Society of Chemistry 2022 |

